Copyright
©The Author(s) 2025.
World J Radiol. Jun 28, 2025; 17(6): 108247
Published online Jun 28, 2025. doi: 10.4329/wjr.v17.i6.108247
Published online Jun 28, 2025. doi: 10.4329/wjr.v17.i6.108247
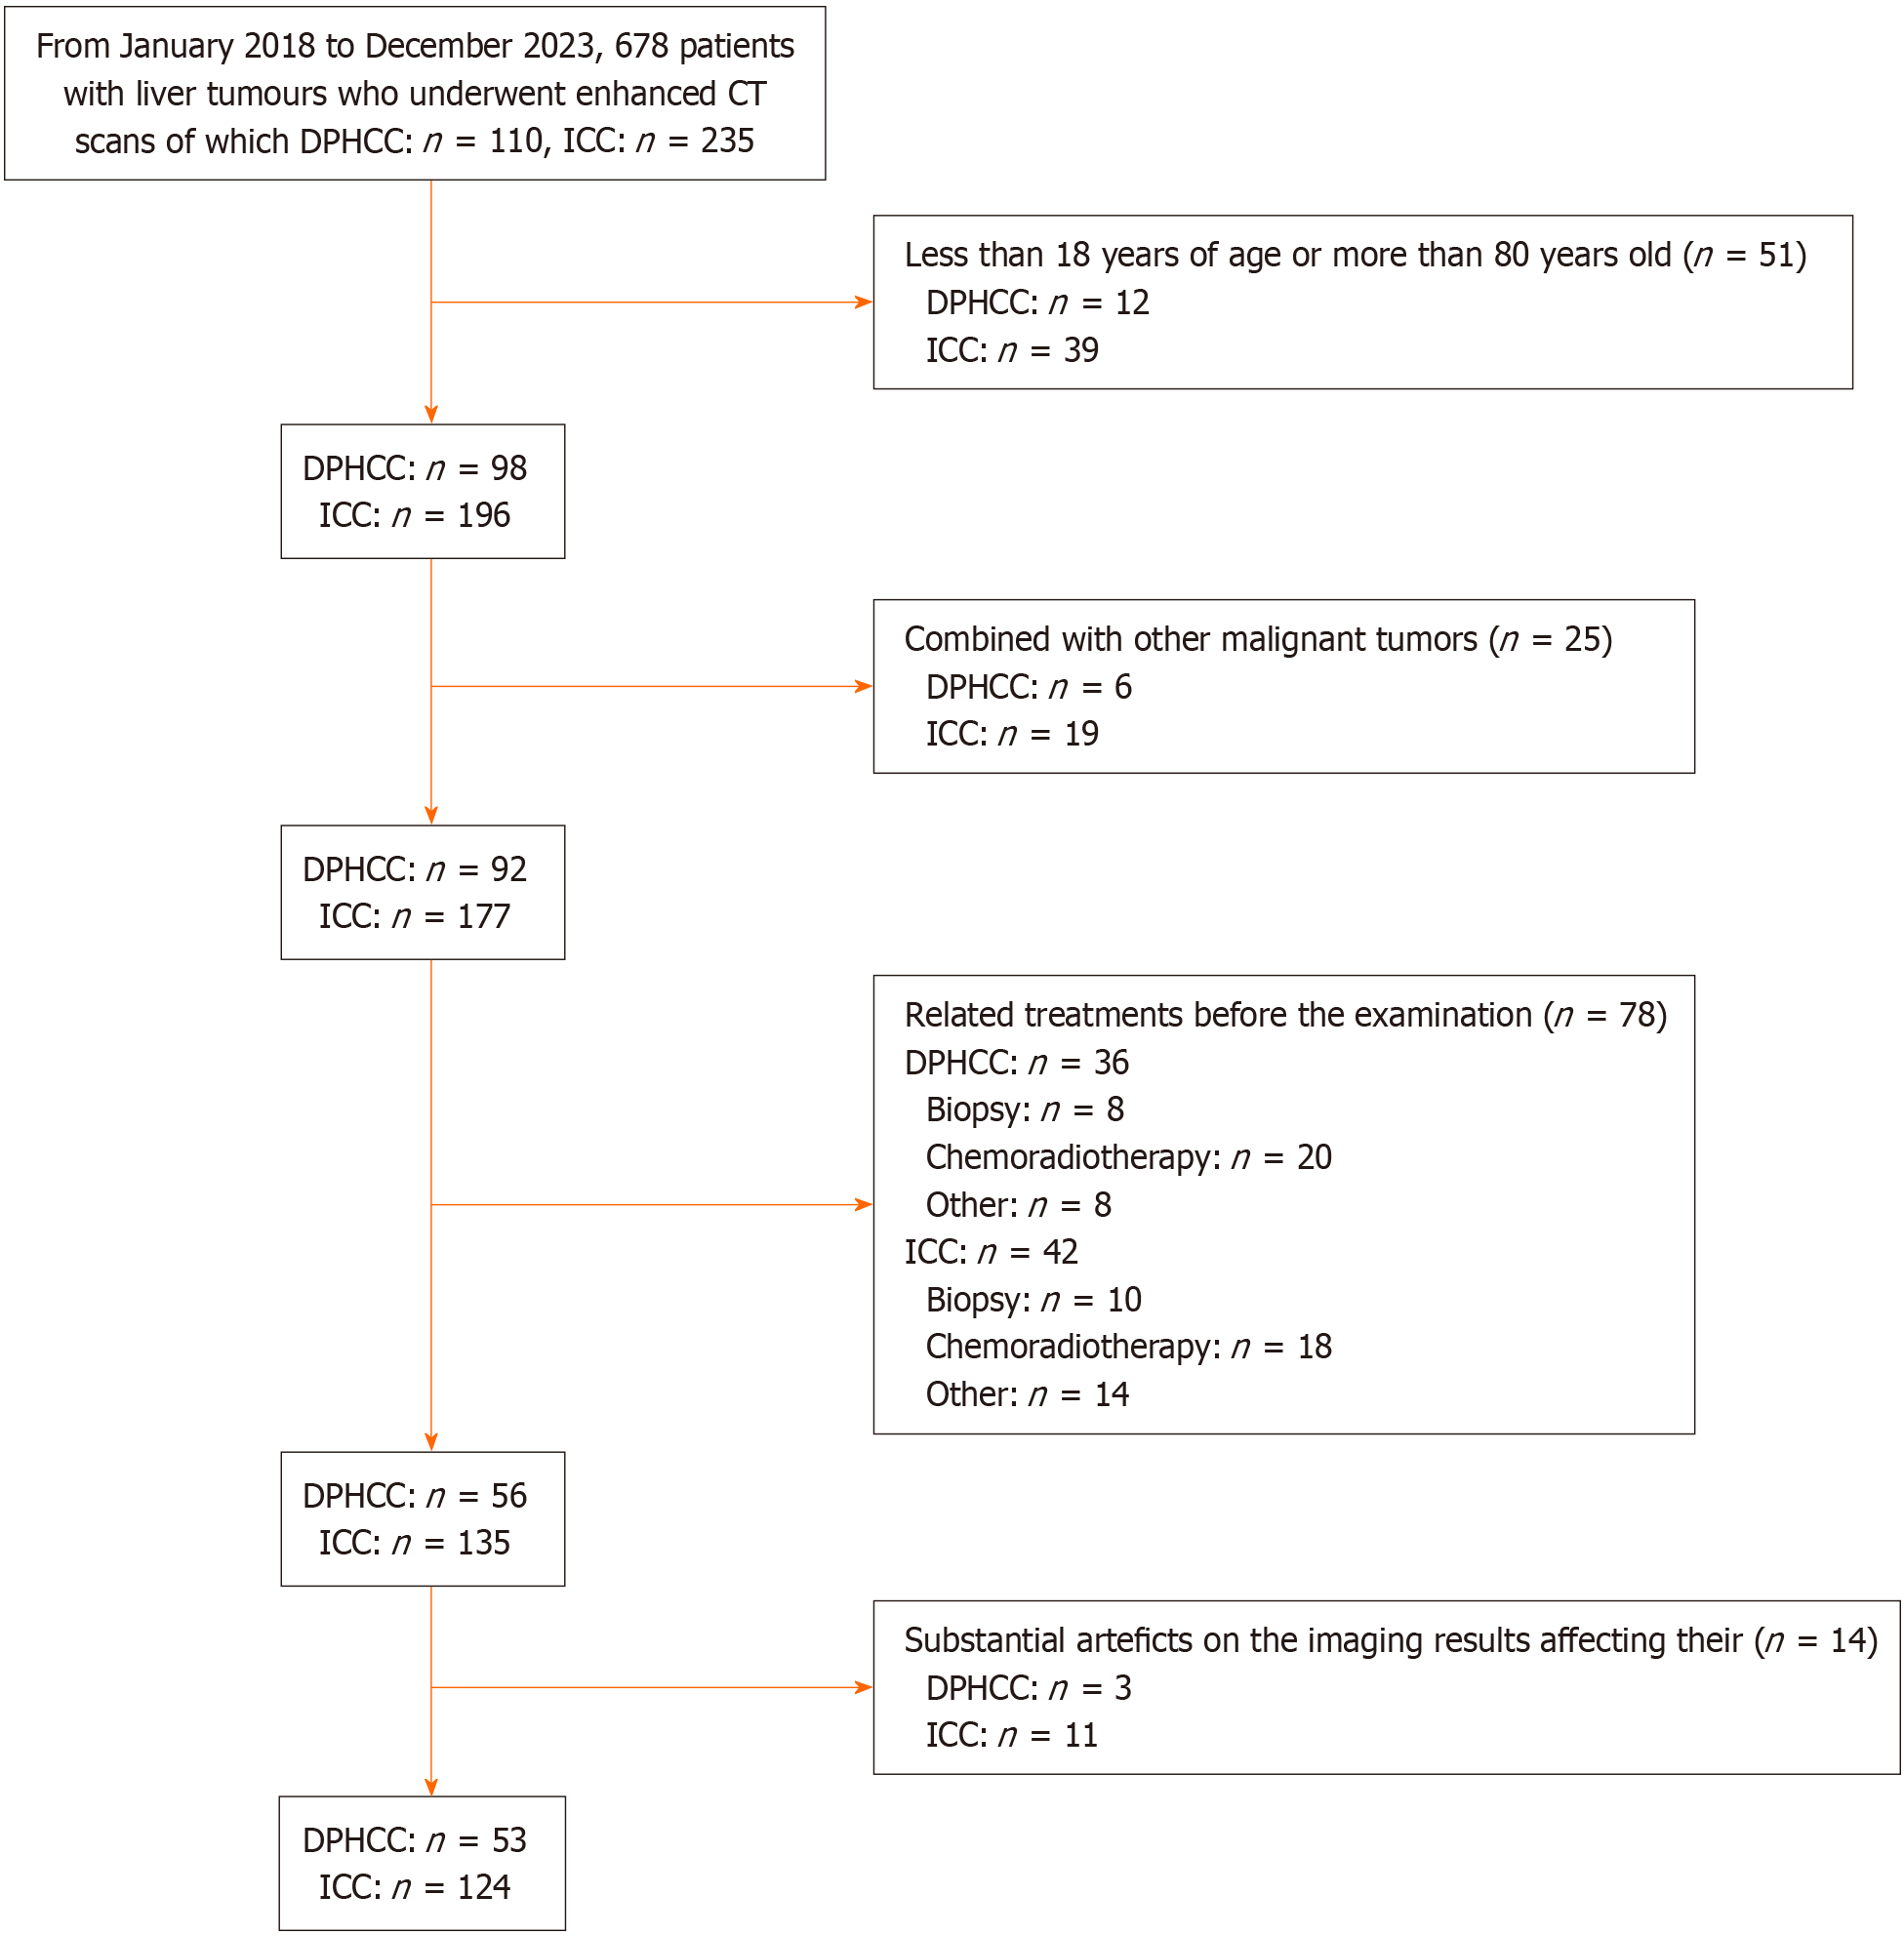
Figure 1
Flowchart of patient selection.
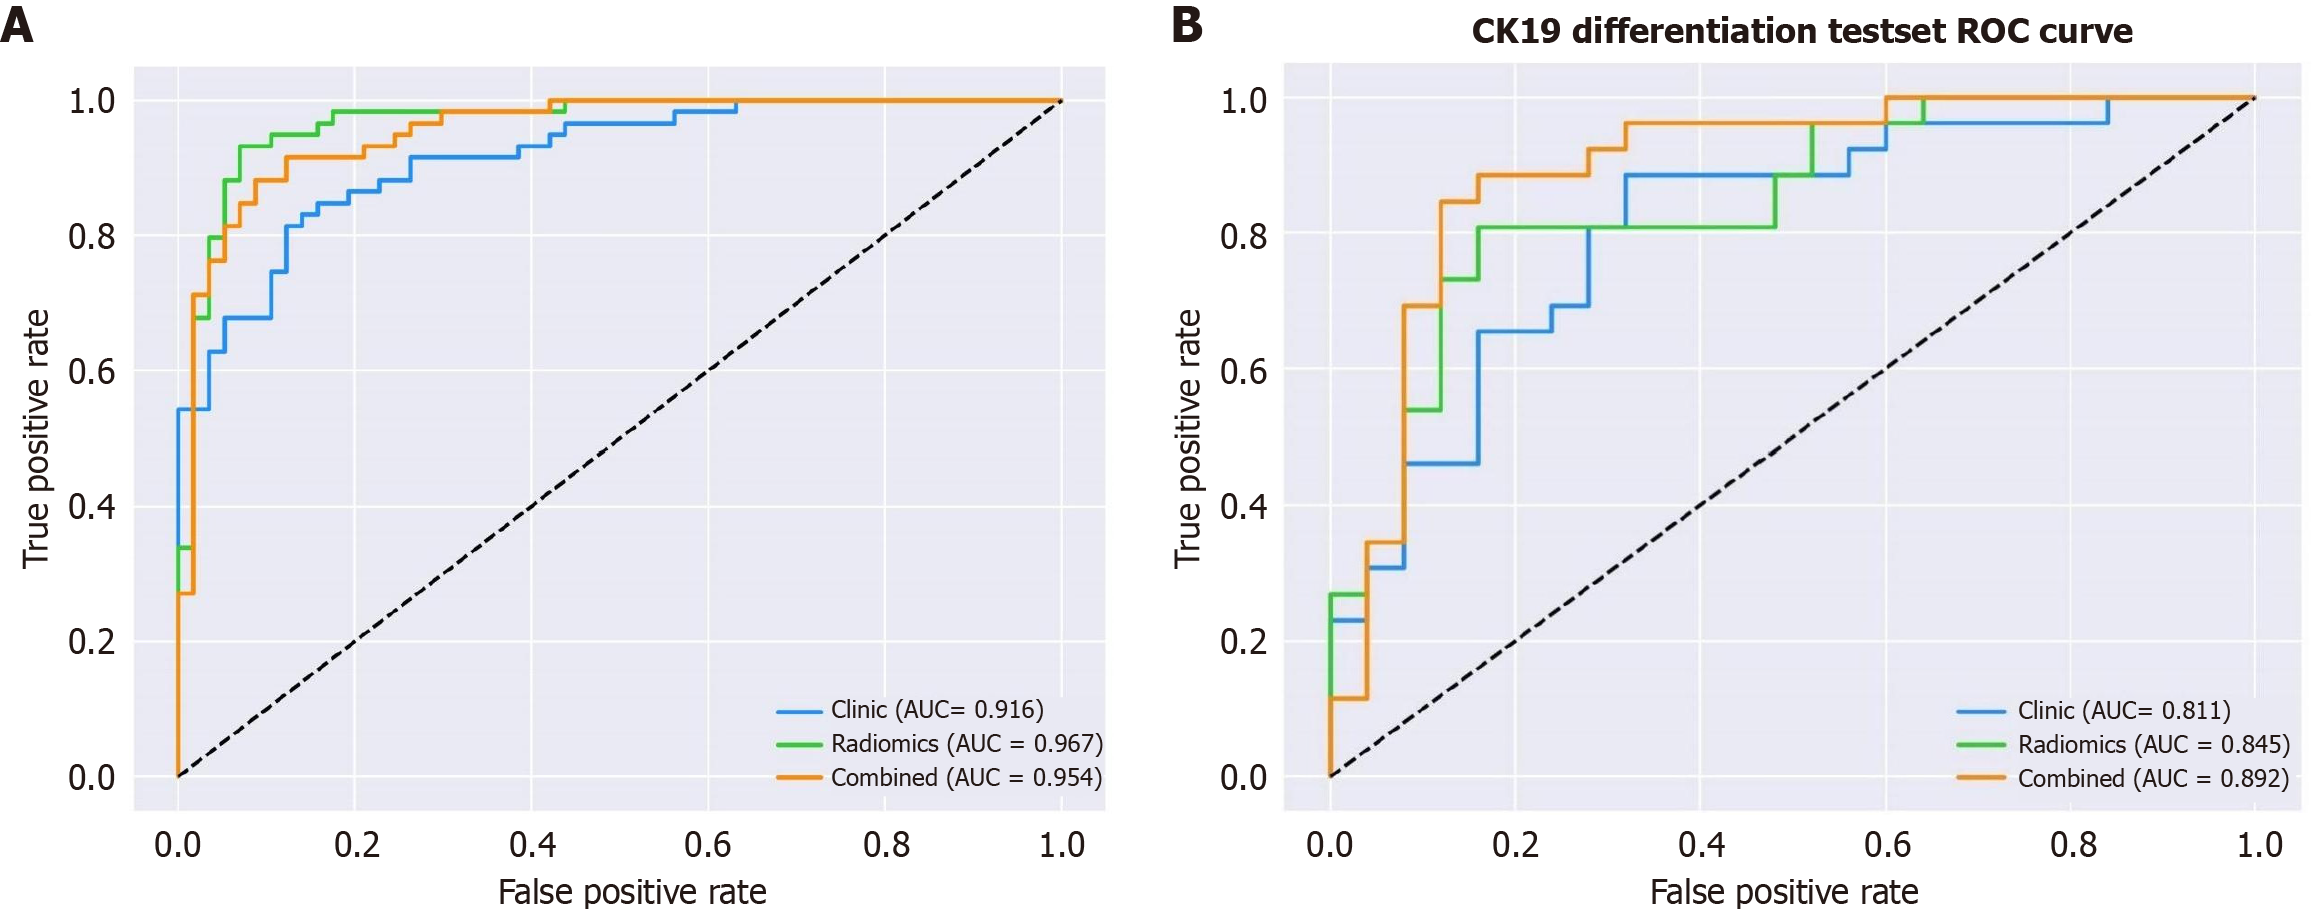
Figure 2 Area under the curve values of the clinical-sign model, radiomic model, and combined model.
A: The training set; B: The testing set. AUC: Area under the curve; ROC: Receiver operating characteristic.
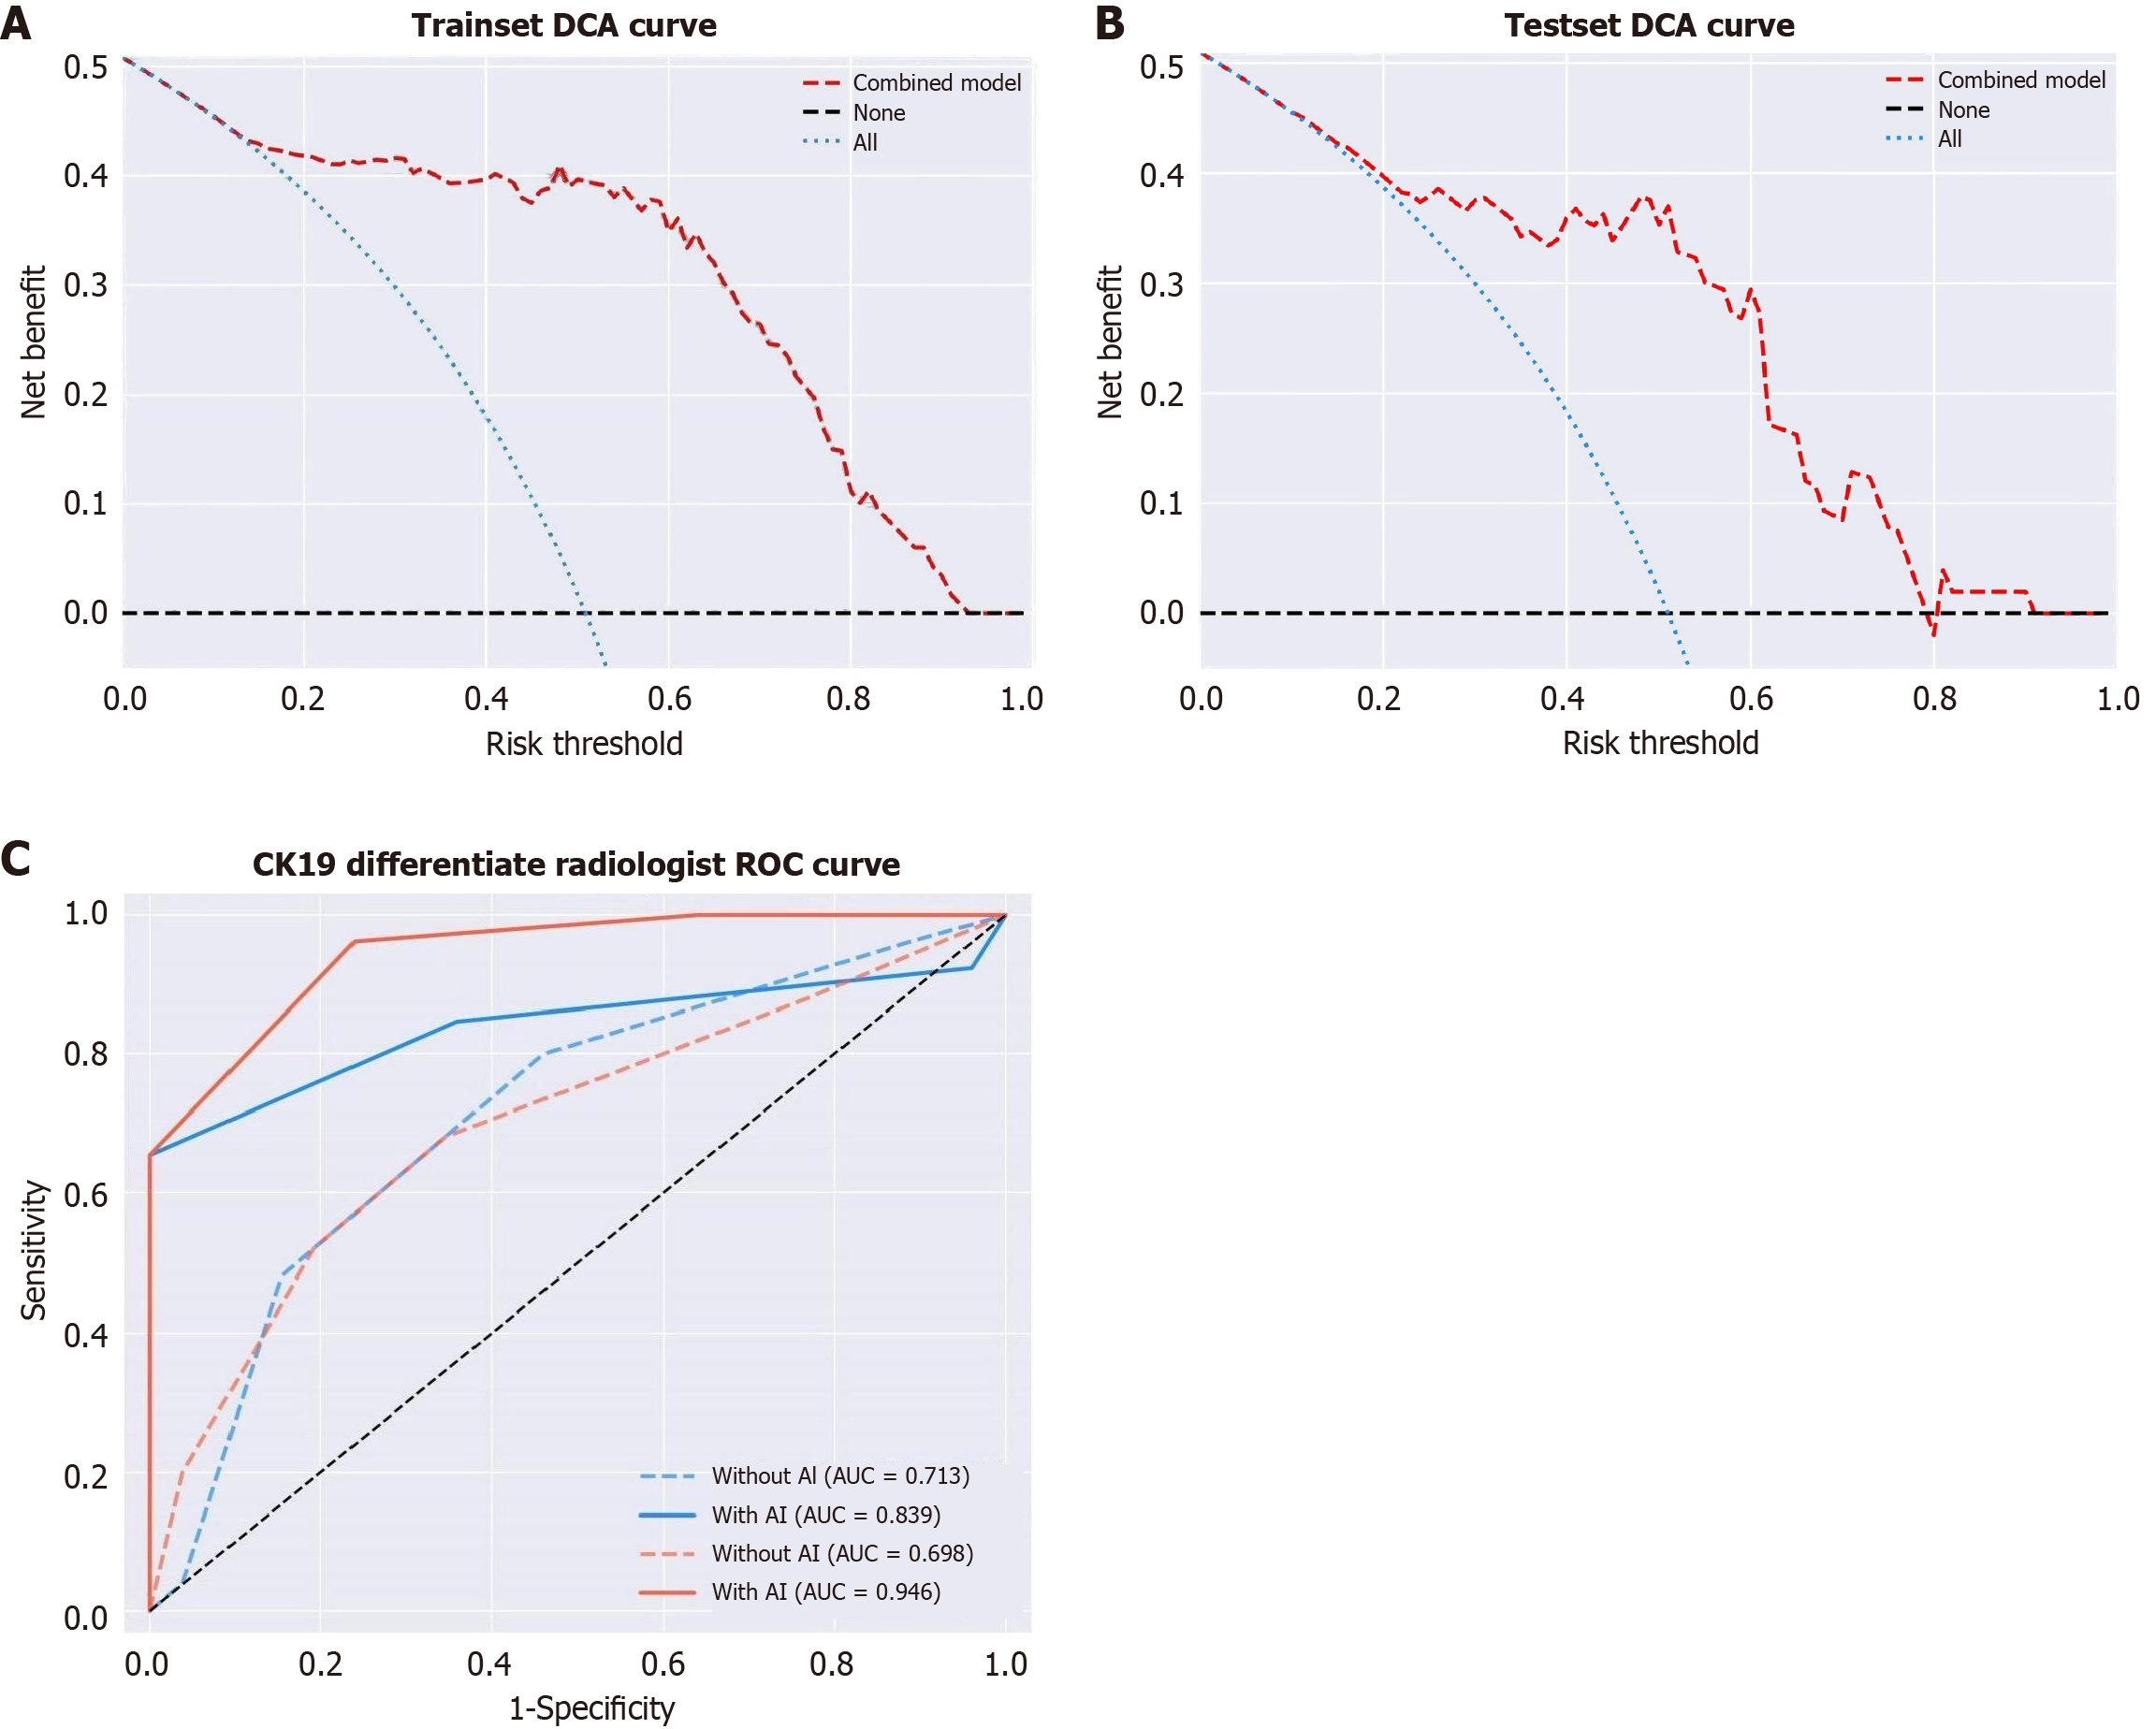
Figure 3 Clinical application value of the best model.
A: Calibration curves for the best model; B: Decision curve analysis for the best model; C: With the assistance of the best model, the area under the curve values of Doctor D and Doctor E changed. DCA: Decision curve analysis; AUC: Area under the curve; ROC: Receiver operating characteristic.
- Citation: Zhang CC, Lu D, Yang J, Zhang L, Zeng XF, Fang XM, Fan CG. Clinical value and applicability of radiomics in differential diagnosis of dual-phenotype hepatocellular carcinoma and intrahepatic cholangiocarcinoma. World J Radiol 2025; 17(6): 108247
- URL: https://www.wjgnet.com/1949-8470/full/v17/i6/108247.htm
- DOI: https://dx.doi.org/10.4329/wjr.v17.i6.108247


