Copyright
©The Author(s) 2018.
World J Radiol. Jul 28, 2018; 10(7): 78-82
Published online Jul 28, 2018. doi: 10.4329/wjr.v10.i7.78
Published online Jul 28, 2018. doi: 10.4329/wjr.v10.i7.78
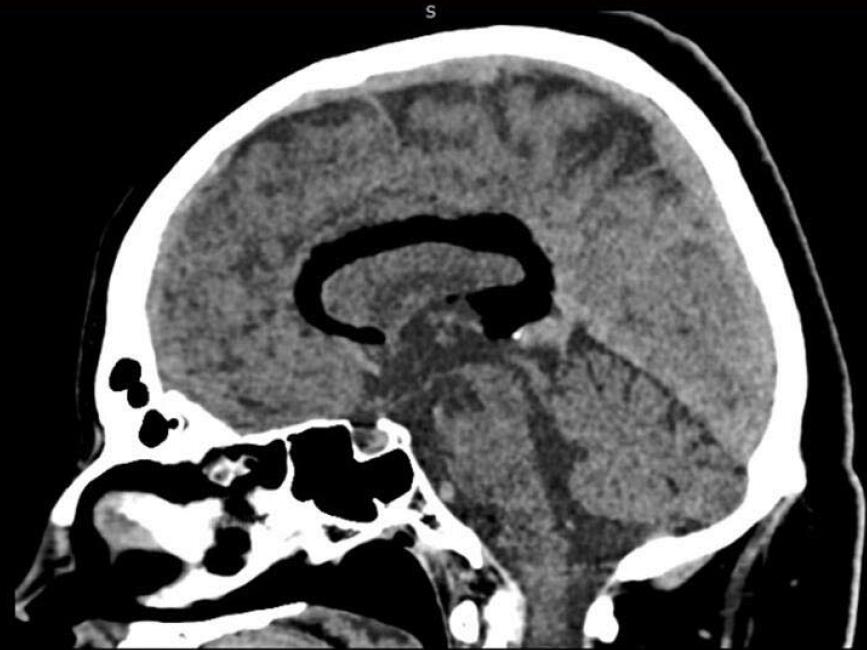
Figure 1 Paramedian left non-contrast computer tomography scan.
This scan shows a curvilinear fat density lesion above the corpus callosum.
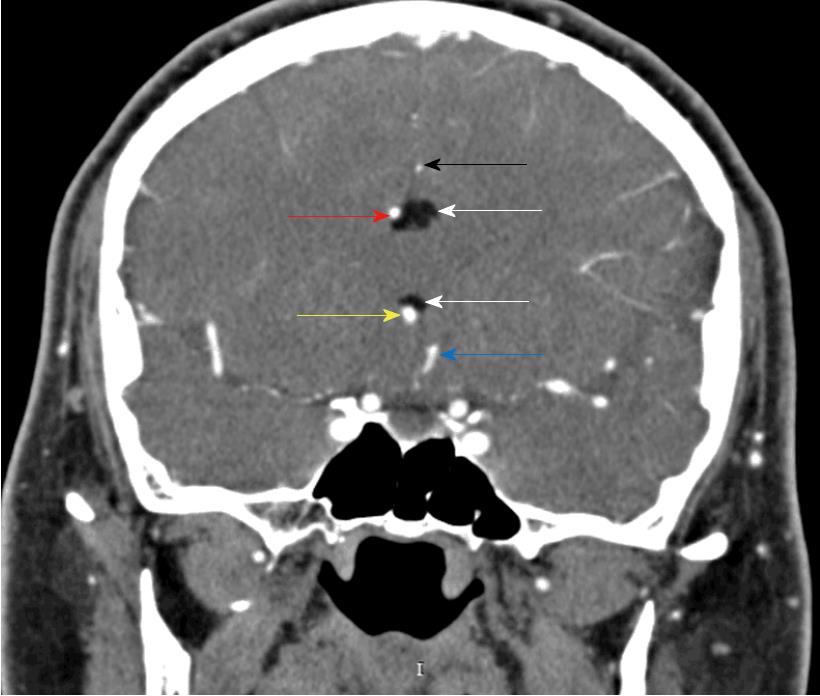
Figure 2 Coronal DSA.
Shows the lipoma (white arrows), the right rostral A2 (yellow arrow), the right pericallosal artery (red arrow), the left rostral A2 (blue arrow), and the left pericallosal artery (black arrow).
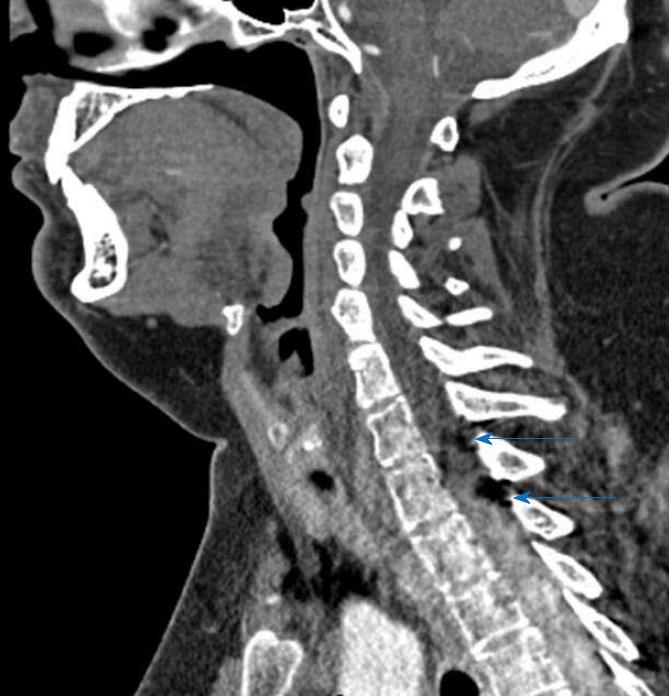
Figure 3 Sagittal CT angiography.
Shows two hypodense images compatible with lipomas within the extradural compartment, dorsal to the cord at the T1-T2 level.
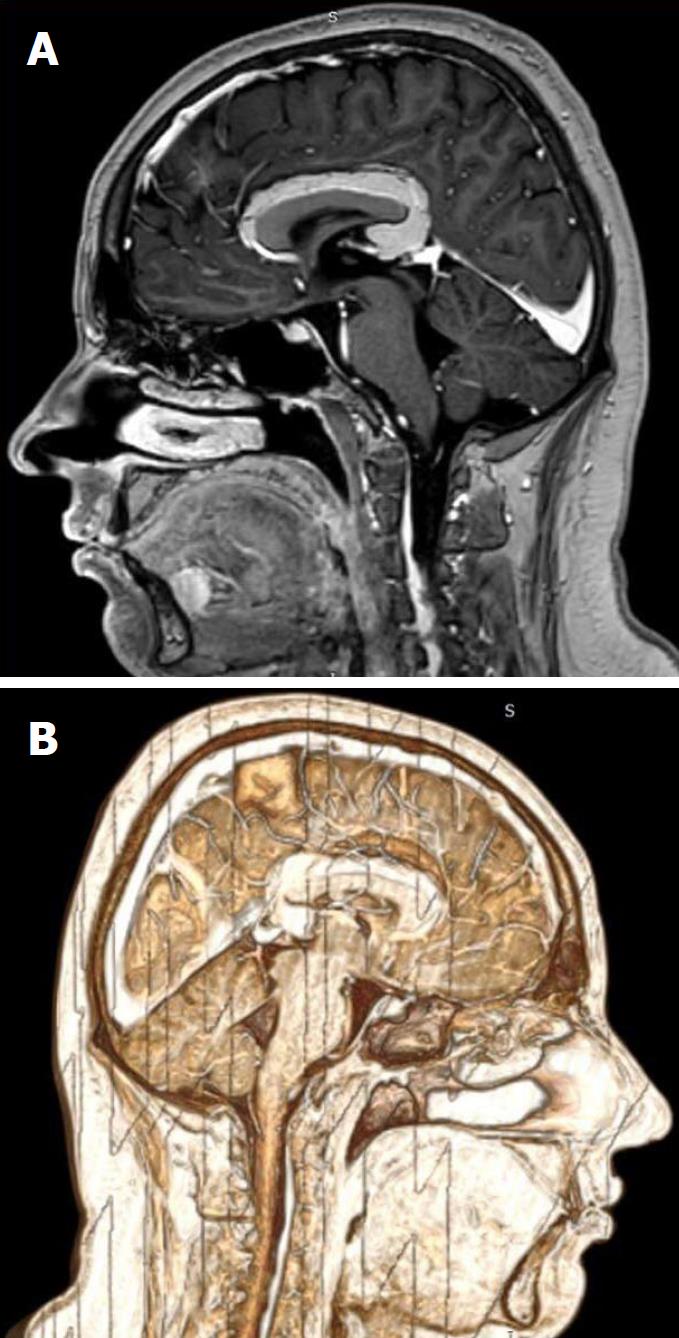
Figure 4 T1-W 3D TFE + MDC magnetic resonance imaging.
A: Showing the relationships between vasculature, corpus callosum, lipoma and adjacent brain tissues; B: Showing the pericallosal lesion, compatible with a complete curvilinear lipoma without callosal aplasia.
- Citation: Spanu F, Saba L. Obesity and pericallosal lipoma in X-linked emery-dreifuss muscular dystrophy: A case report - Does Emerin play a role in adipocyte differentiation? World J Radiol 2018; 10(7): 78-82
- URL: https://www.wjgnet.com/1949-8470/full/v10/i7/78.htm
- DOI: https://dx.doi.org/10.4329/wjr.v10.i7.78


