Copyright
©2009 Baishideng Publishing Group Co.
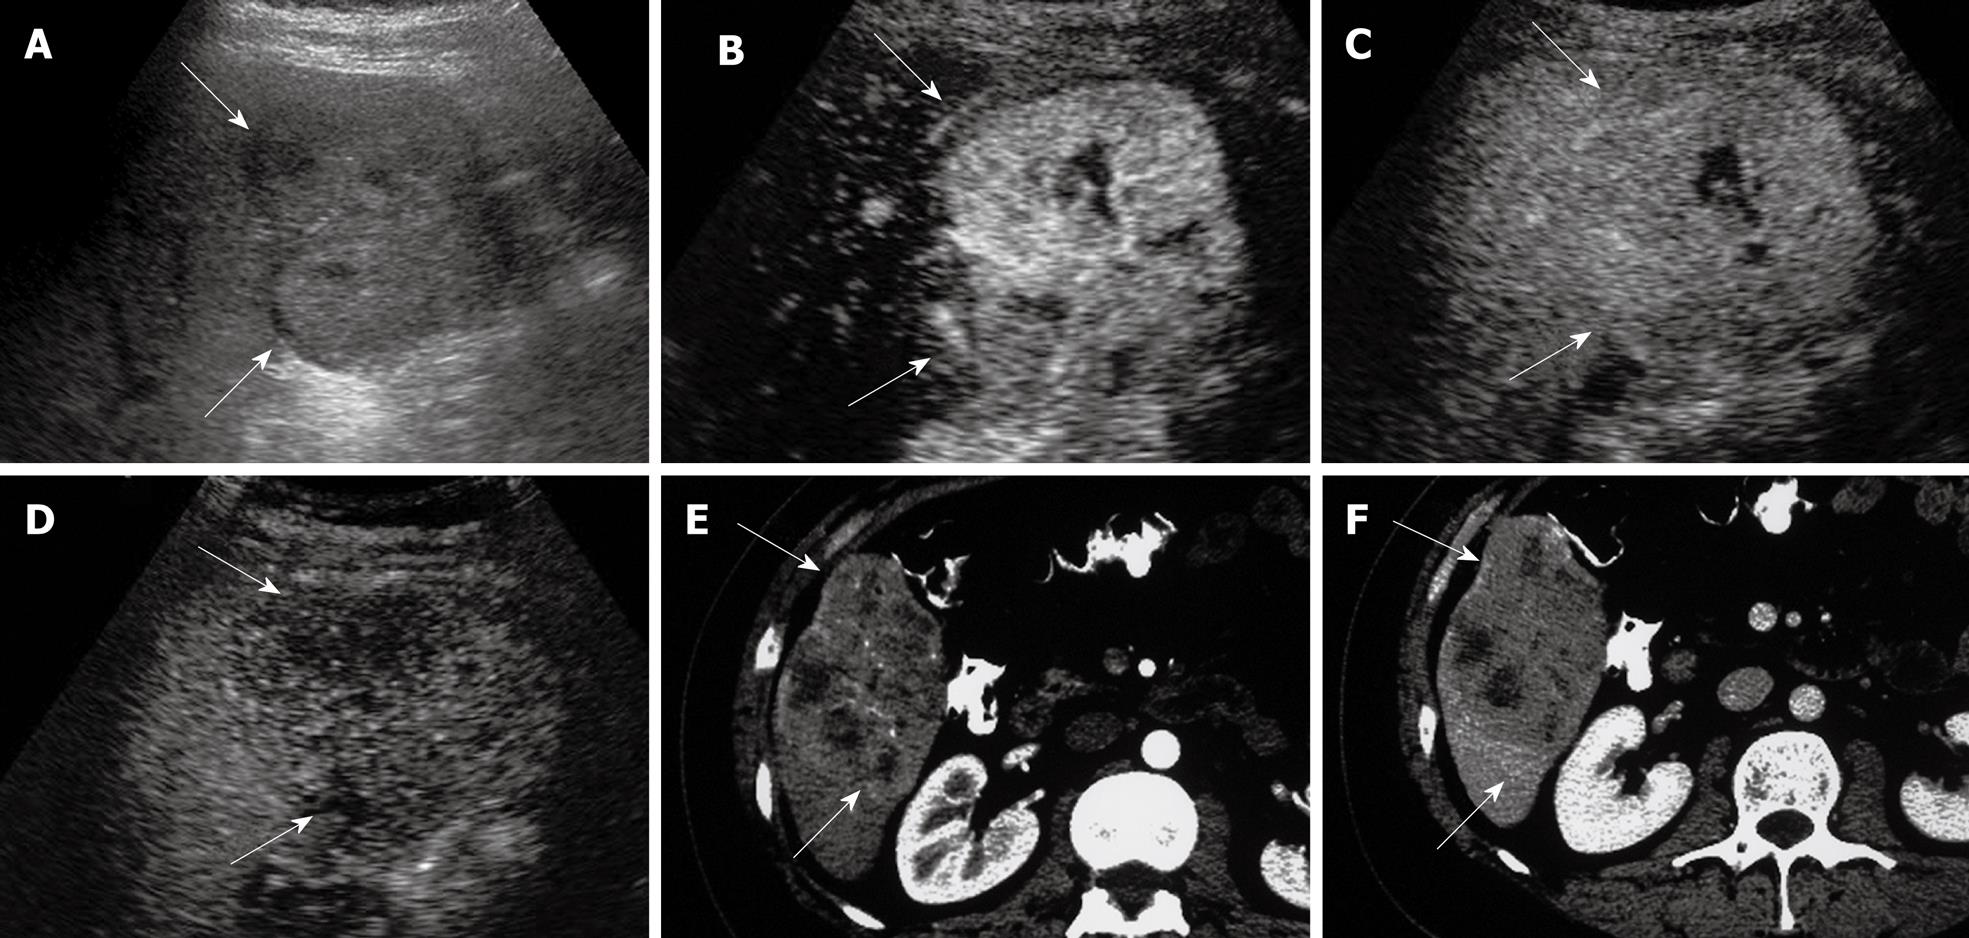
Figure 1 Hepatocellular carcinoma.
A: Gray-scale sonogram shows an isoechogenic nodule (arrows); B: Contrast-enhanced ultrasound (CEUS) scan at arterial phase shows homogeneous hyper-enhancement (arrows); C: CEUS scan at portal phase shows iso-enhancement in comparison with adjacent-liver tissue (arrows); D: CEUS scan at late phase shows hypo-enhancement in comparison with adjacent-liver tissue (arrows); E: Computed tomography (CT) scan shows hyper-attenuation of the nodule (arrows) during the arterial phase; F: CT scan during the portal phase shows hypo-attenuation (arrows).
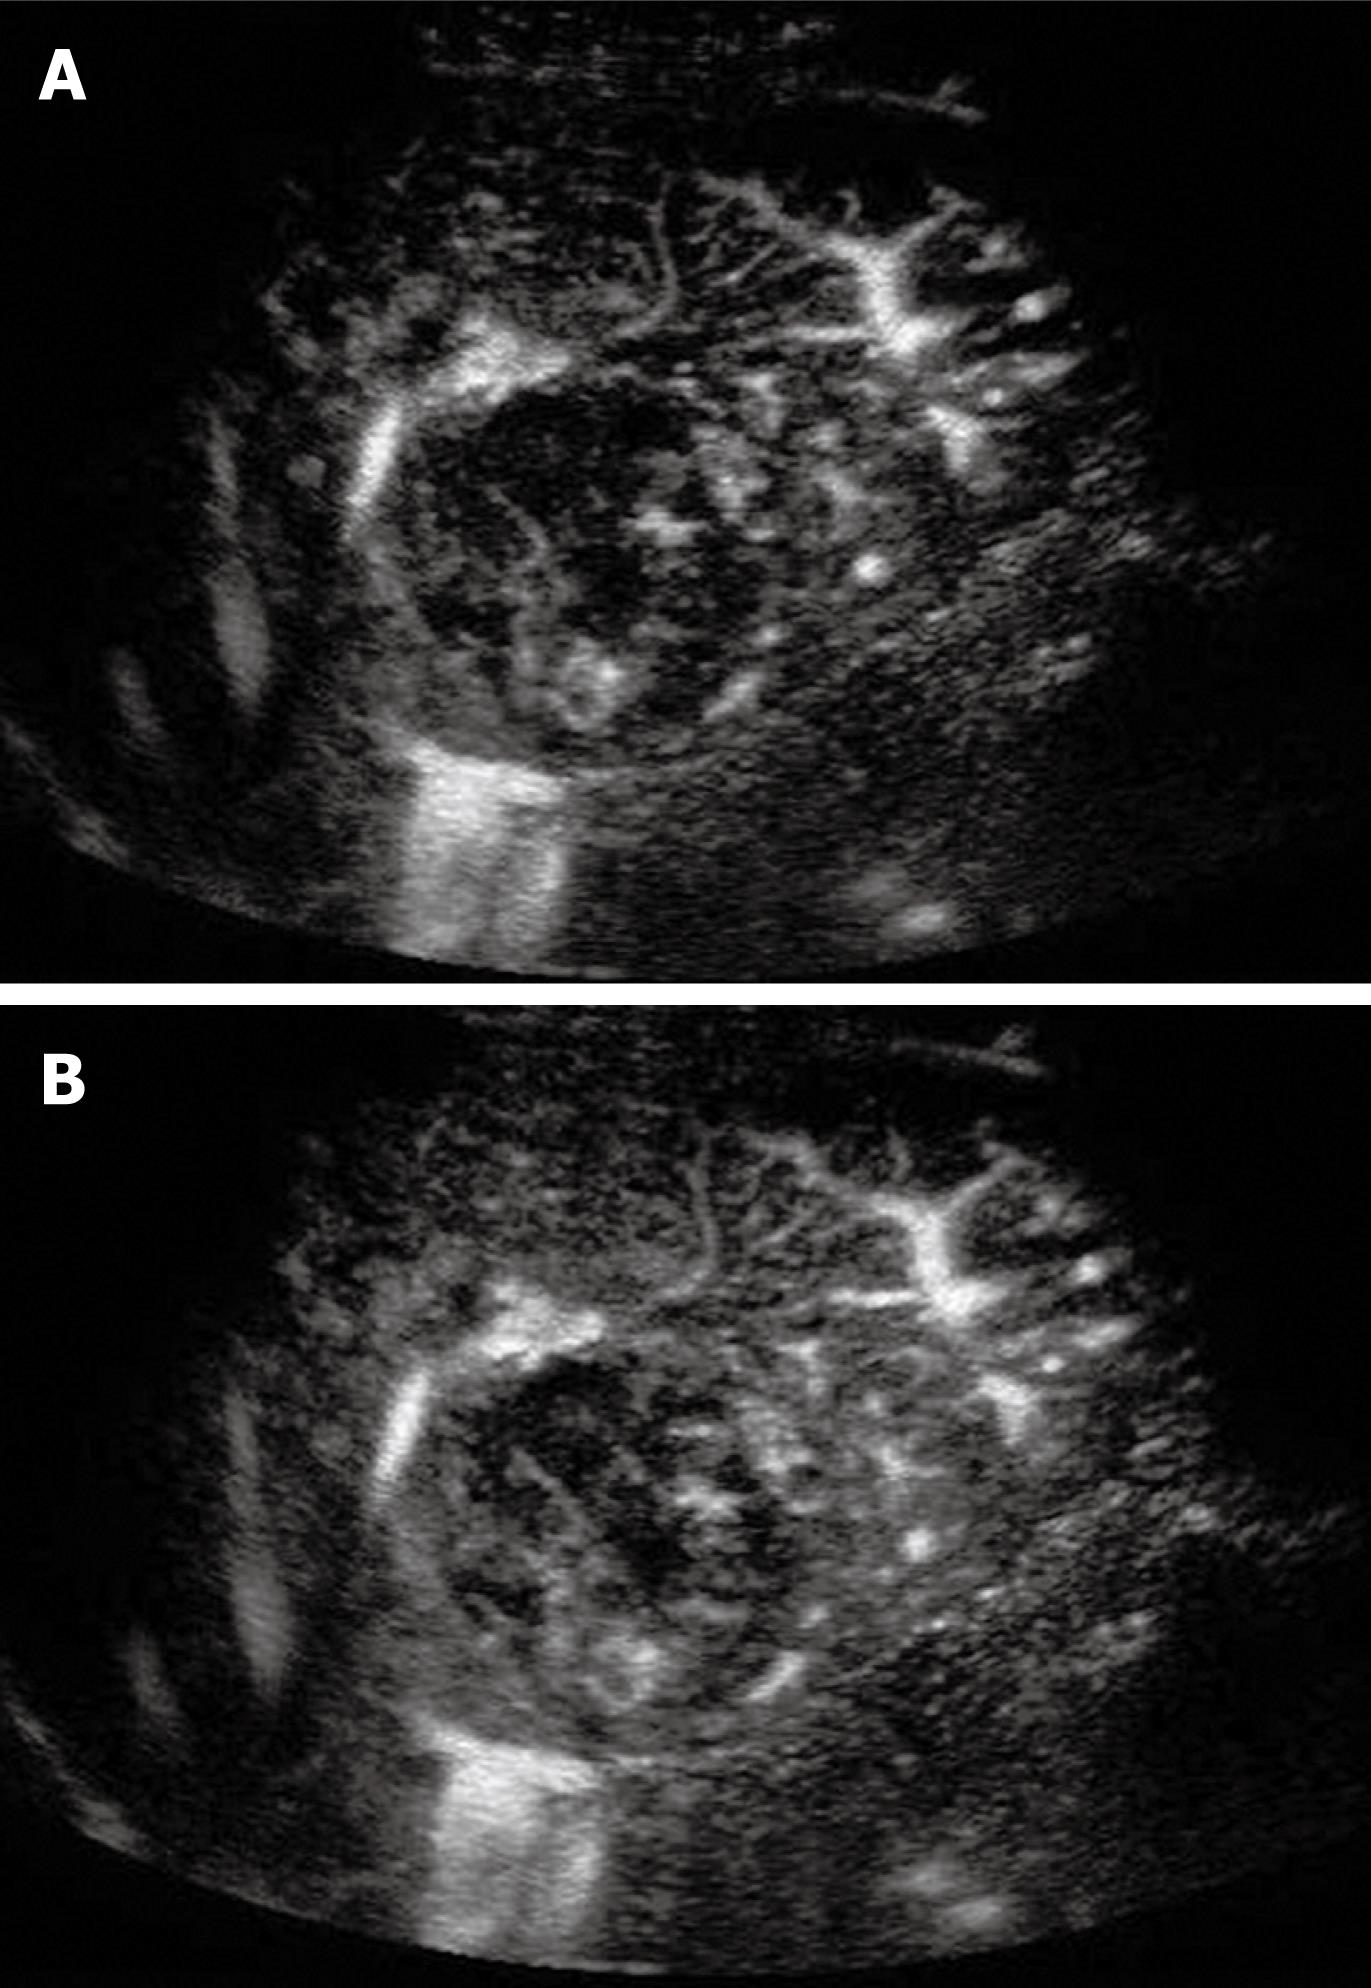
Figure 2 Micro flow imaging (MFI) technique depicts the intra-tumoral vascular architecture.
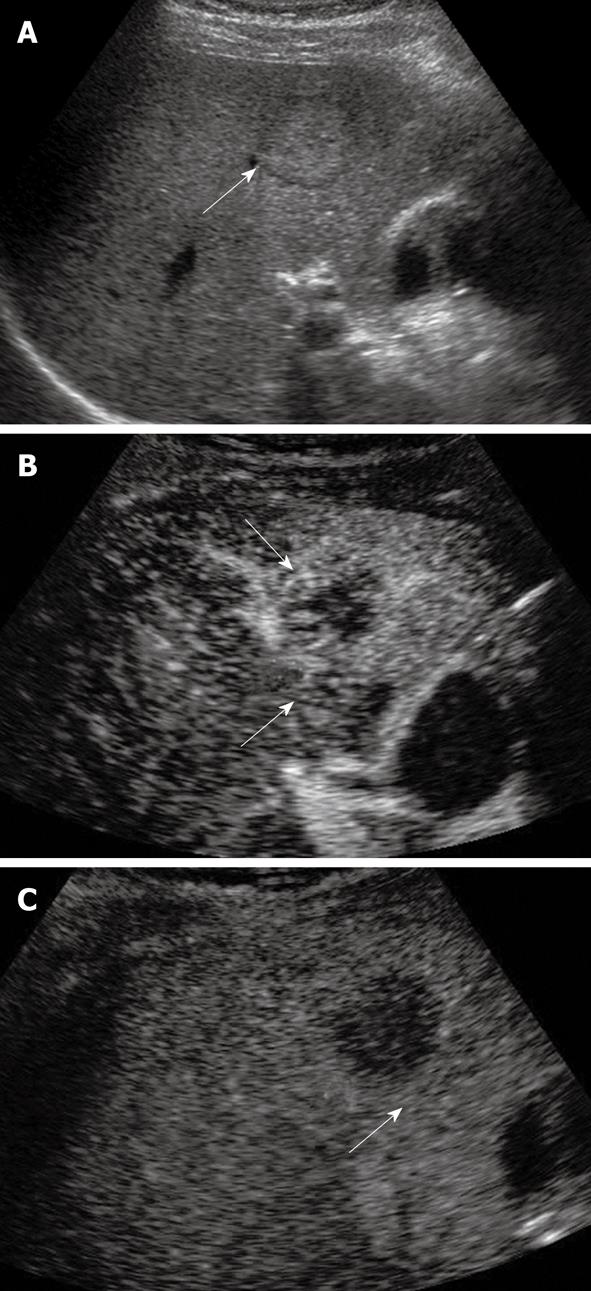
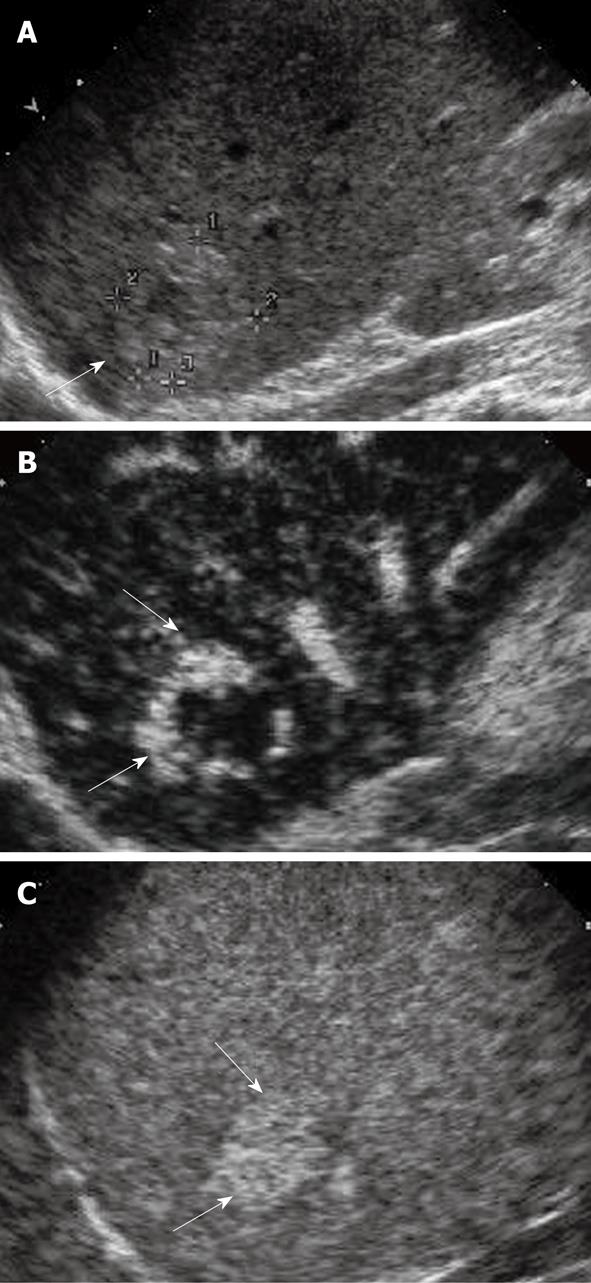
Figure 3 Liver metastasis.
A: Gray-scale sonogram shows iso-echoic nodules (arrow); B: CEUS scan obtained in arterial phase shows rim-like enhancement (arrows); C: CEUS scan at late phase shows marked hypo-enhancement (arrow).
Figure 4 Intrahepatic cholangiocarcinoma.
A: Gray-scale sonogram shows hypo-echoic nodule (arrows); B: At CEUS during the arterial phase the lesion shows markedly inhomogeneous enhancement (arrows); C: The lesion appears as hypo-enhancing mass in comparison with adjacent parenchyma in late phase (arrows).
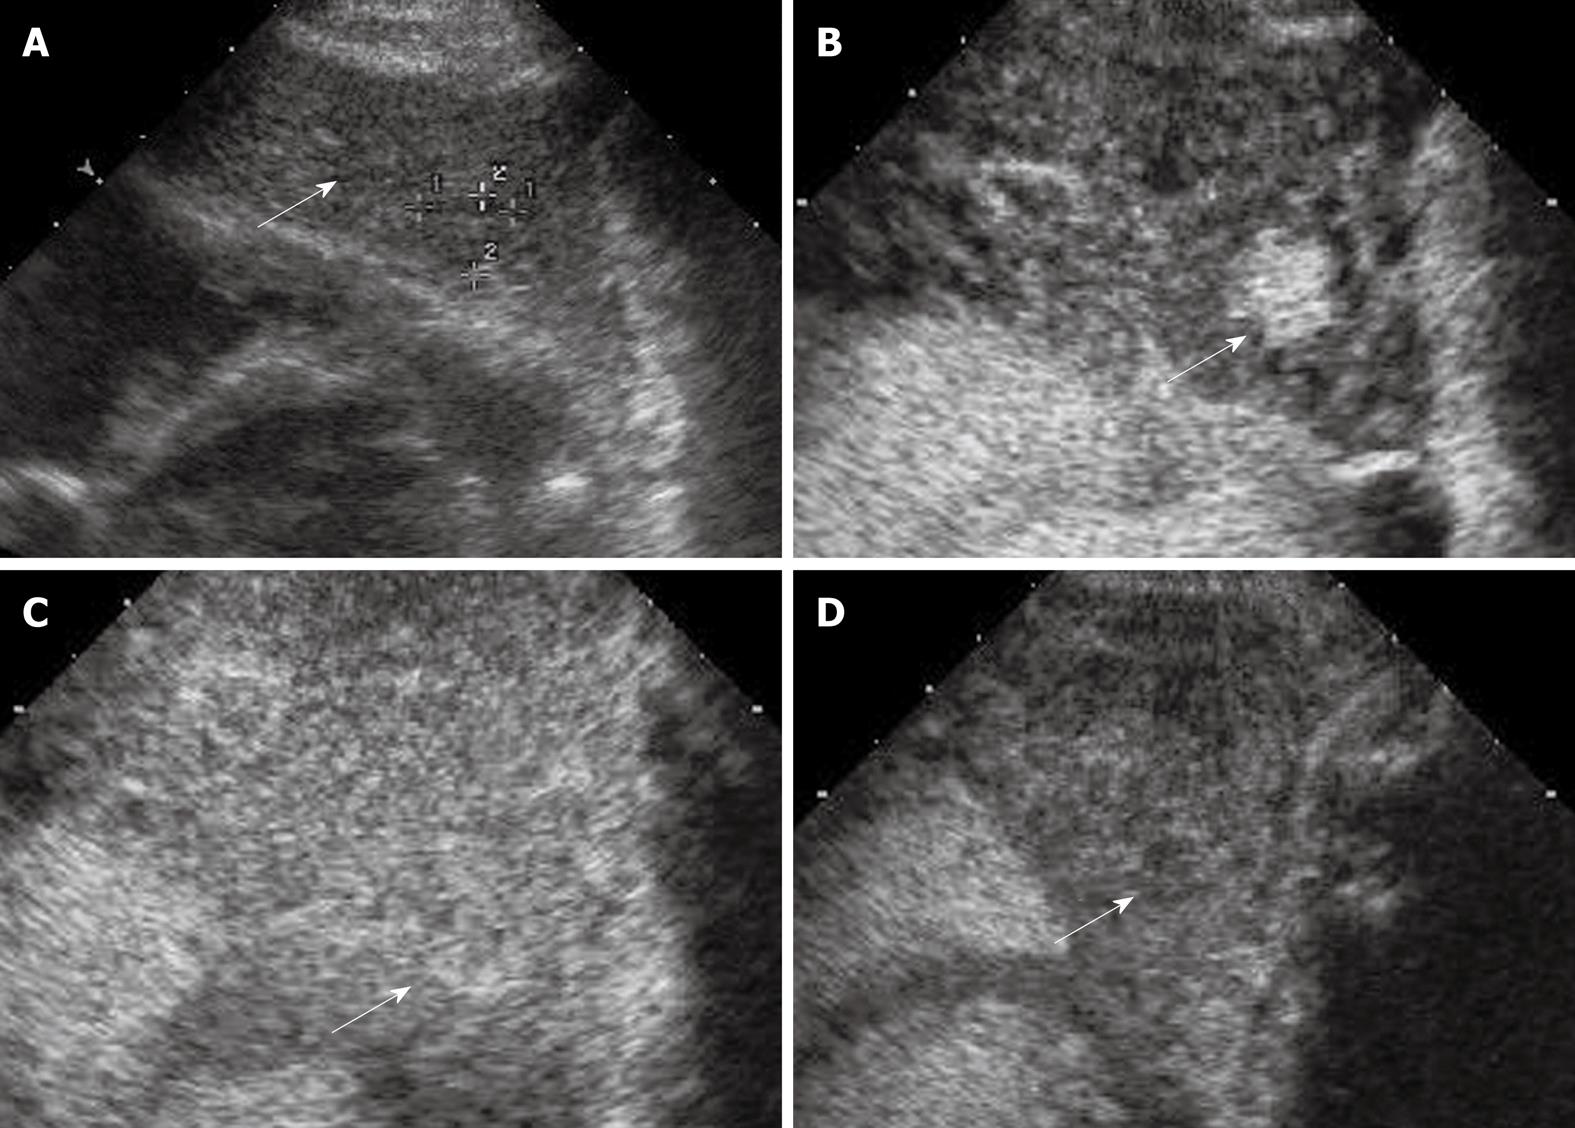
Figure 5 Biopsy-proven dysplastic nodule.
A: A well-defined hypo-echoic lesion in the presence of liver cirrhosis (arrow); B: At CEUS during the arterial phase the lesion shows hyper-enhancement (arrow); C: The lesion appears iso-enhanced with respect to surrounding liver parenchyma in the portal phase(arrow); D: The lesion appears hypo-enhanced with respect to surrounding liver parenchyma in later part of the phase (arrow).
Figure 6 Hemangioma.
A: Gray-scale sonogram shows a hyper-echoic nodule (arrow); B: CEUS scan obtained in arterial phase shows peripheral nodular hyper-enhancement (arrows); C: CEUS scan at late phase shows progressive centripetal enhancement and sustained and complete hyperenhancement (arrows).
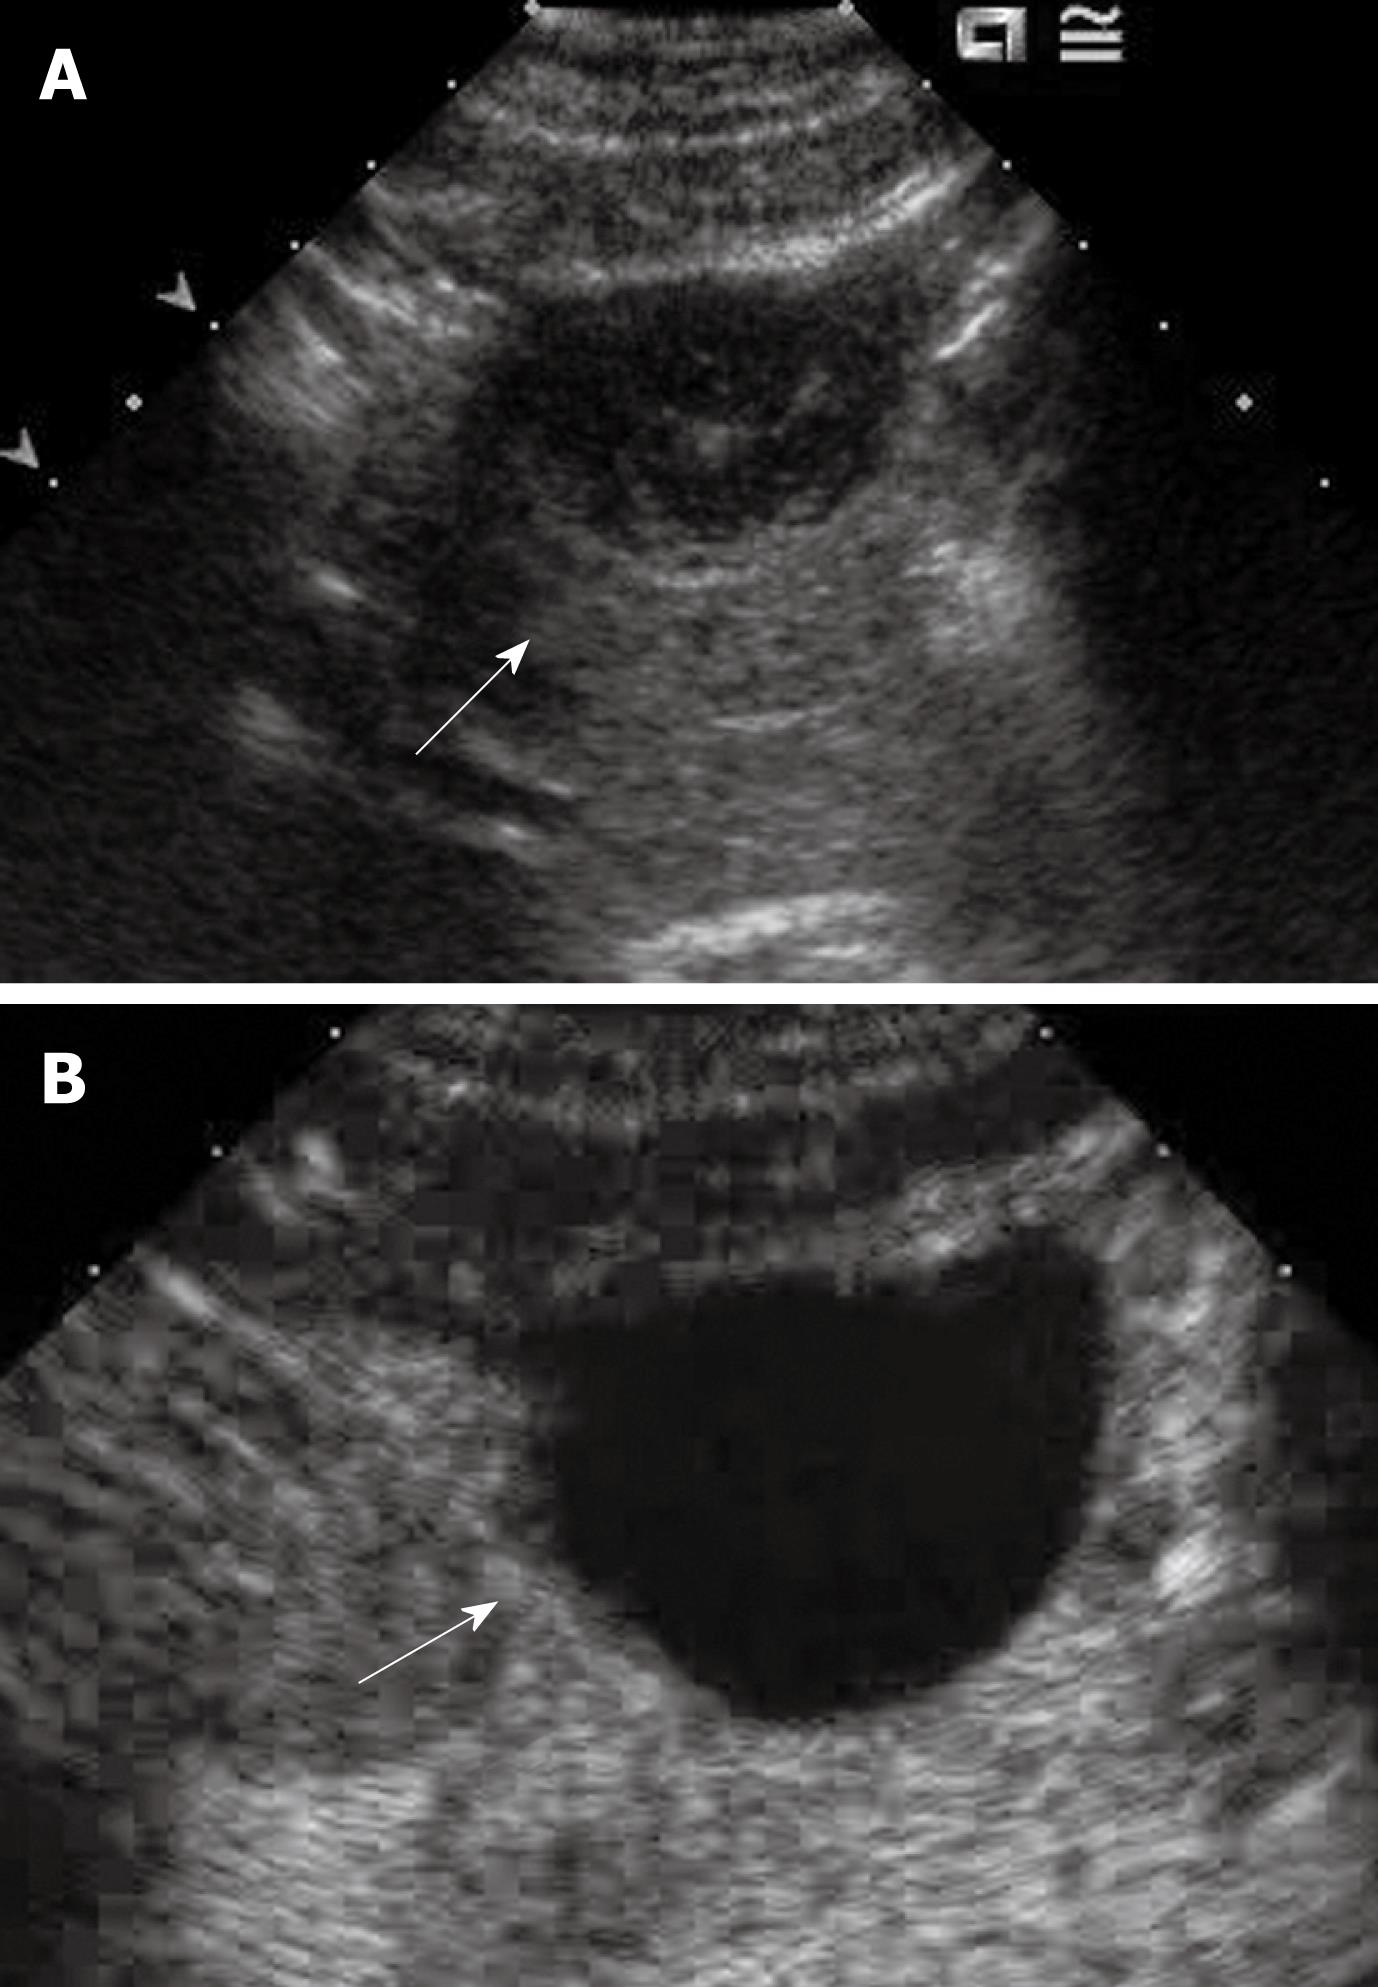
Figure 7 Complicated cyst.
A: A slightly hypo-echoic lesion (arrow); B: CEUS at the portal phase of the lesion shows lack of contrast enhancement (arrow), as well as throughout the remaining vascular phases (not shown). Some internal non-enhancing debris within the cyst is still appreciable.
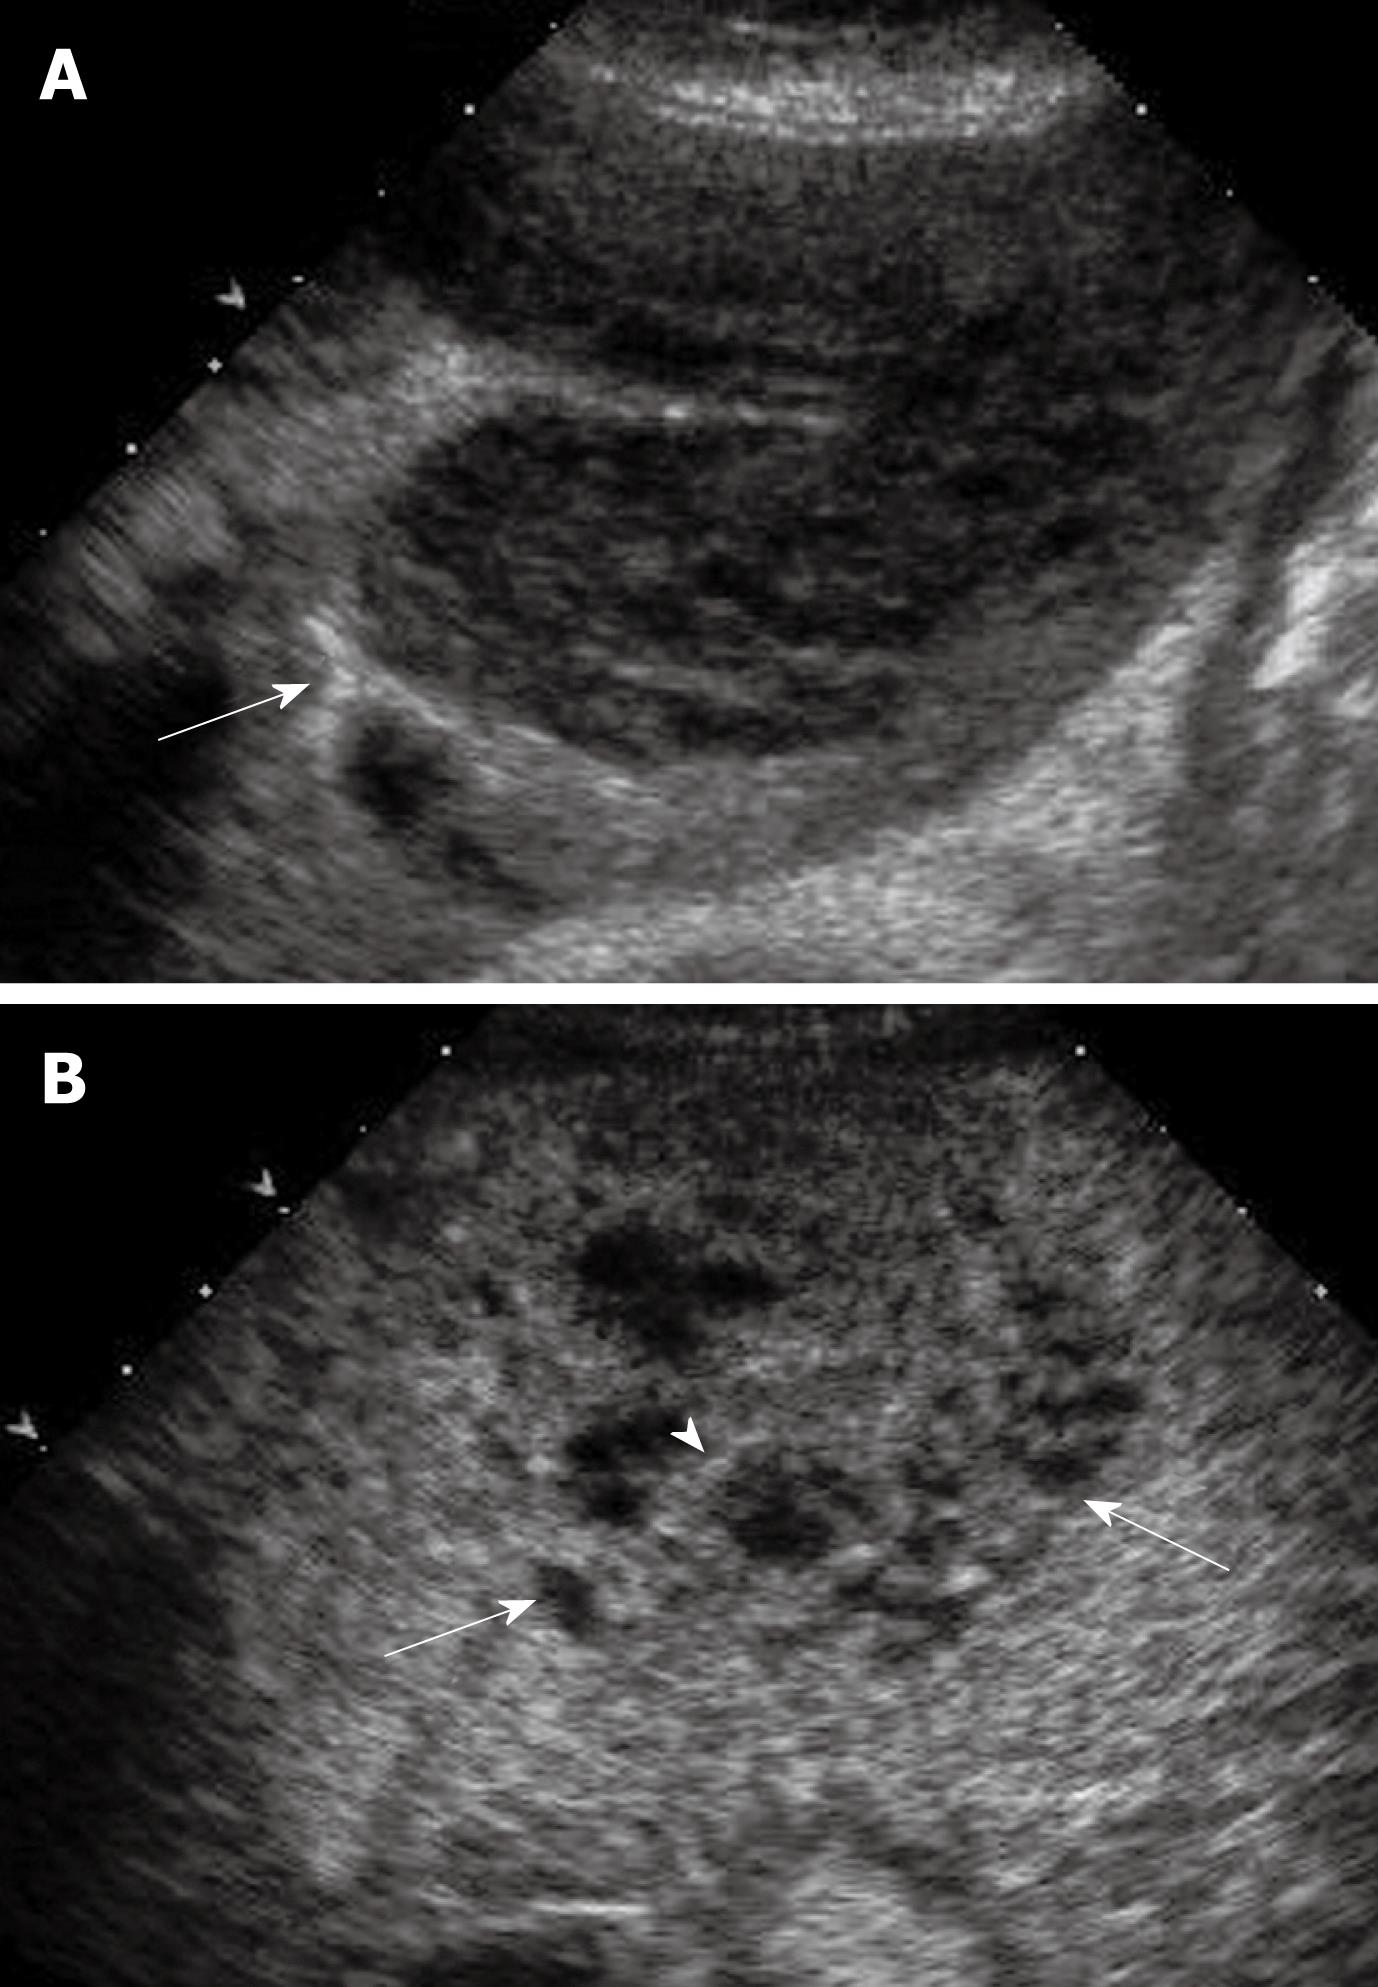
Figure 8 Hepatic abscess.
A: An ill-defined lesion with mixed echotexture (arrow); B: The image obtained at CEUS in the portal phase better depicts the real margins of the lesion (arrows). A thin enhancing septum within the lesion is also demonstrated (arrowhead).
- Citation: Wong GLH, Xu HX, Xie XY. Detection Of Focal Liver Lesions In Cirrhotic Liver Using Contrast-Enhanced Ultrasound. World J Radiol 2009; 1(1): 25-36
- URL: https://www.wjgnet.com/1949-8470/full/v1/i1/25.htm
- DOI: https://dx.doi.org/10.4329/wjr.v1.i1.25


