Copyright
©The Author(s) 2021.
World J Cardiol. Sep 26, 2021; 13(9): 416-437
Published online Sep 26, 2021. doi: 10.4330/wjc.v13.i9.416
Published online Sep 26, 2021. doi: 10.4330/wjc.v13.i9.416
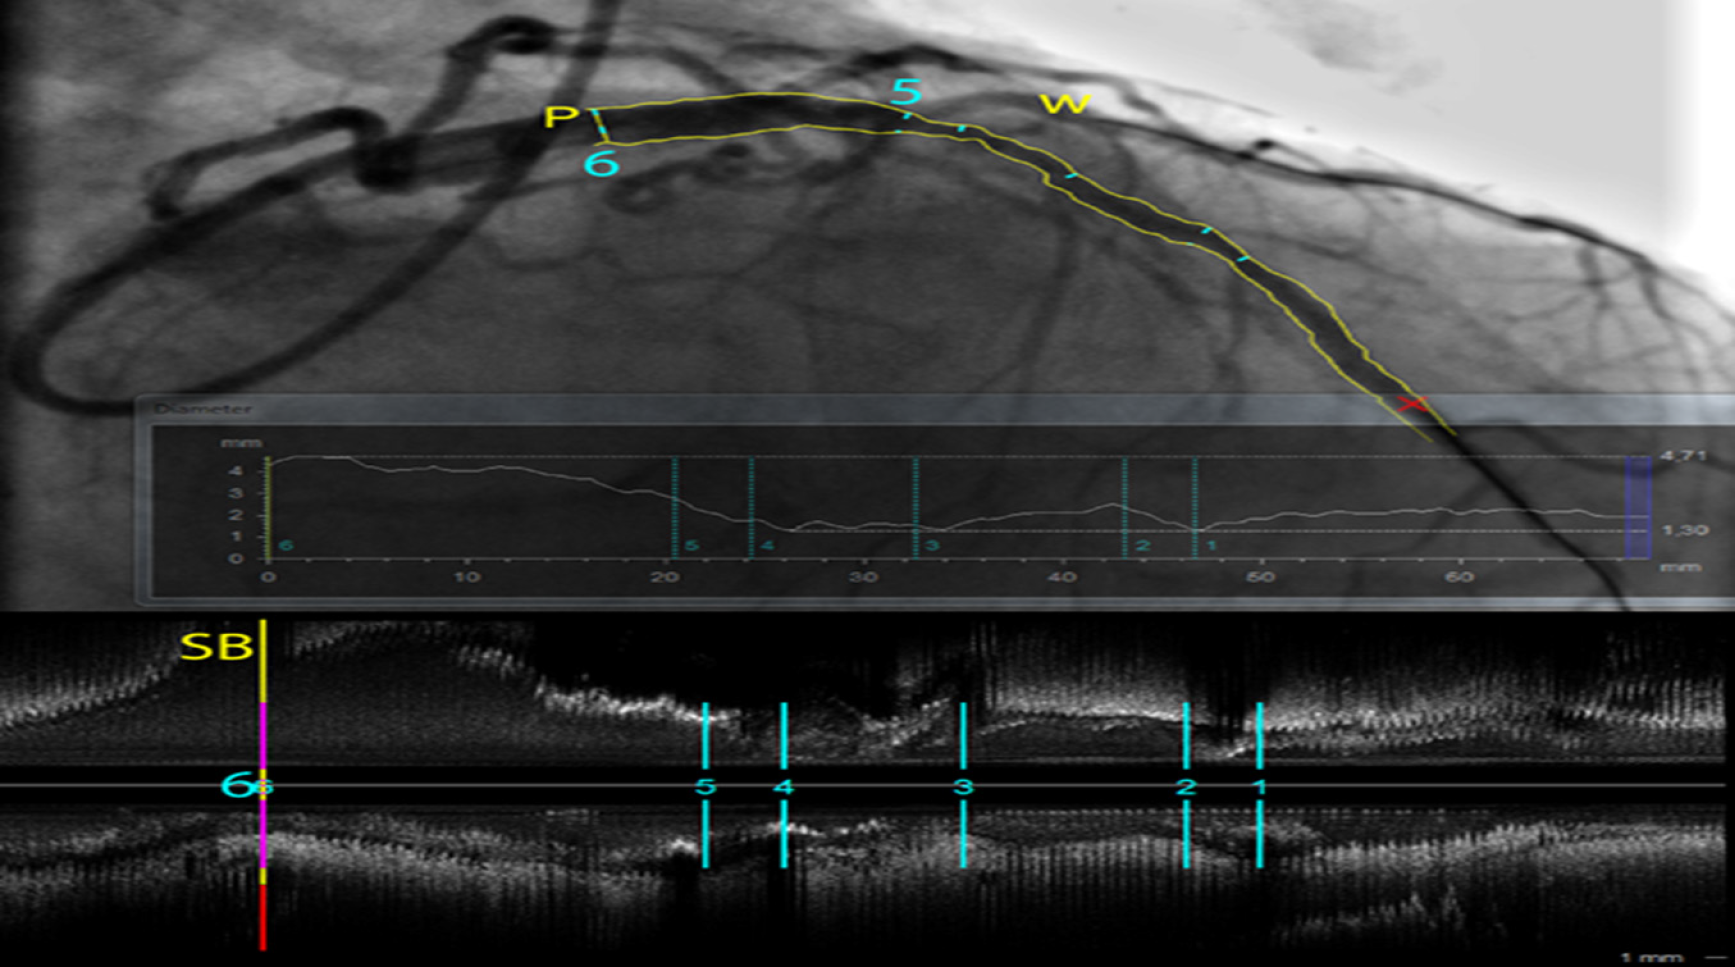
Figure 1 Quantitative coronary analysis analysis (CAAS software, Pie Medical Imaging) of a long stenosis in a left anterior descending artery.
The vessel borders are automatically detected and diameters are plotted along the vessel centerline. Different measurements (1-6) are shown on a co-registered intravascular ultrasound (IVUS) pull-back longitudinal view at the bottom. At P (6), the ostium free of disease of a large side branch (first diagonal artery) is better characterized in the 3D volume data from the IVUS pull-back than on the overlapping structures of the angiogram. (W) shows a wire in the second diagonal branch, illustrating the inherent limitations in the interpretation of a coronary angiography that is only a 2D shadow projection of a complex 3D coronary tree filled with contrast that requires multiple views in different projections.
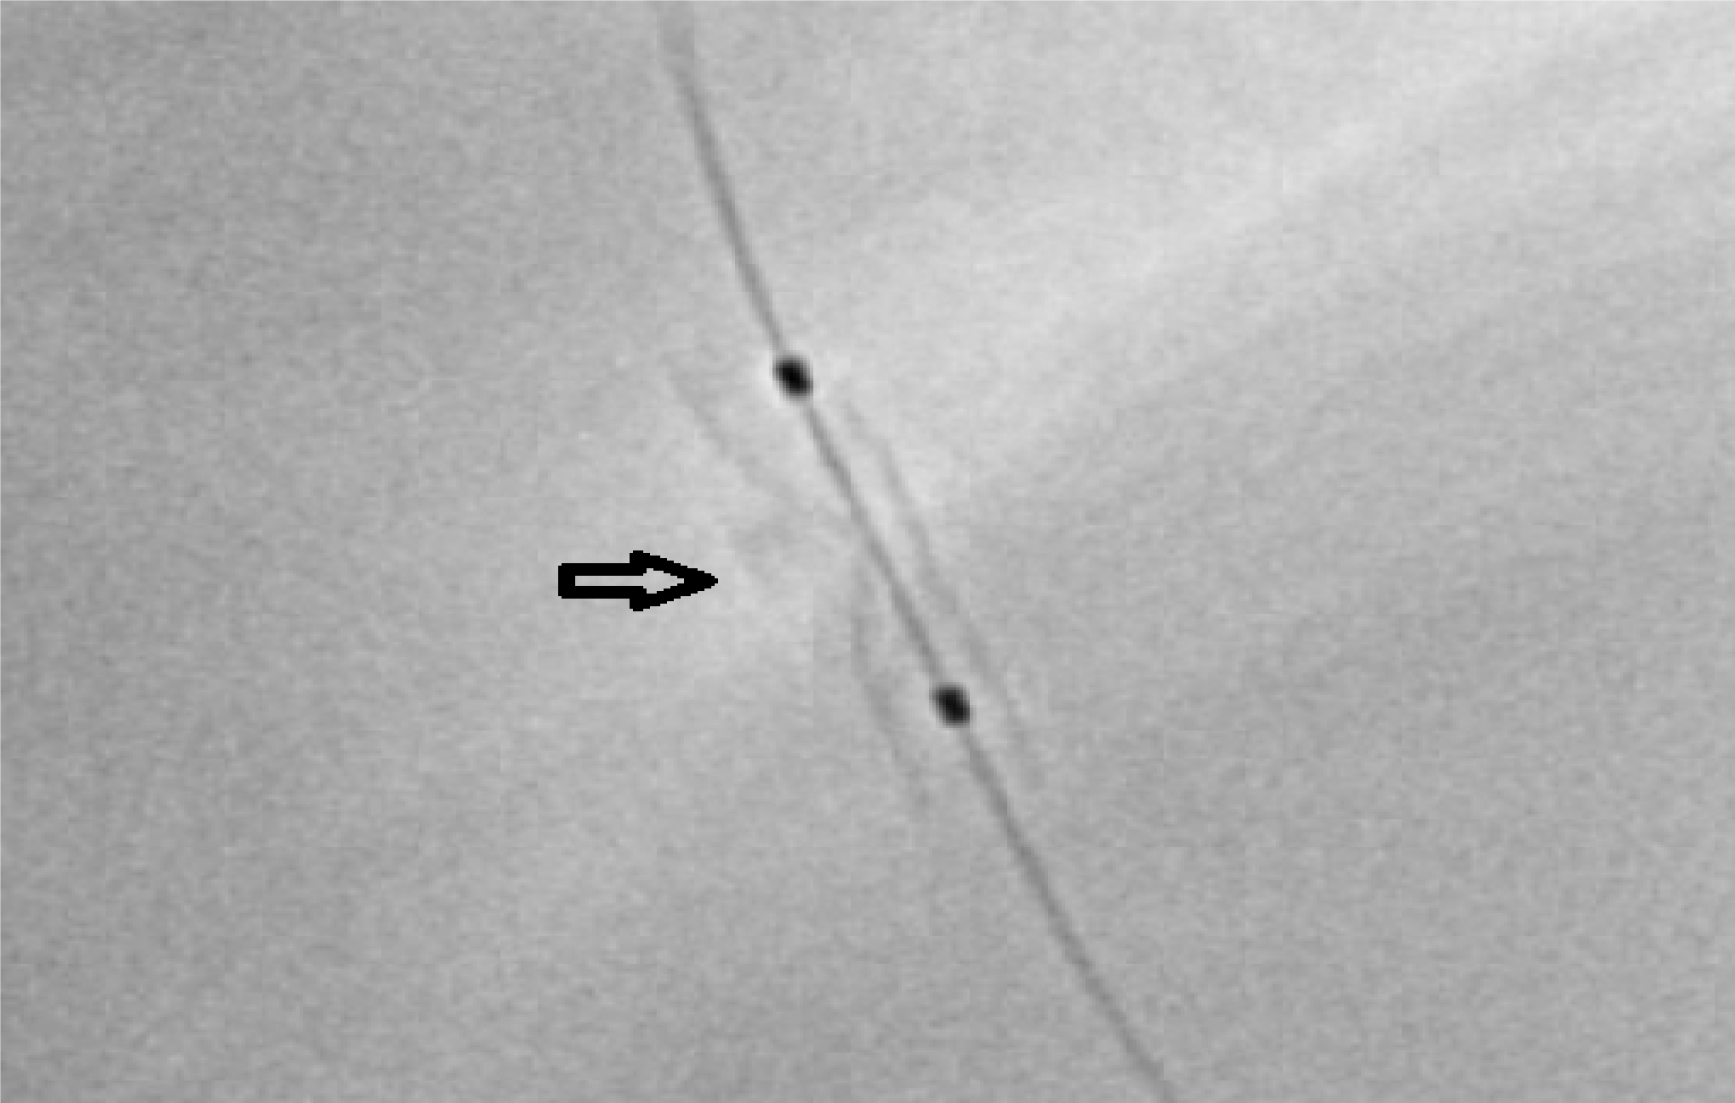
Figure 2 Digital stent enhancement image using StentBoost Subtract System (Philips Healthcare, Best, The Netherlands) showing stent underexpansion.
The two balloon markers are visible (two black dots). The calcifications responsible for the underexpansion are clearly visible (arrow).
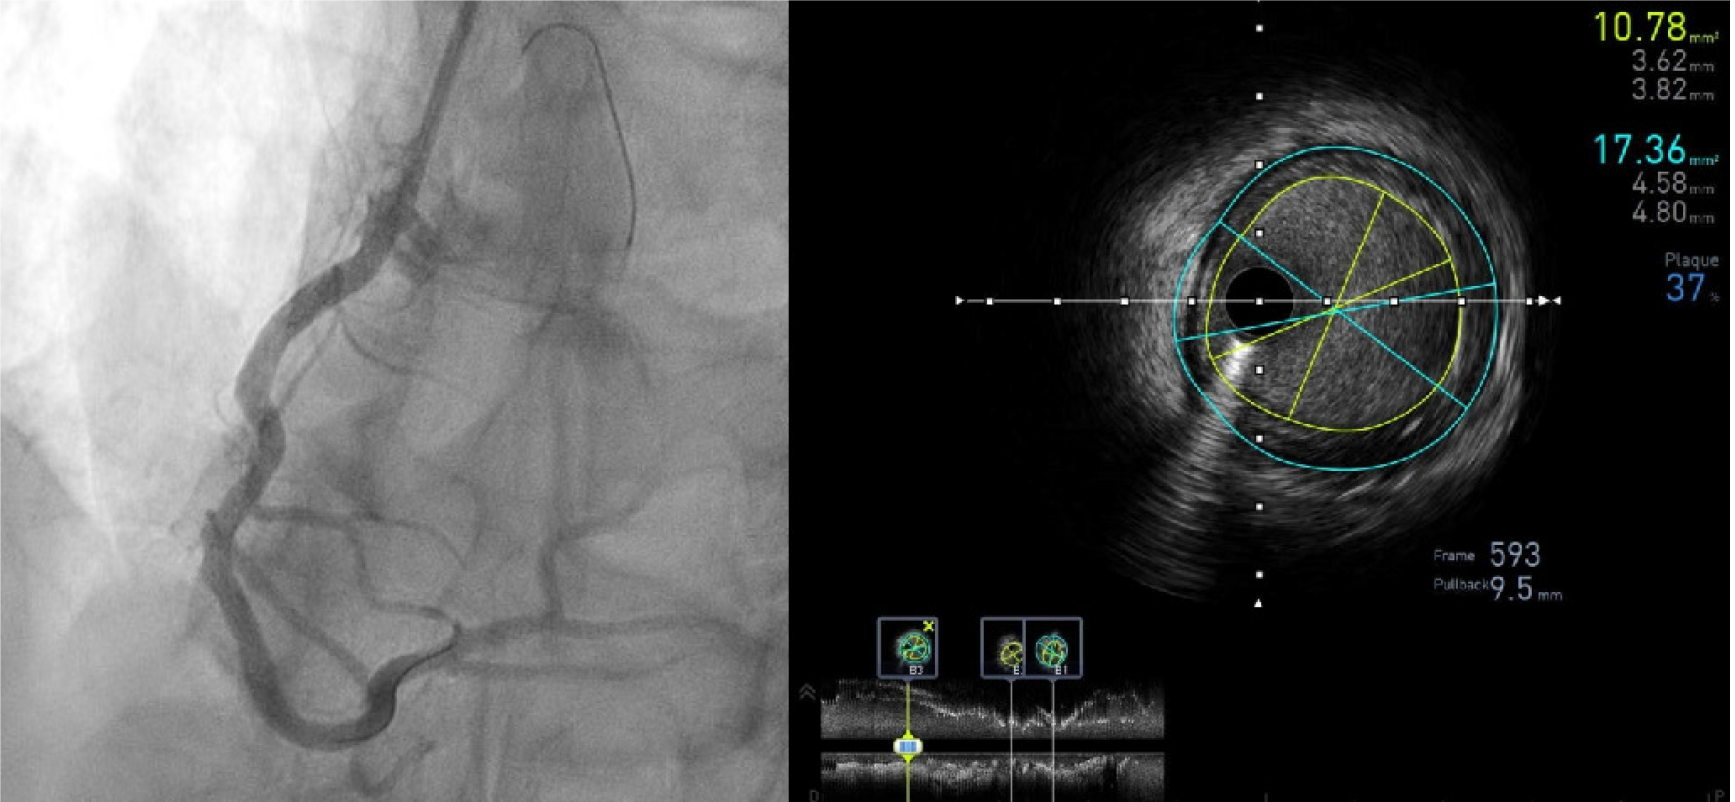
Figure 3 Intravascular ultrasound pull-back of a right coronary artery post stent implantation.
Stent expansion is assessed and the minimal lumen area measured in different cross-sections (bottom longitudinal view) while the plaque burden at the distal reference (B3) is shown on the cross sectional frame 593 (lumen area 10.78 mm², vessel area 17.36 mm², plaque burden 37%).
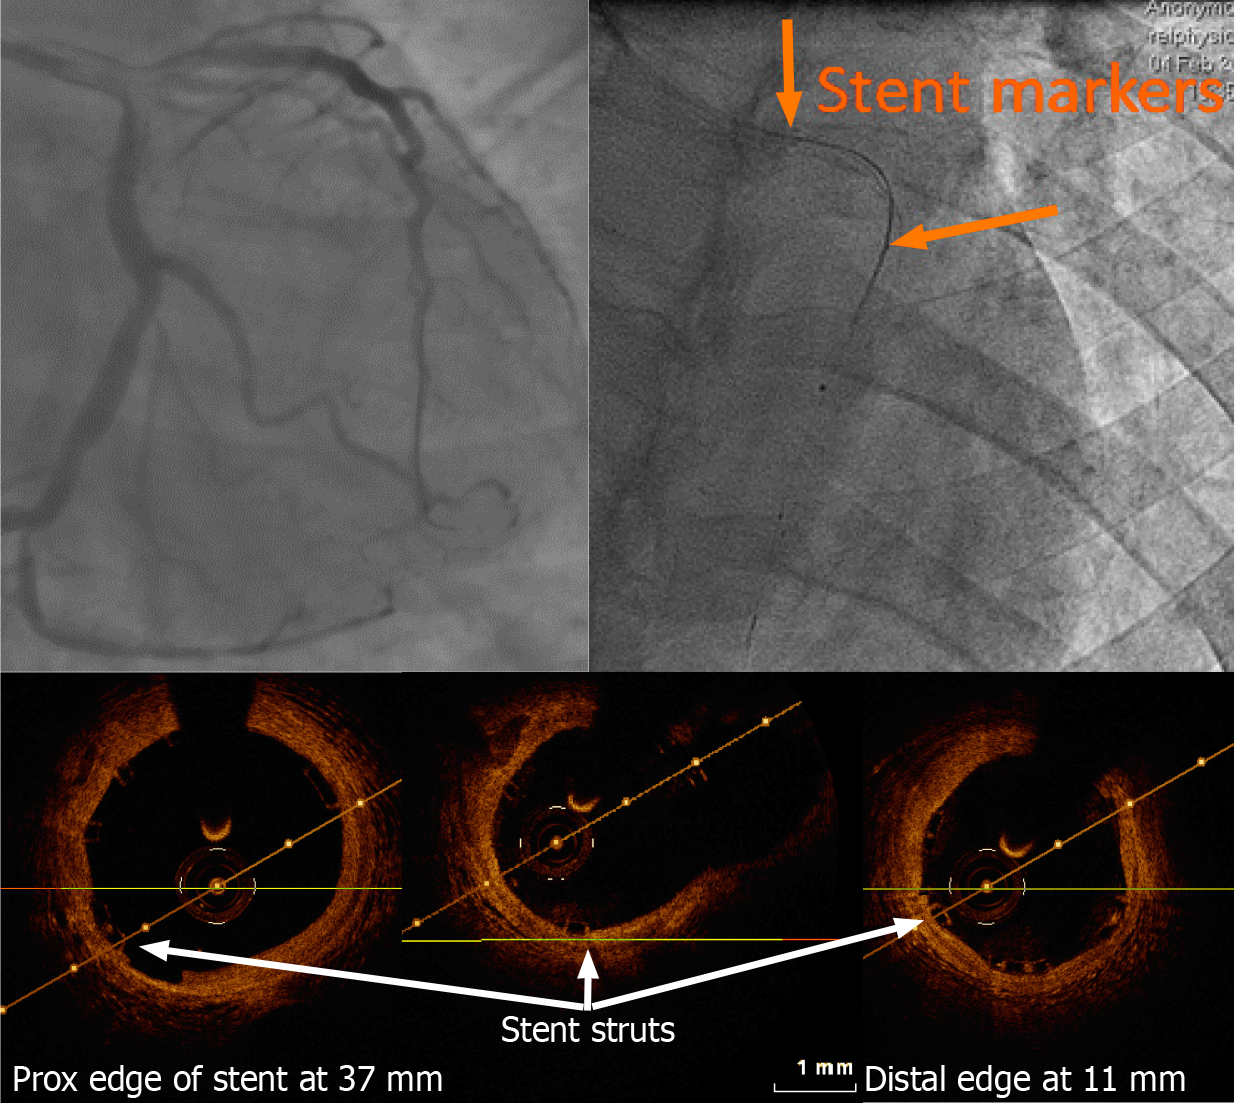
Figure 4 Left anterior descending artery optical coherence tomography pull-back post bioresorbable stent implantation carried out using a 2.
7 French imaging catheter with a dedicated workstation (C7 Dragonfly and C7-XR, Lightlab Imaging [Westford, Massachusetts, United States)]. Of note, only the proximal and distal markers are visible. On optical coherence tomography (OCT), the thickness of the stent struts and its good apposition can be assessed without artefact as seen with conventional metallic struts. Stent length could be measured on the OCT pullback with a good agreement with the known stent length.
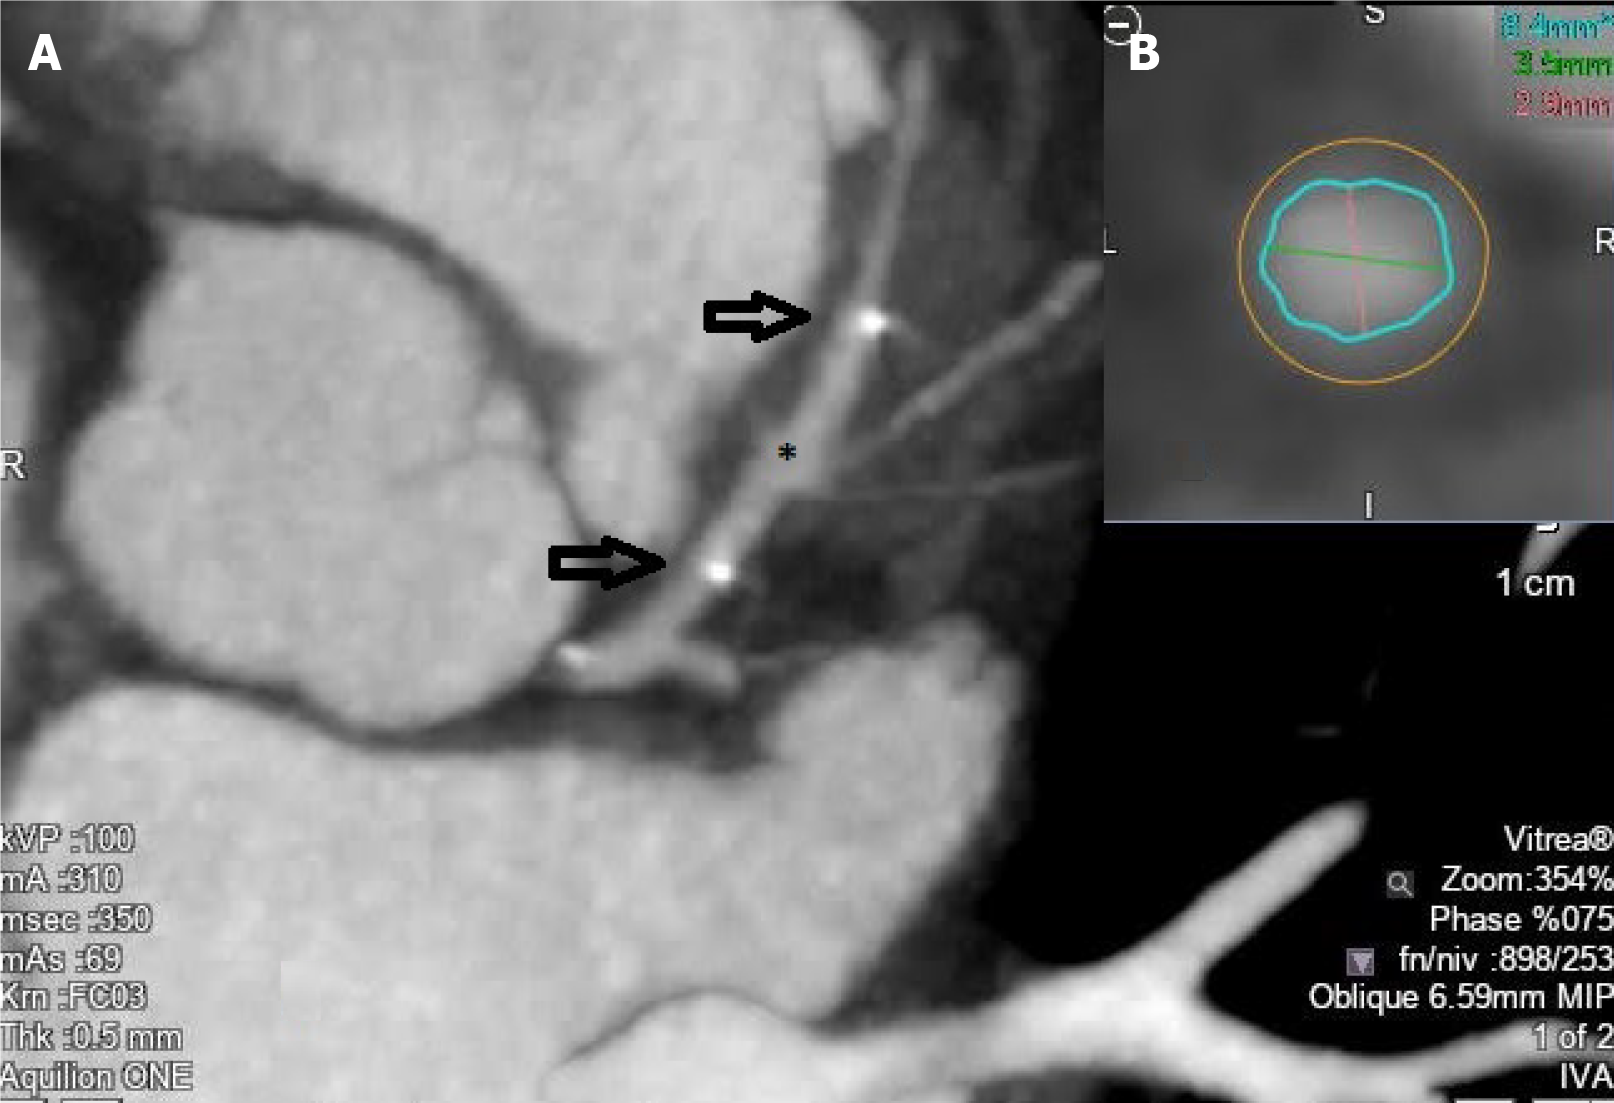
Figure 5 Coronary computed tomography angiography image of a bioresorbable stent (asterisk) implanted at the level of the proximal left anterior descending artery (A) (the two arrows represent the two radiopaque stent markers), and cross sectional cut allowing for lumen measurements (B).
- Citation: Ghafari C, Carlier S. Stent visualization methods to guide percutaneous coronary interventions and assess long-term patency. World J Cardiol 2021; 13(9): 416-437
- URL: https://www.wjgnet.com/1949-8462/full/v13/i9/416.htm
- DOI: https://dx.doi.org/10.4330/wjc.v13.i9.416


