
















Copyright: ©Author(s) 2026.
World J Biol Chem. Sep 5, 2026; 17(3): 121018
Published online Sep 5, 2026. doi: 10.4331/wjbc.121018
Published online Sep 5, 2026. doi: 10.4331/wjbc.121018
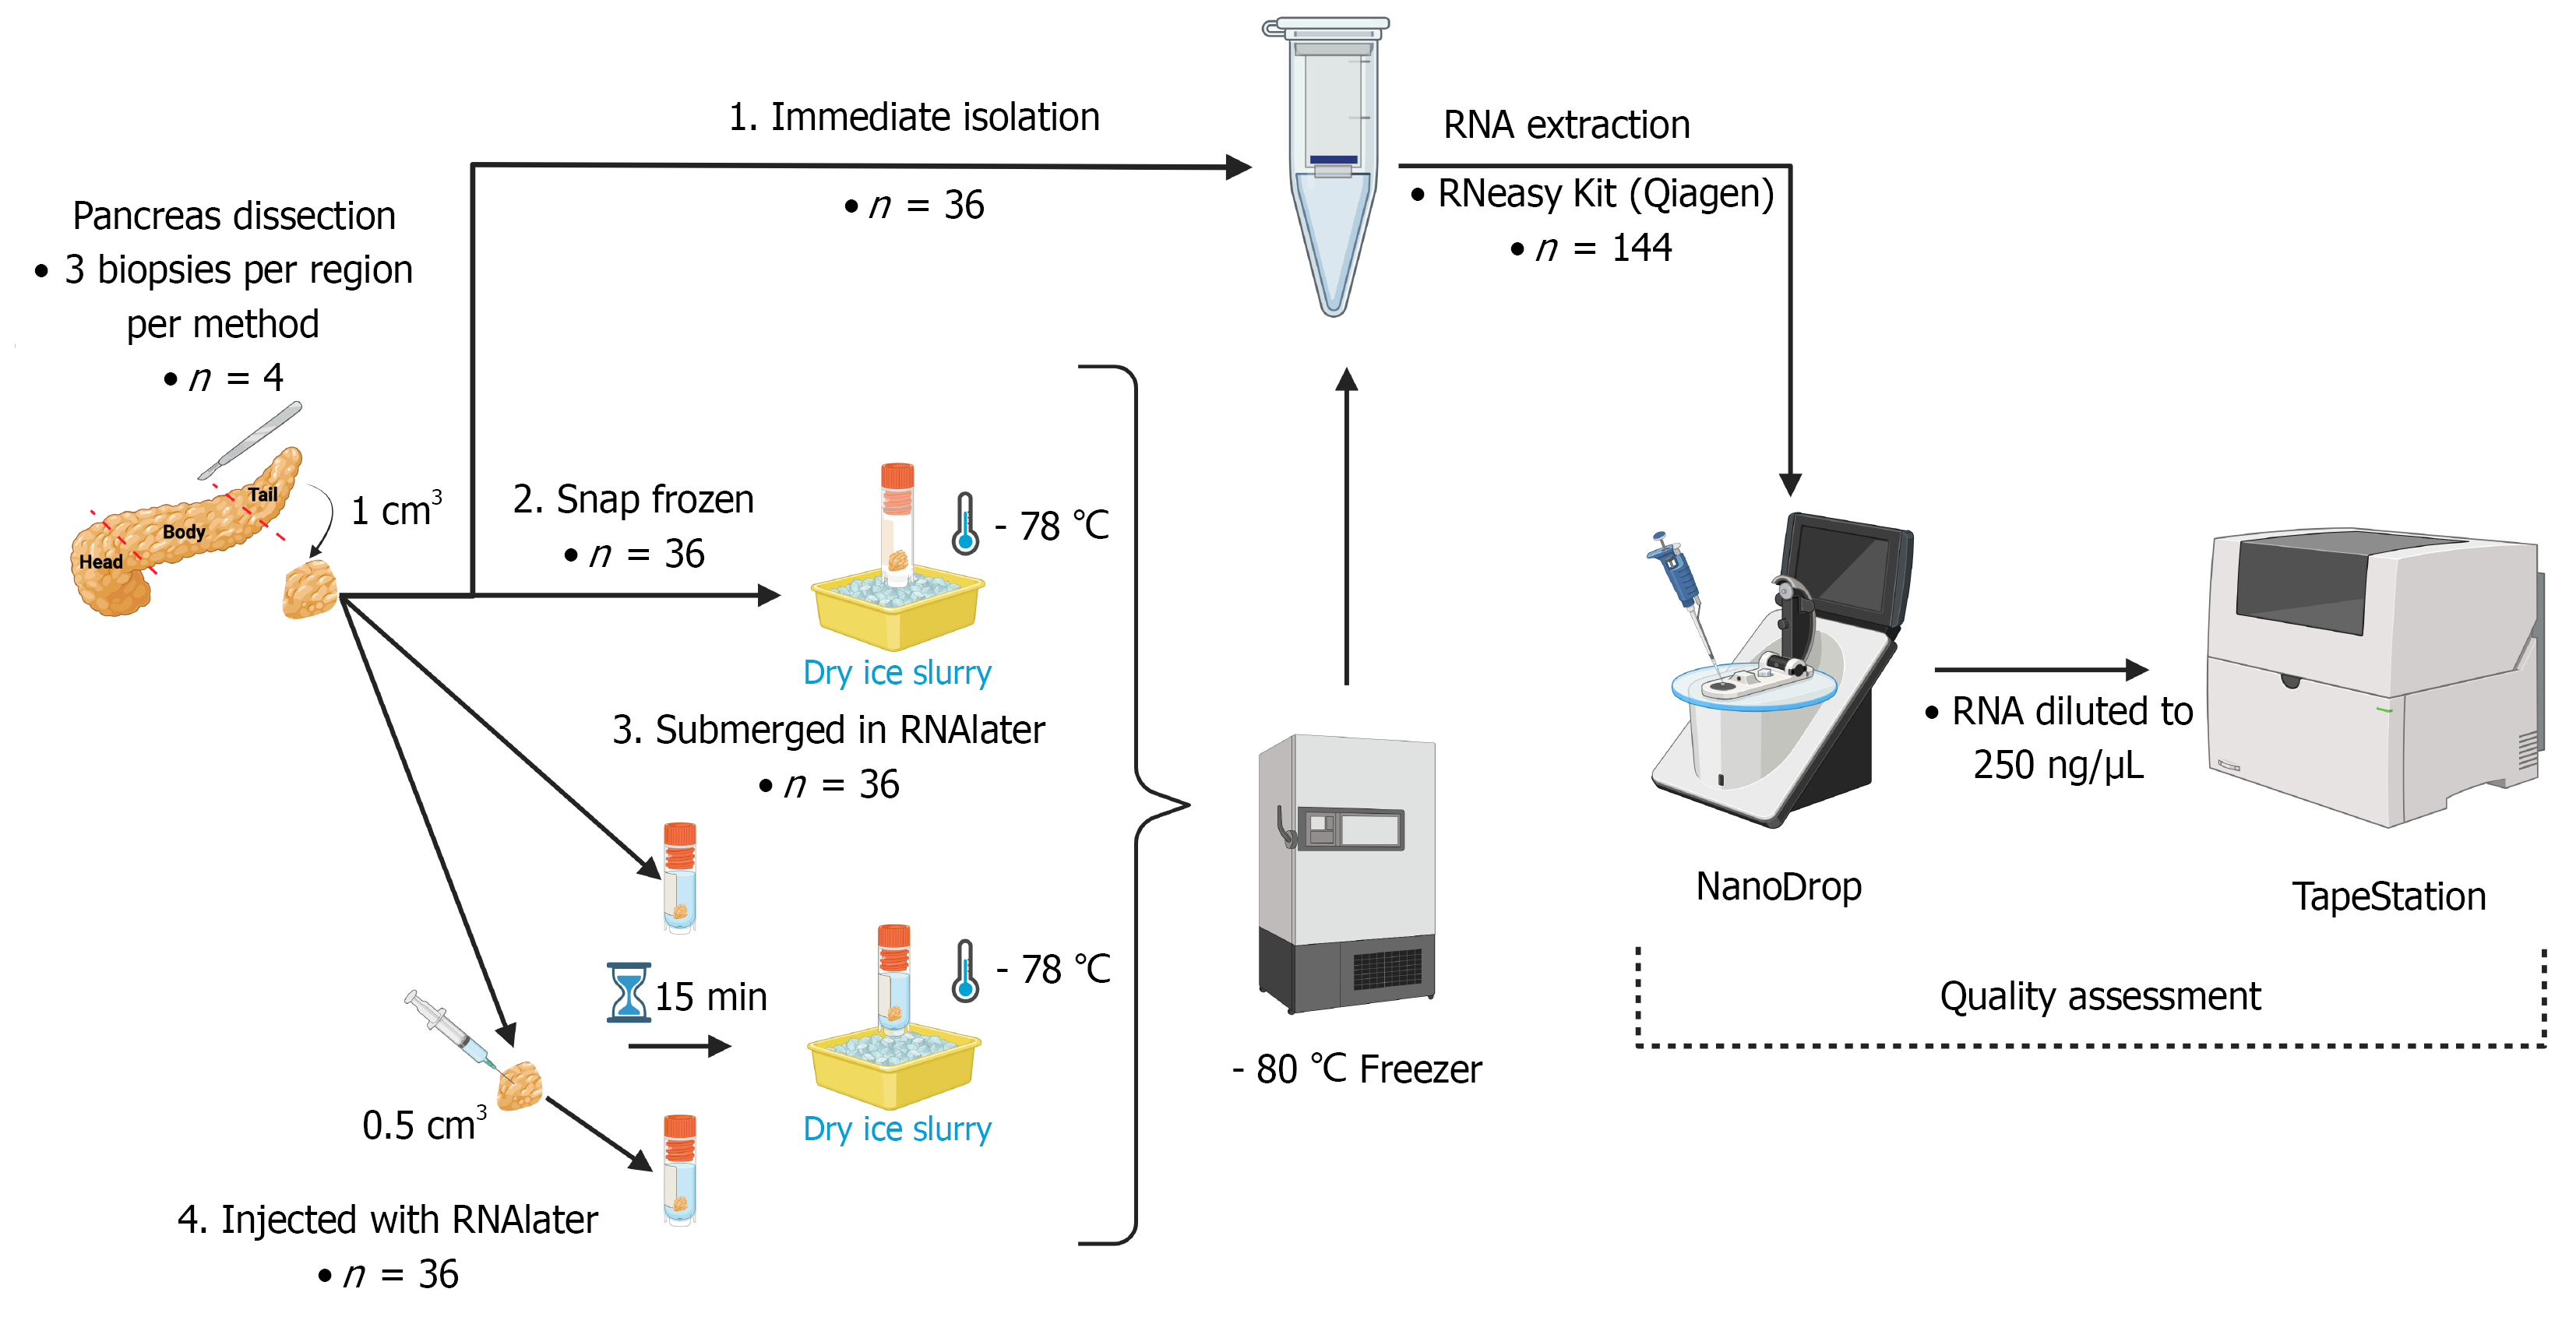
Figure 1 Schematic overview of the RNA presentation and quality assessment workflow for human pancreatic tissue biopsies.
Generated using BioRender and manually refined by the authors. Donor pancreata (n = 4) were dissected into head, body and tail regions with three biopsies per region allocated to four preservation methods: Immediate RNA isolation, snap freezing in an isopentane-dry ice slurry, submersion in RNAlater, or injection with RNAlater (144 biopsies). Both RNAlater conditions were incubated at room temperature for 15 minutes before snap freezing and storage at -80 °C. All samples underwent RNA extraction using the RNeasy Mini Kit (Qiagen) with bead-based homogenisation. RNA concentration and purity were assessed by NanoDrop and integrity by Agilent 4200 TapeStation following dilution to 250 ng/μL.
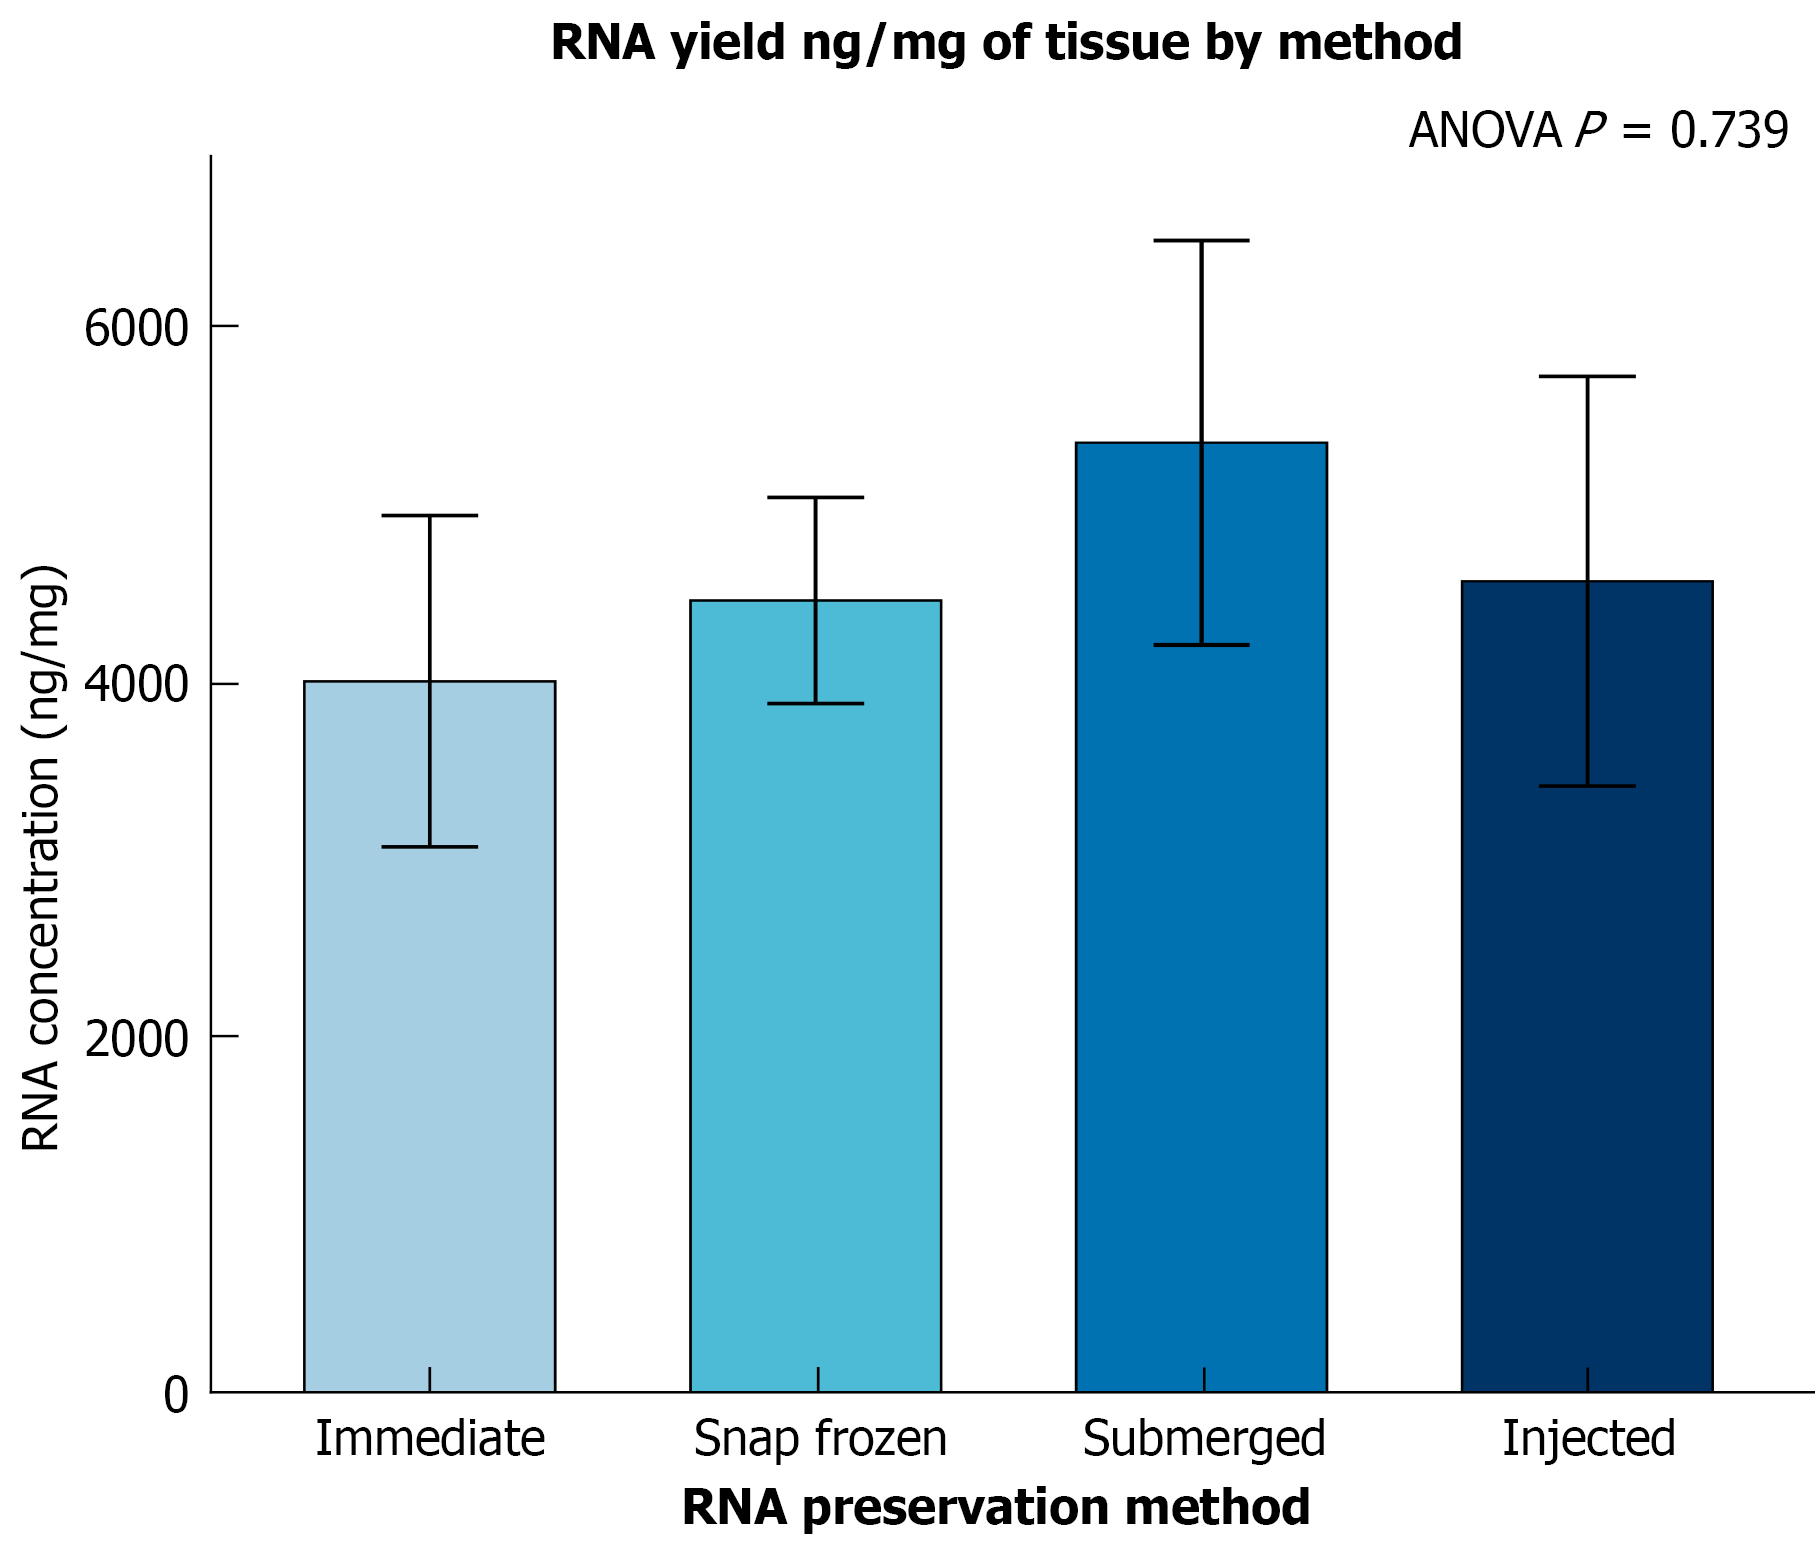
Figure 2 Effect of tissue preservation method on RNA yield from human pancreatic tissue.
Bar chart showing mean ± SD RNA concentration (ng/mg tissue) per region per donor (n = 4) of extracted from human pancreatic tissue preserved by four methods: Immediate processing, Snap freezing, Submerged and Injected with RNAlater. One-way analysis of variance applied to test significance. ANOVA: Analysis of variance.
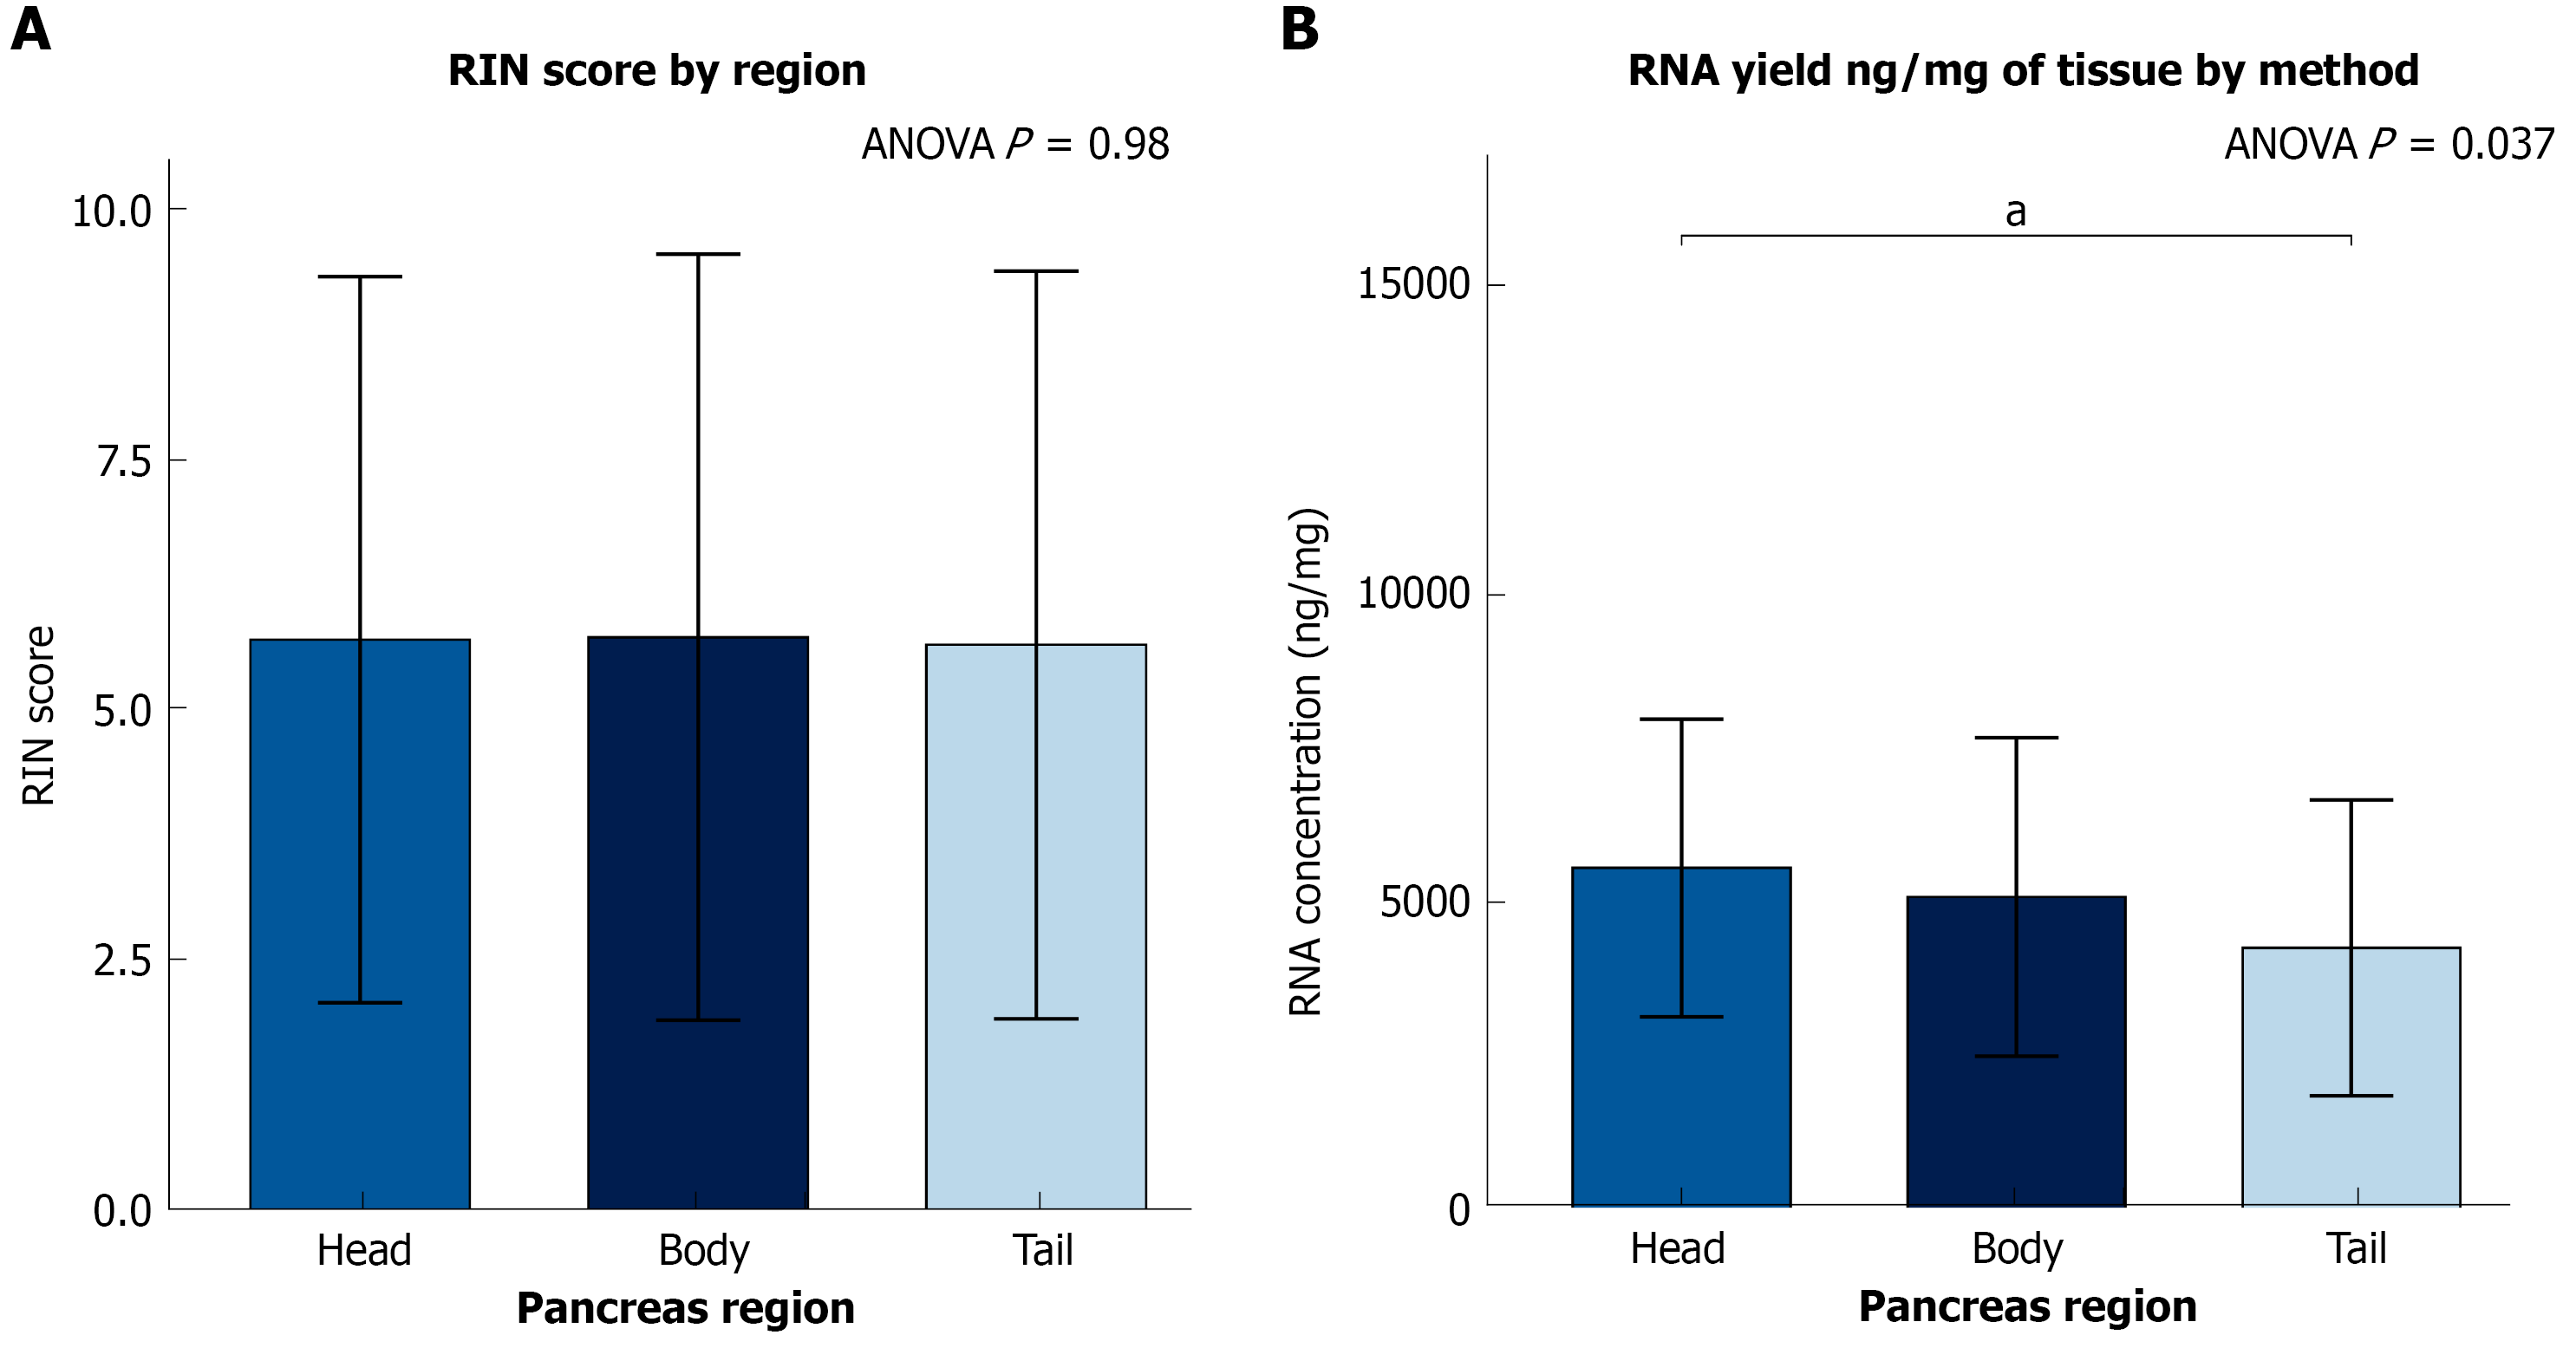
Figure 3 Regional variation in RNA yield and integrity across the human pancreas.
aAdjusted P value < 0.05. Bar plots showing the mean ± SD of the yield (ng/mg tissue) and integrity (RNA integrity number score) of RNA extracted from the head, body and trail regions from across all donors (n = 4) and preservation methods. One-way analysis of variance with Tukey’s post-hoc used to assess statistical significance. A: RNA integrity number across the pancreatic head, body and tail regions; B: RNA yield (ng/mg) across pancreatic head, body and tail regions.
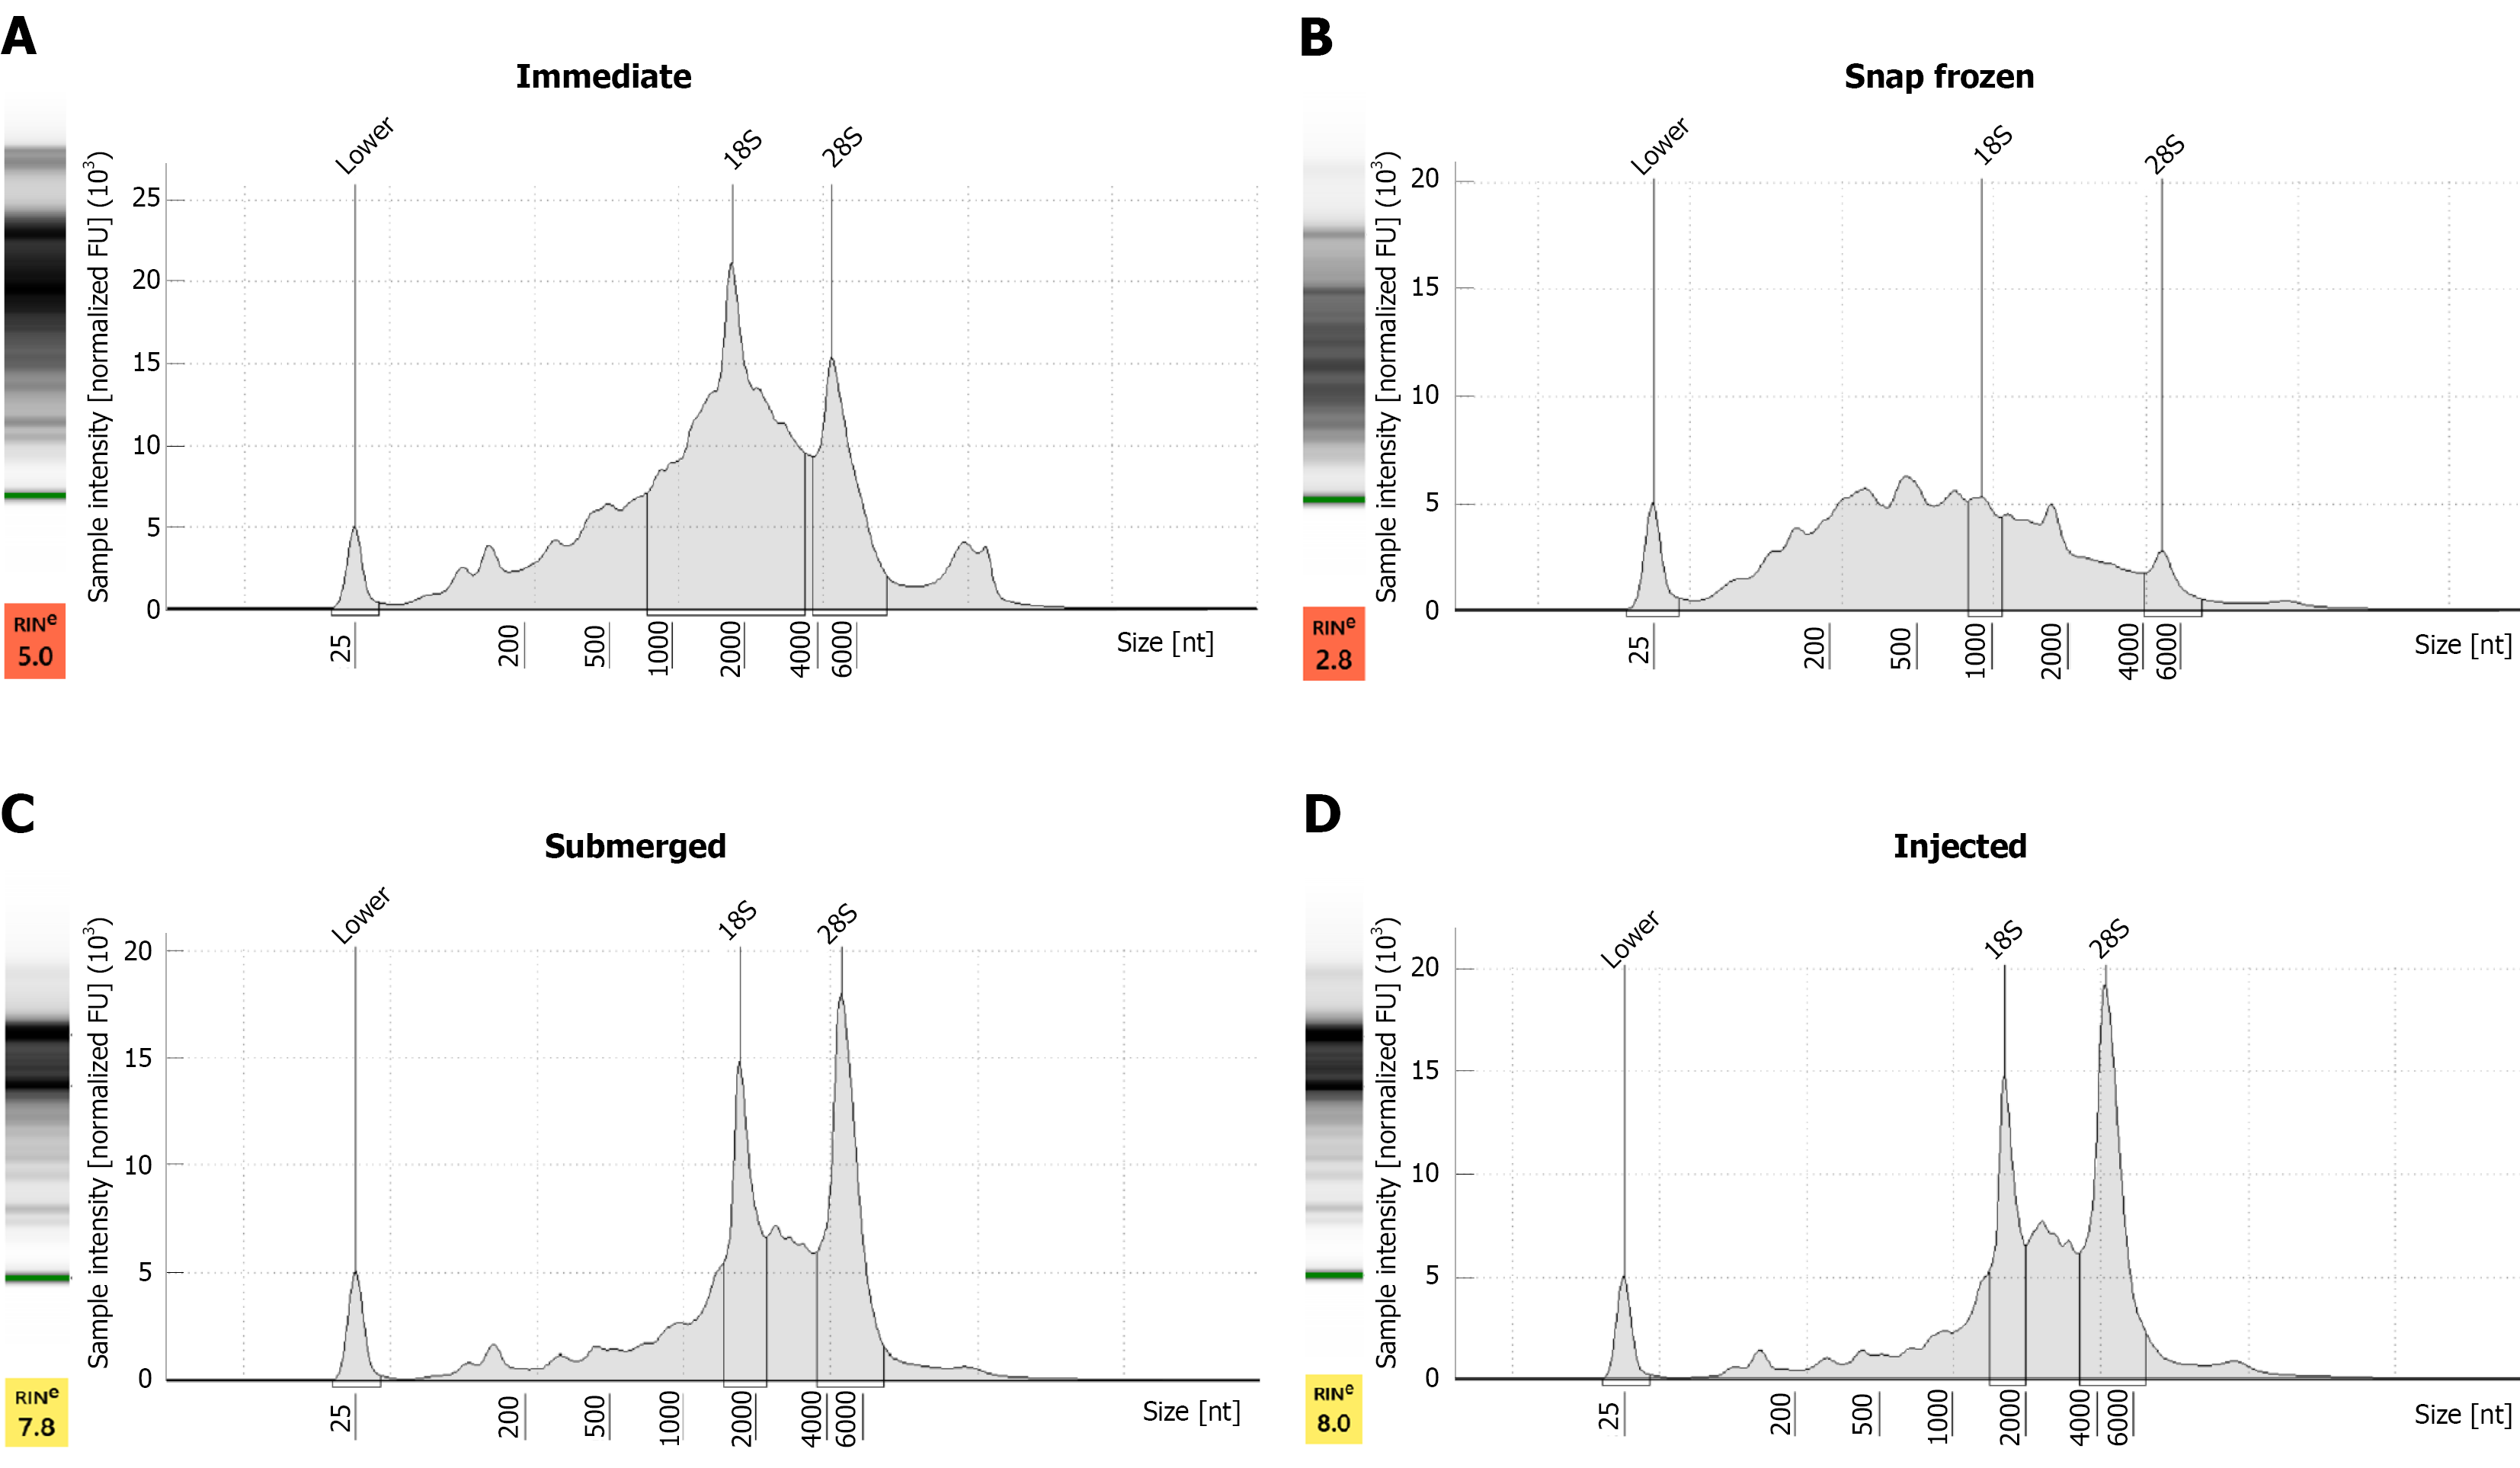
Figure 4 RNA integrity profiles of human pancreatic tissue across four preservation methods.
The X-axis shows RNA fragment size (nucleotides) and the Y-axis shows normalised fluorescence intensity. Vertical markers left to right denote the lower internal size standard and the 18S and 28S ribosomal RNA subunit peaks. RNA integrity number (RIN) scale: 1 = fully degraded, 10 = fully intact. Representative electropherograms and traces displaying RNA integrity profiles of preserved human pancreatic tissue. A: Immediate processing (RIN = 5.0); B: Snap freezing (RIN = 2.8); C: Submersion in RNAlater (RIN = 7.8); D: RNAlater injection (RIN = 8.0). RINe: RNA integrity numbere; nt: Nucleotides.
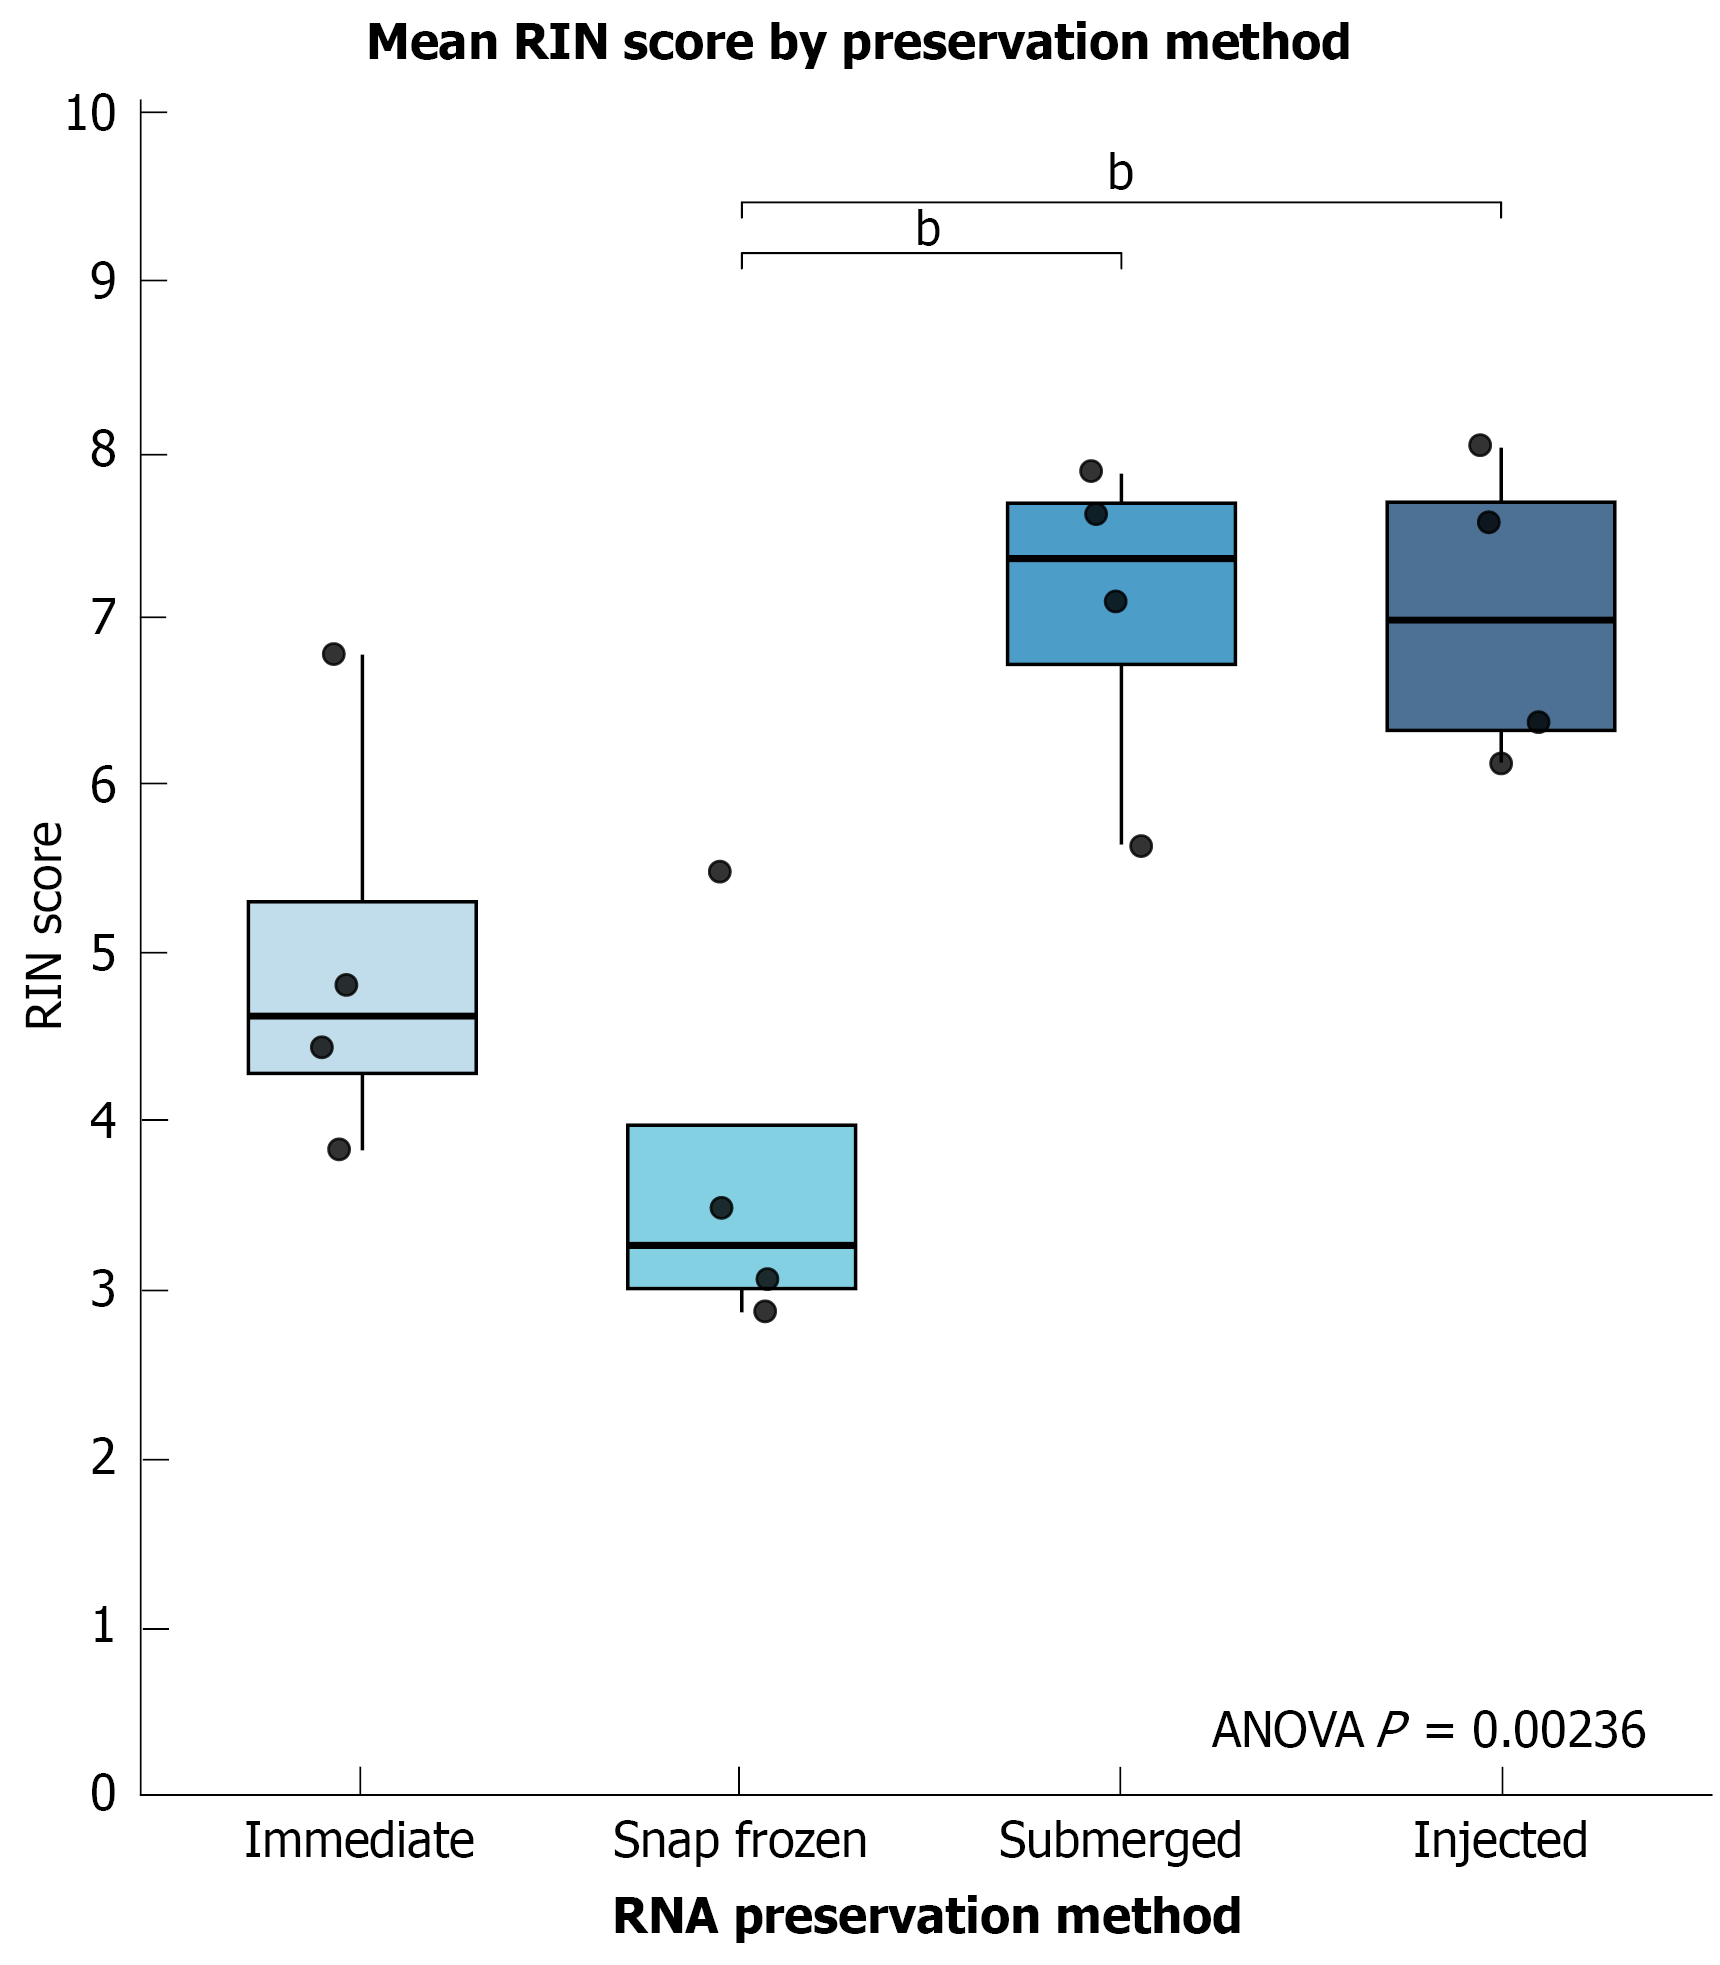
Figure 5 RNA integrity number of human pancreatic tissue across tissue preservation methodologies.
bAdjusted P value < 0.01. Box plot showing the mean distribution of RNA integrity number scores from human pancreatic tissue (n = 4 biologically independent donors) preserved by four methods: Immediate processing, Snap freezing, Submerged storage in RNAlater, and RNAlater injection. One-way analysis of variance and Tukey’s post hoc used to assess statistical significance. RIN: RNA integrity number.
- Citation: Pook RR, Hearne A, Botting RA, Tingle SJ, Honkanen-Scott M, Shaw JAM, Ali S, Scott III WE. Improved stabilisation of human pancreas biopsies: Comparative evaluation of RNA preservation methods. World J Biol Chem 2026; 17(3): 121018
- URL: https://www.wjgnet.com/1949-8454/full/v17/i3/121018.htm
- DOI: https://dx.doi.org/10.4331/wjbc.121018