
















Copyright: ©Author(s) 2026.
World J Gastrointest Surg. Nov 27, 2026; 18(11): 124589
Published online Nov 27, 2026. doi: 10.4240/wjgs.124589
Published online Nov 27, 2026. doi: 10.4240/wjgs.124589
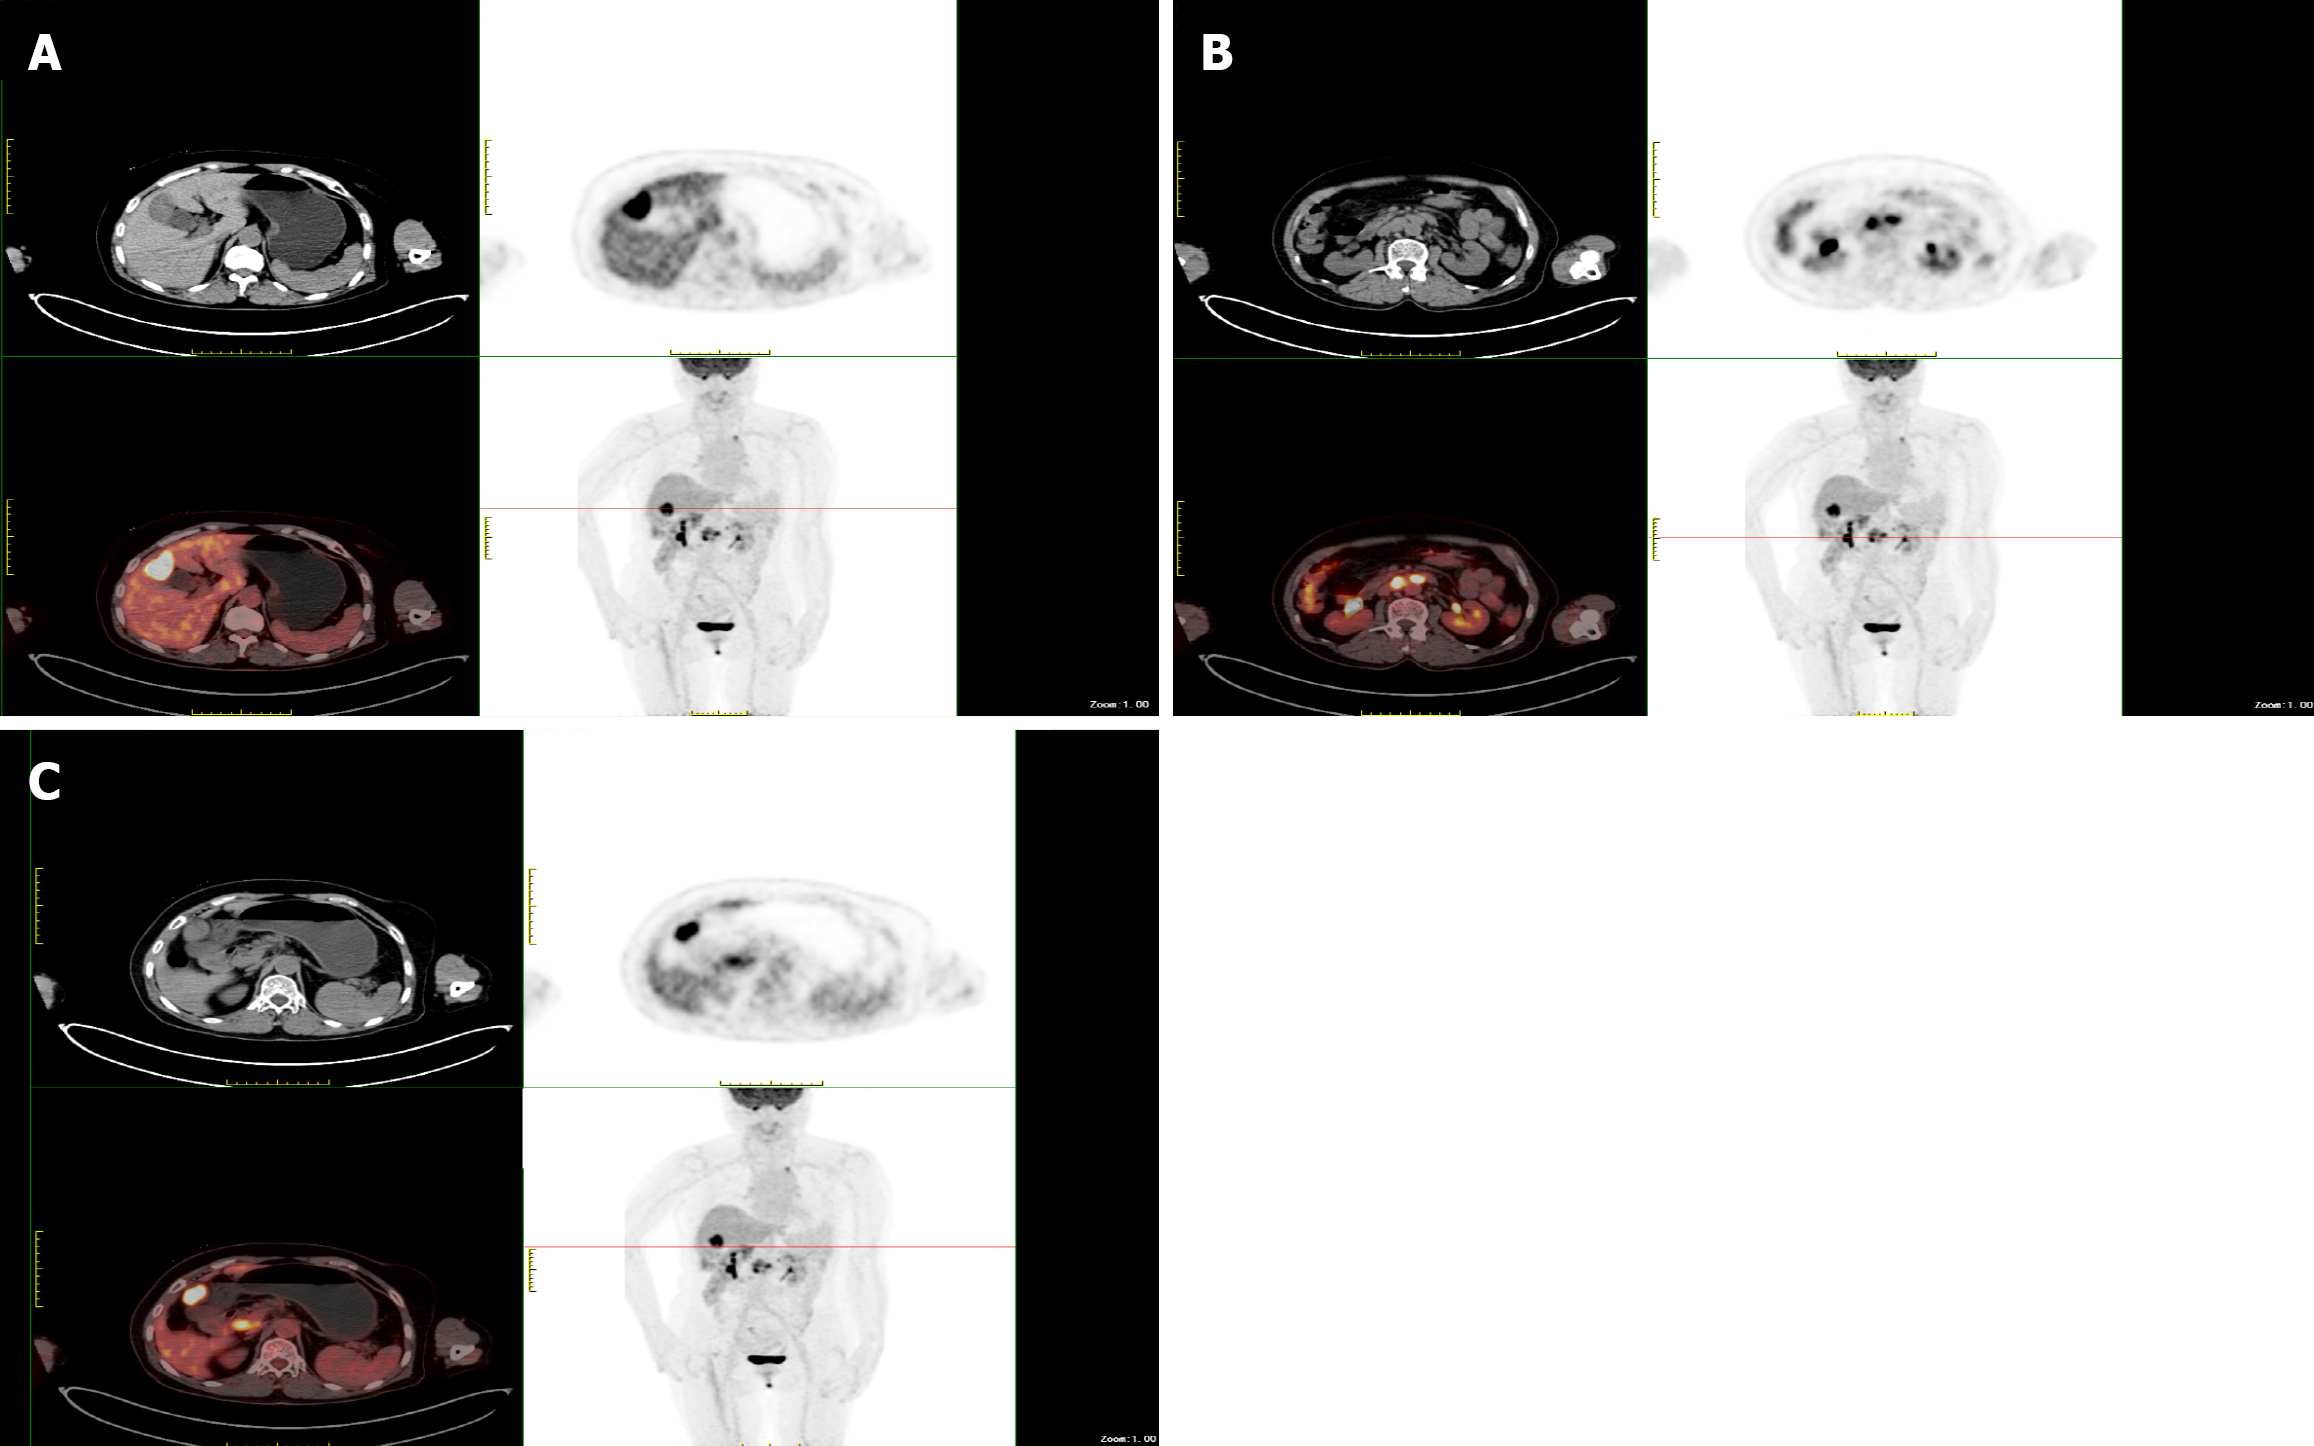
Figure 1 Multimodal positron emission tomography/computed tomography images of the patient.
A: Soft tissue mass in the gallbladder with abnormally increased metabolism; B: Enlarged lymph nodes in the retroperitoneum with abnormally increased metabolism; C: Distribution of high-uptake lesions in the gallbladder fossa and retroperitoneum.
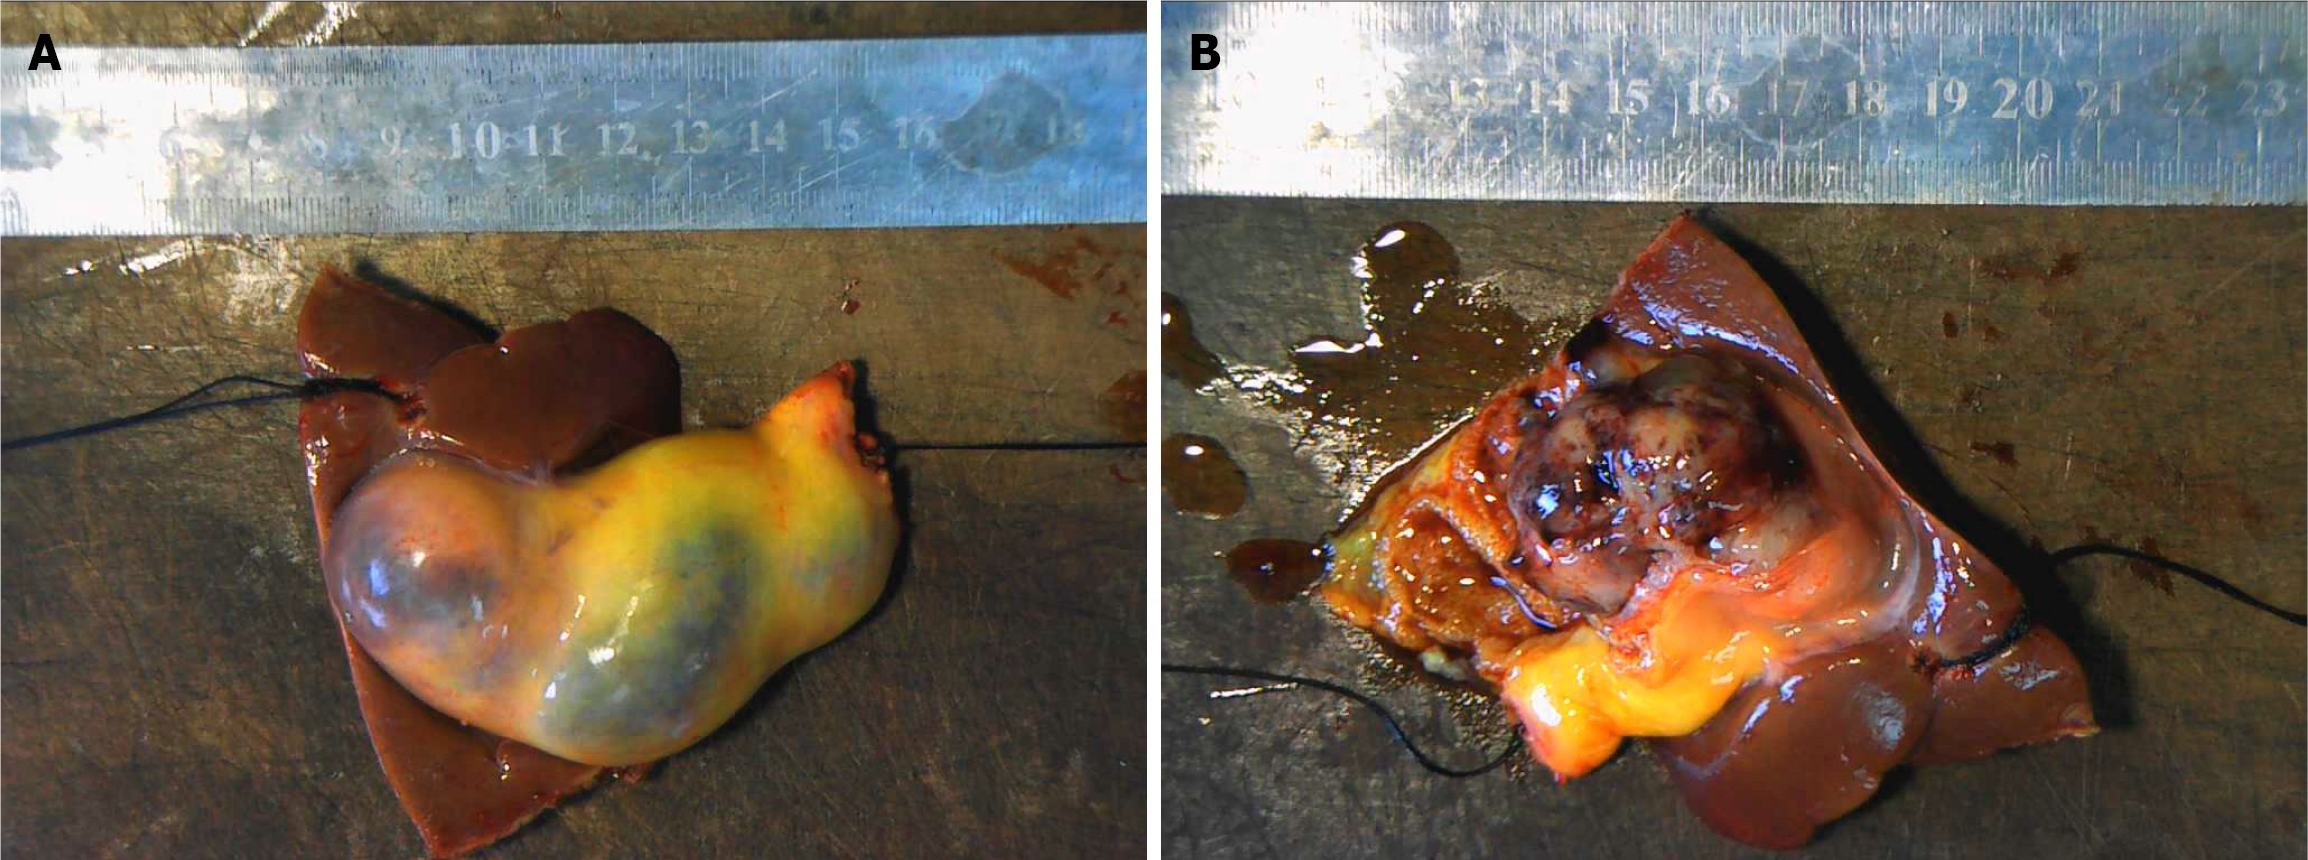
Figure 2 Gallbladder specimens.
A: Gallbladder specimen and gross view after dissection of the bottom of the gallbladder; B: Gross view of the 13 groups of lymph nodes submitted for examination.
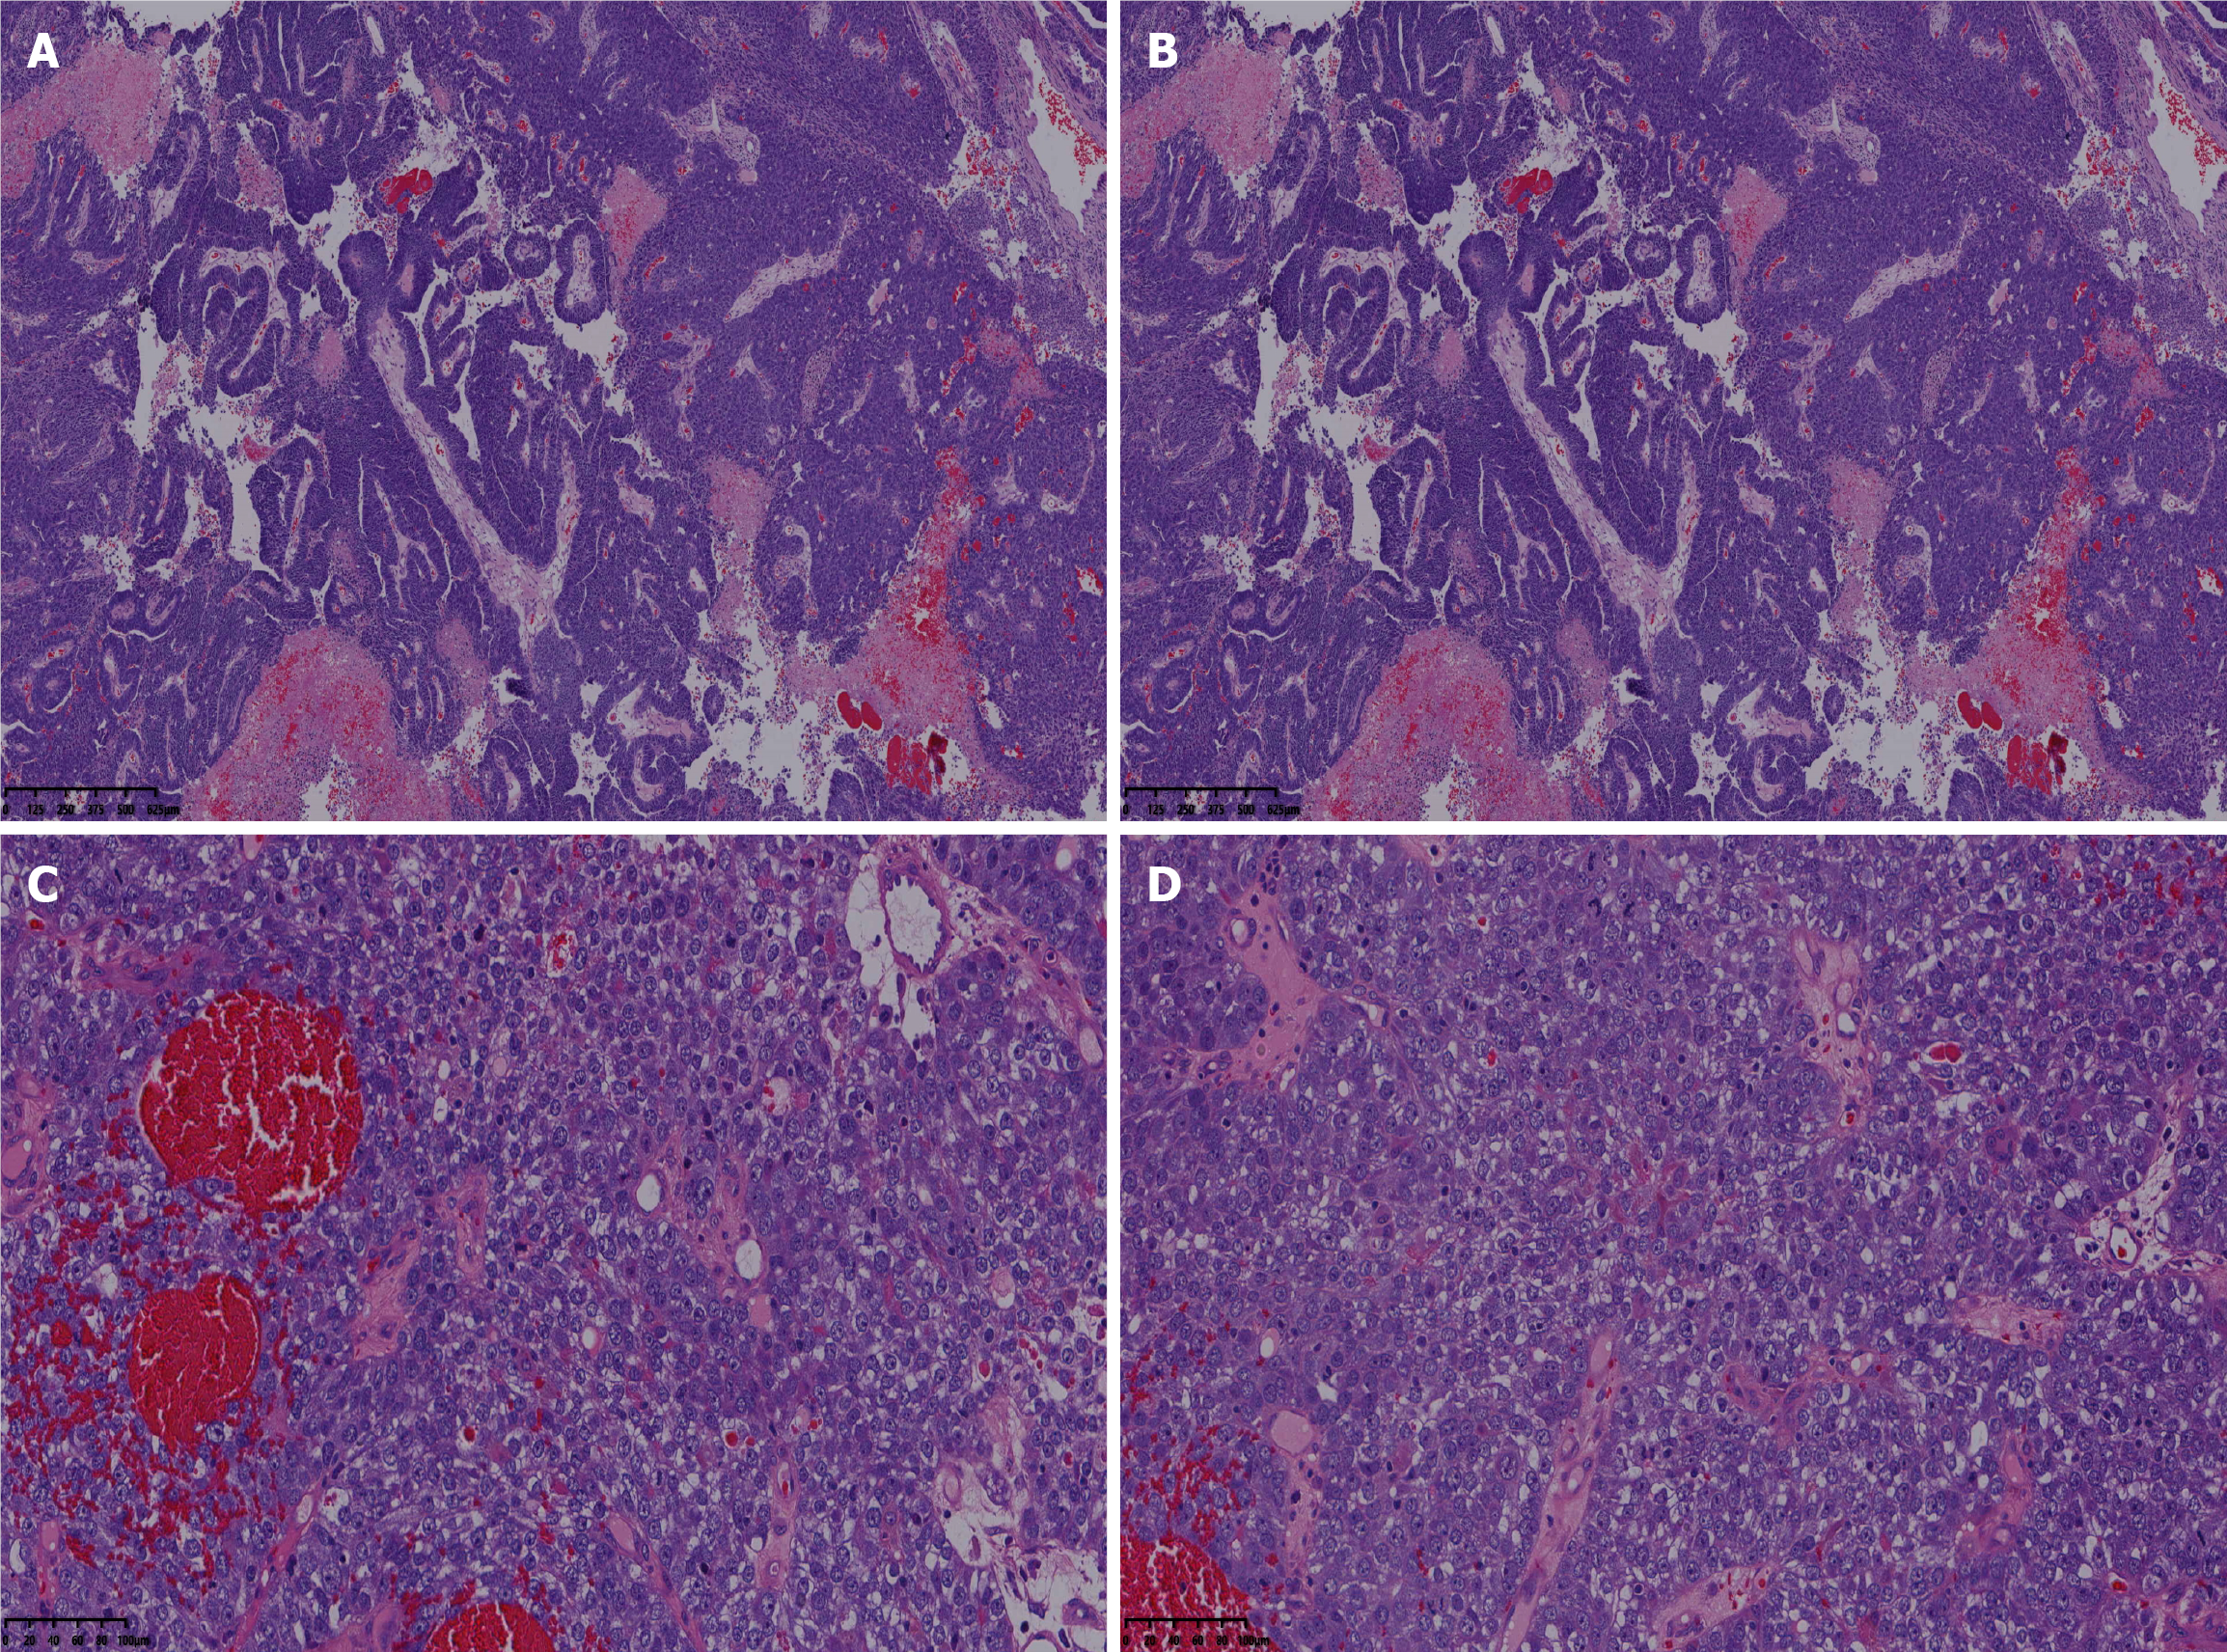
Figure 3 Routine pathological sections of hepatoid adenocarcinoma.
A: Solid and cord-like hepatoid differentiation pattern of tumor cells; B: Ring-like cancer cell morphology; C: Moderately differentiated glandular and papillary structures; D: Perineural invasion (tumor cells encircling a nerve bundle) and microvascular invasion (tumor embolus within a small blood vessel). A-D: Hematoxylin and eosin staining, × 400.
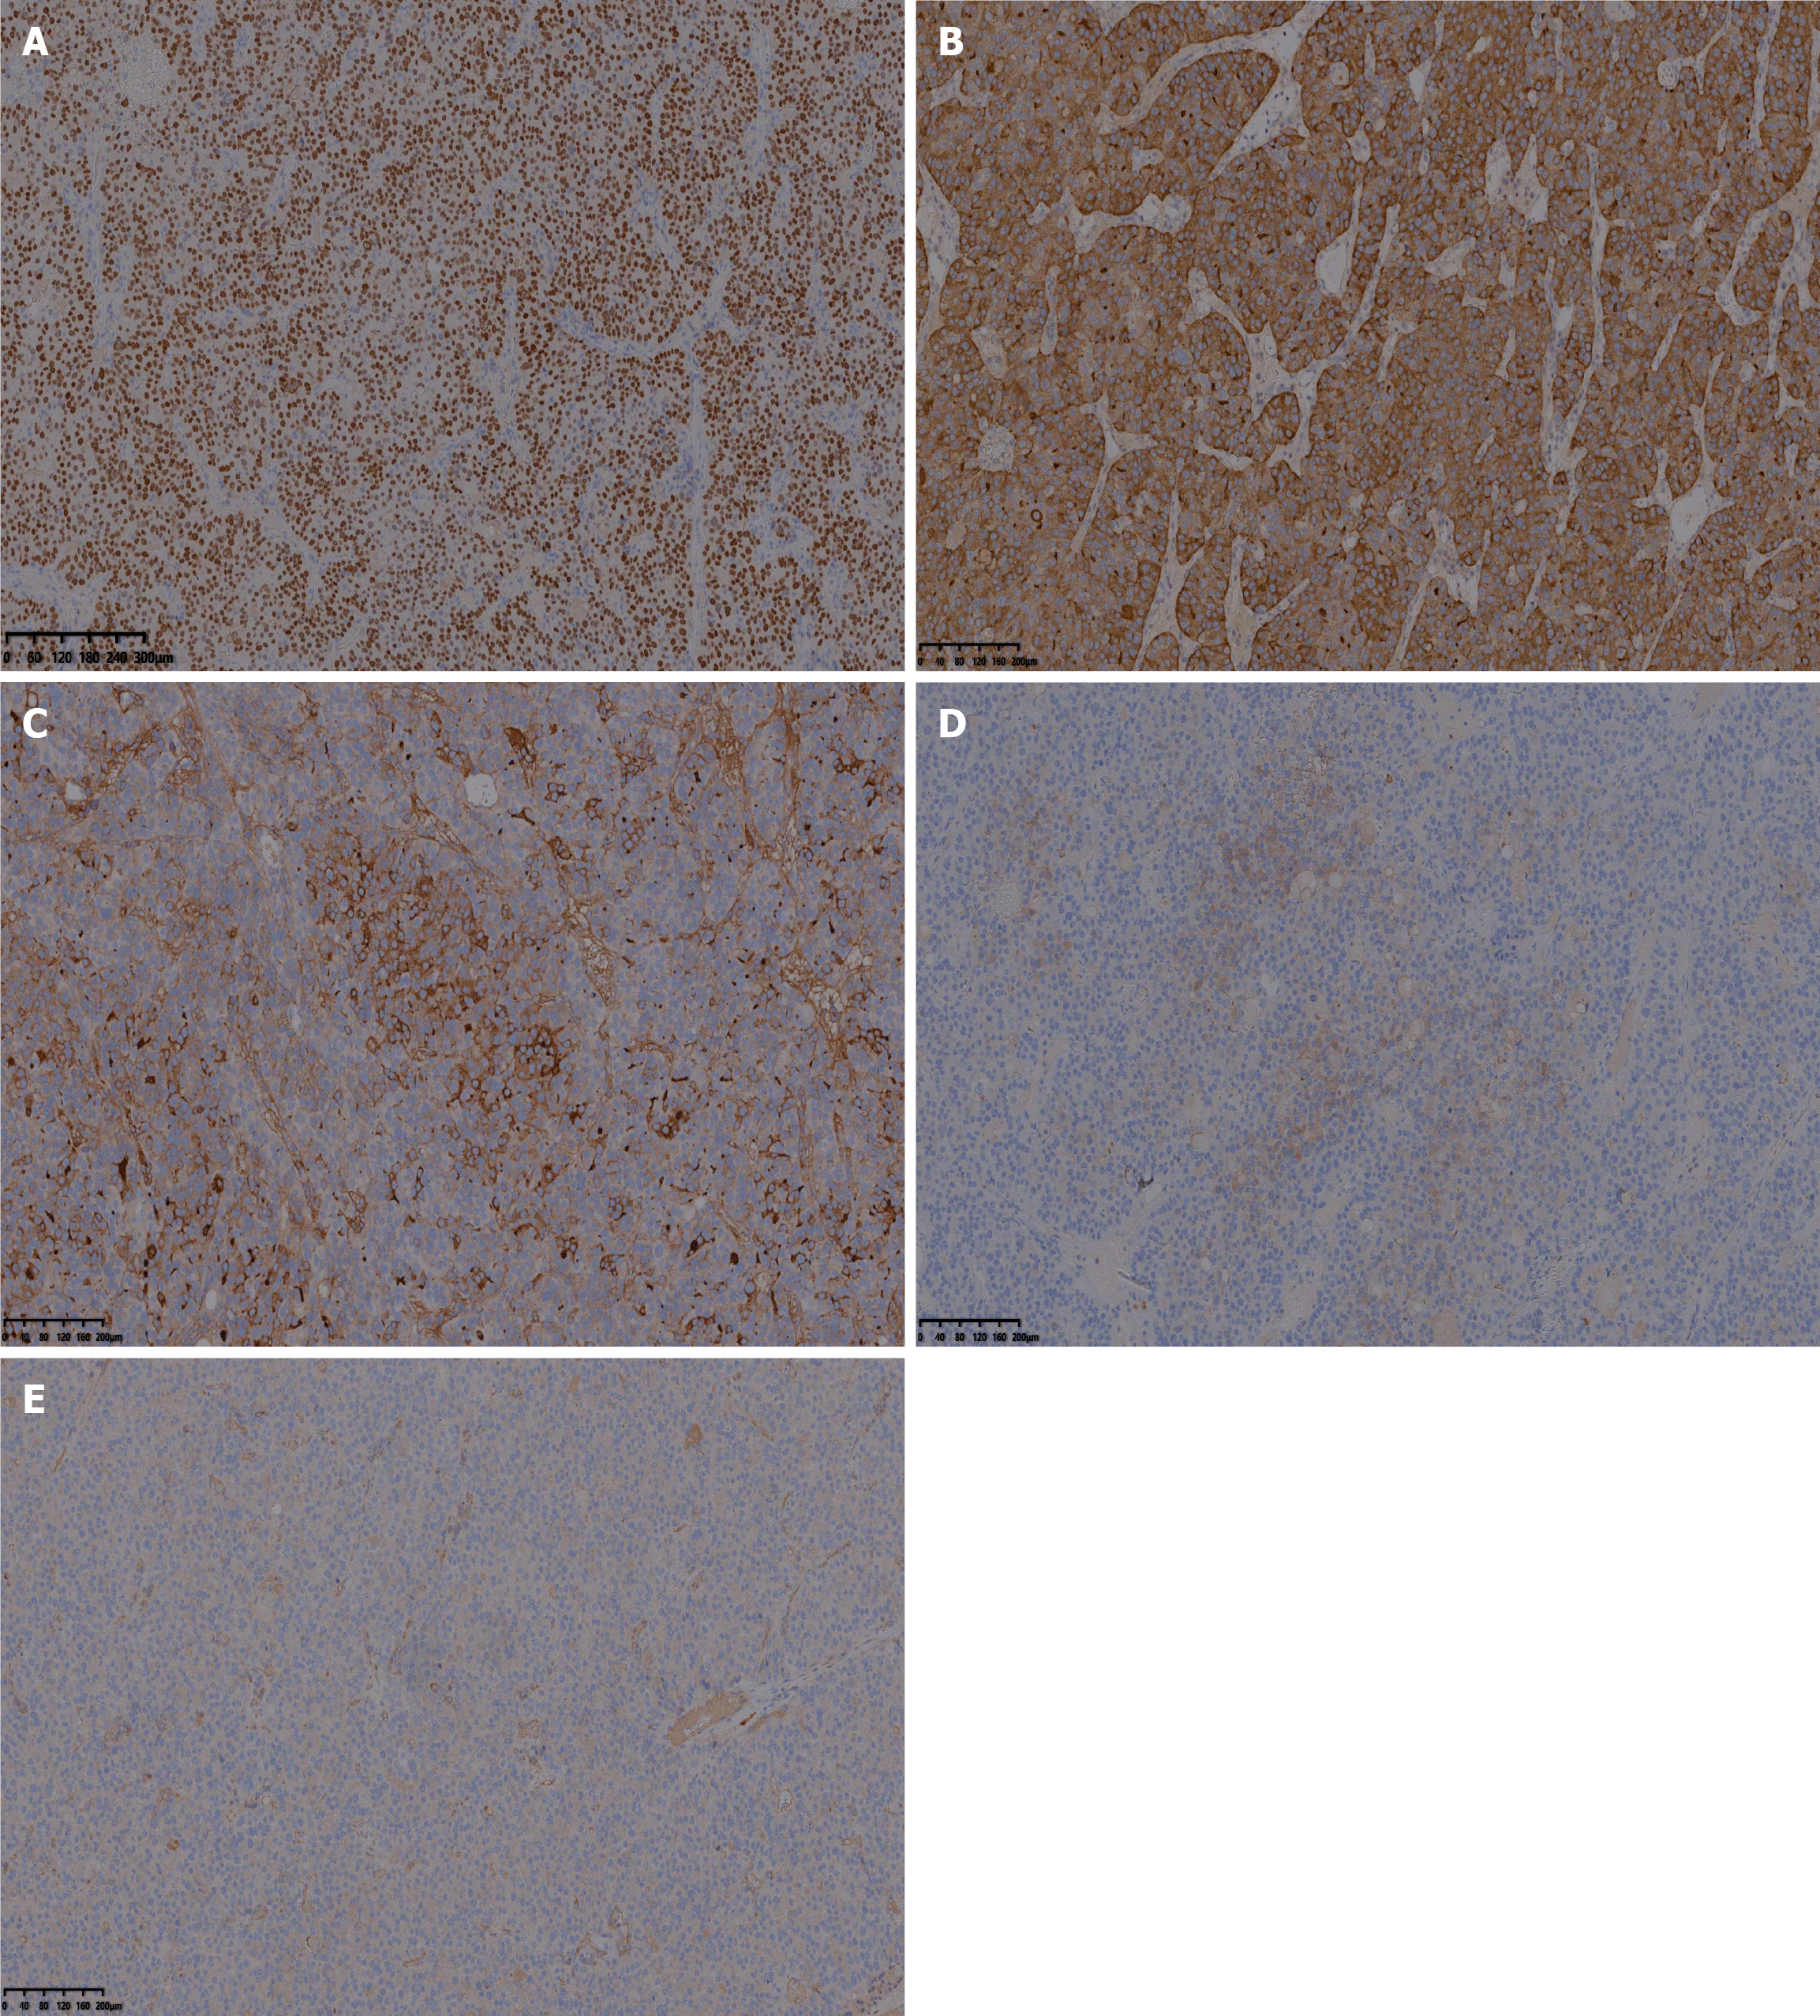
Figure 4 Immunohistochemical results of gallbladder hepatoid adenocarcinoma.
A: Spalt-like transcription factor 4; B: Glypican-3; C: Alpha-fetoprotein; D: Arginase-1; E: Cytokeratin 7.
- Citation: Shui XL, Liu YF. Intraoperative frozen section diagnosis of primary alpha-fetoprotein–positive hepatoid adenocarcinoma of the gallbladder: A case report. World J Gastrointest Surg 2026; 18(11): 124589
- URL: https://www.wjgnet.com/1948-9366/full/v18/i11/124589.htm
- DOI: https://dx.doi.org/10.4240/wjgs.124589