
















Copyright: ©Author(s) 2026.
World J Gastrointest Surg. Nov 27, 2026; 18(11): 122260
Published online Nov 27, 2026. doi: 10.4240/wjgs.122260
Published online Nov 27, 2026. doi: 10.4240/wjgs.122260
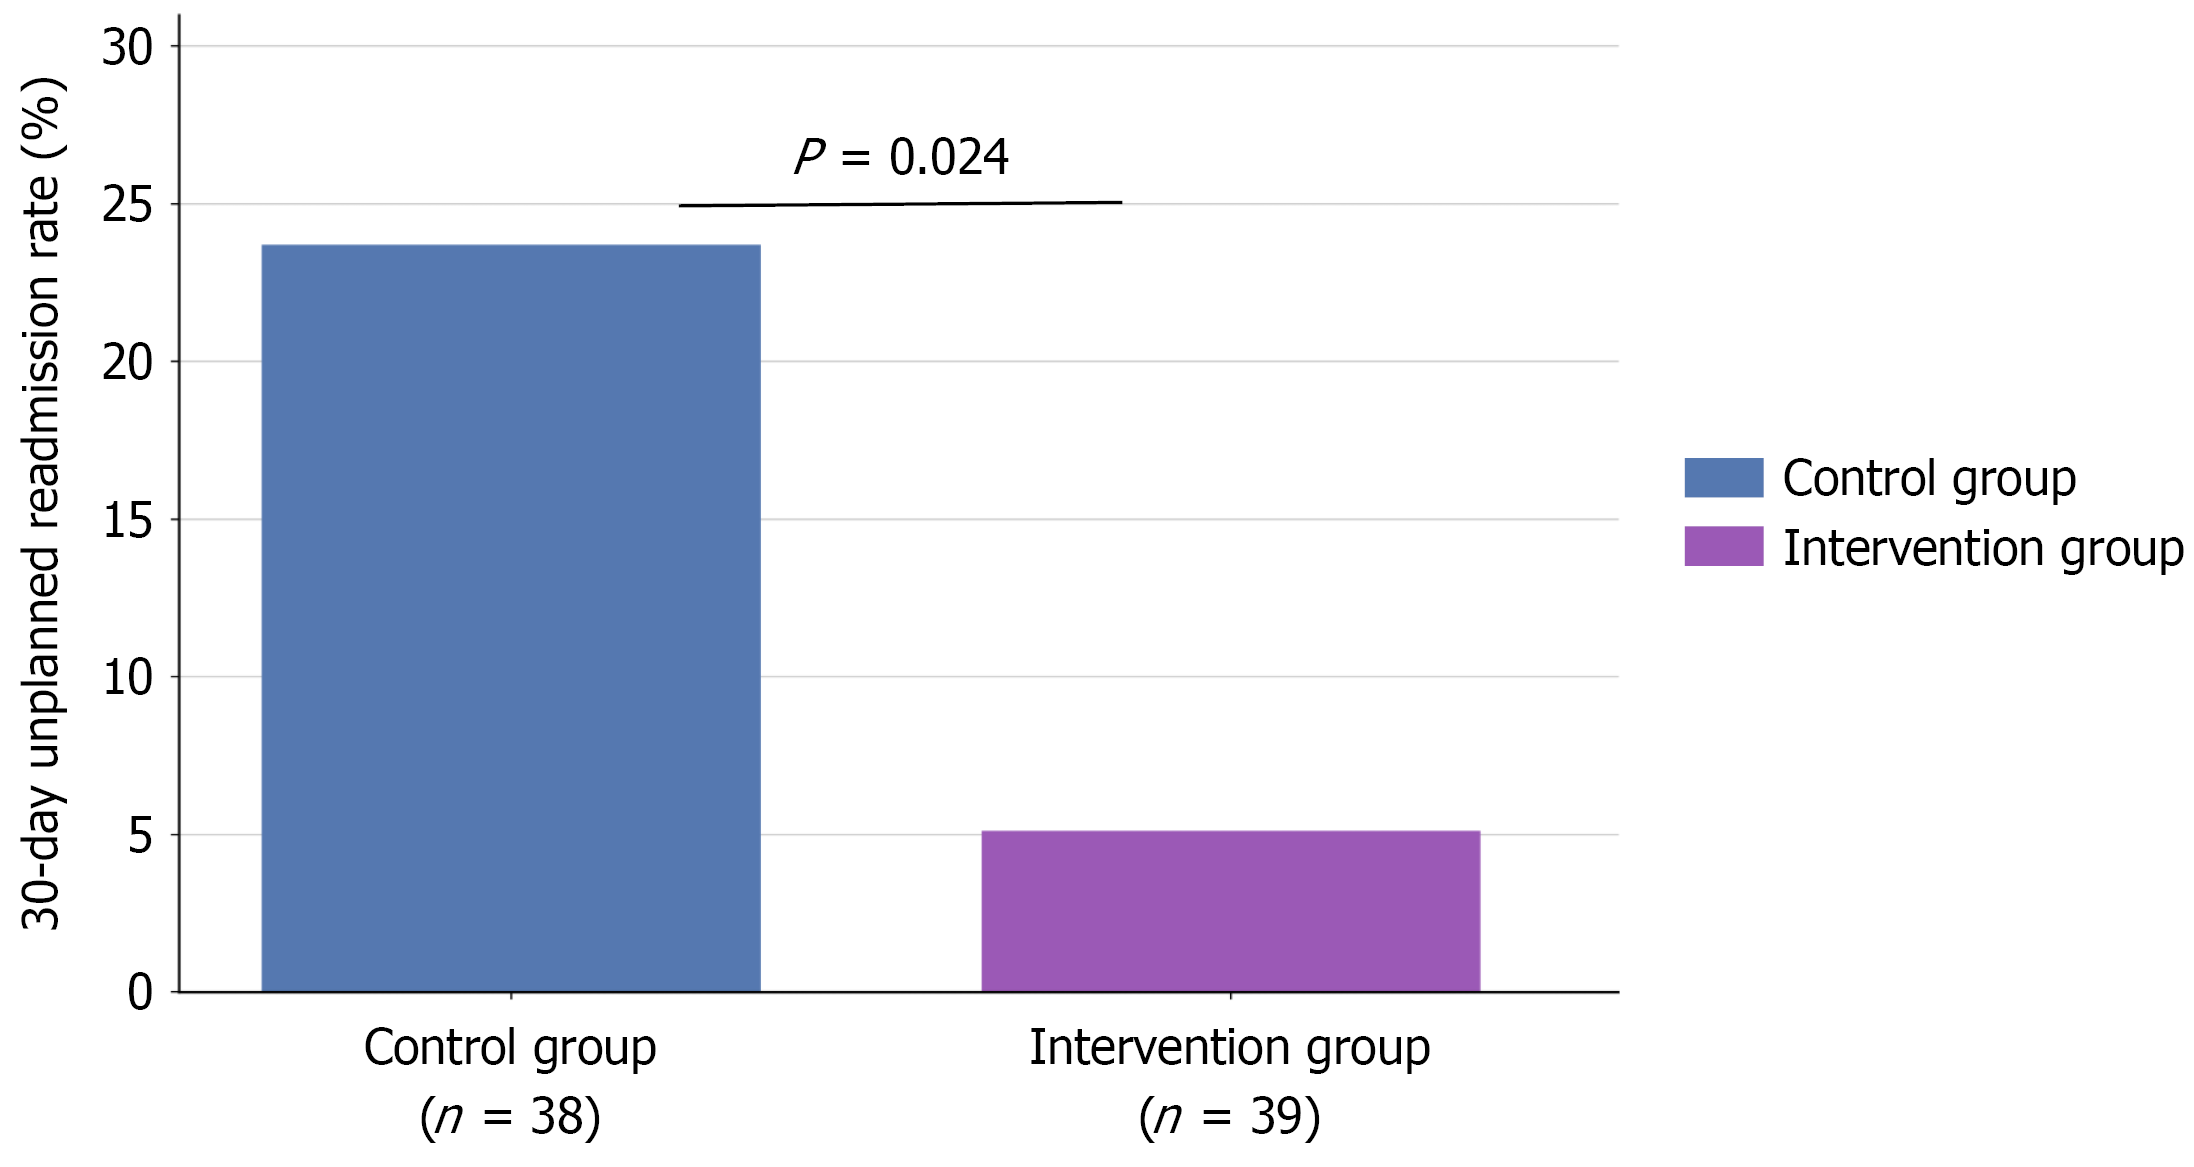
Figure 1 Comparison of 30-day unplanned readmission rates between groups.
Bar chart comparing 30-day unplanned readmission rates: Control group 23.7% vs intervention group 5.1%, P = 0.024.
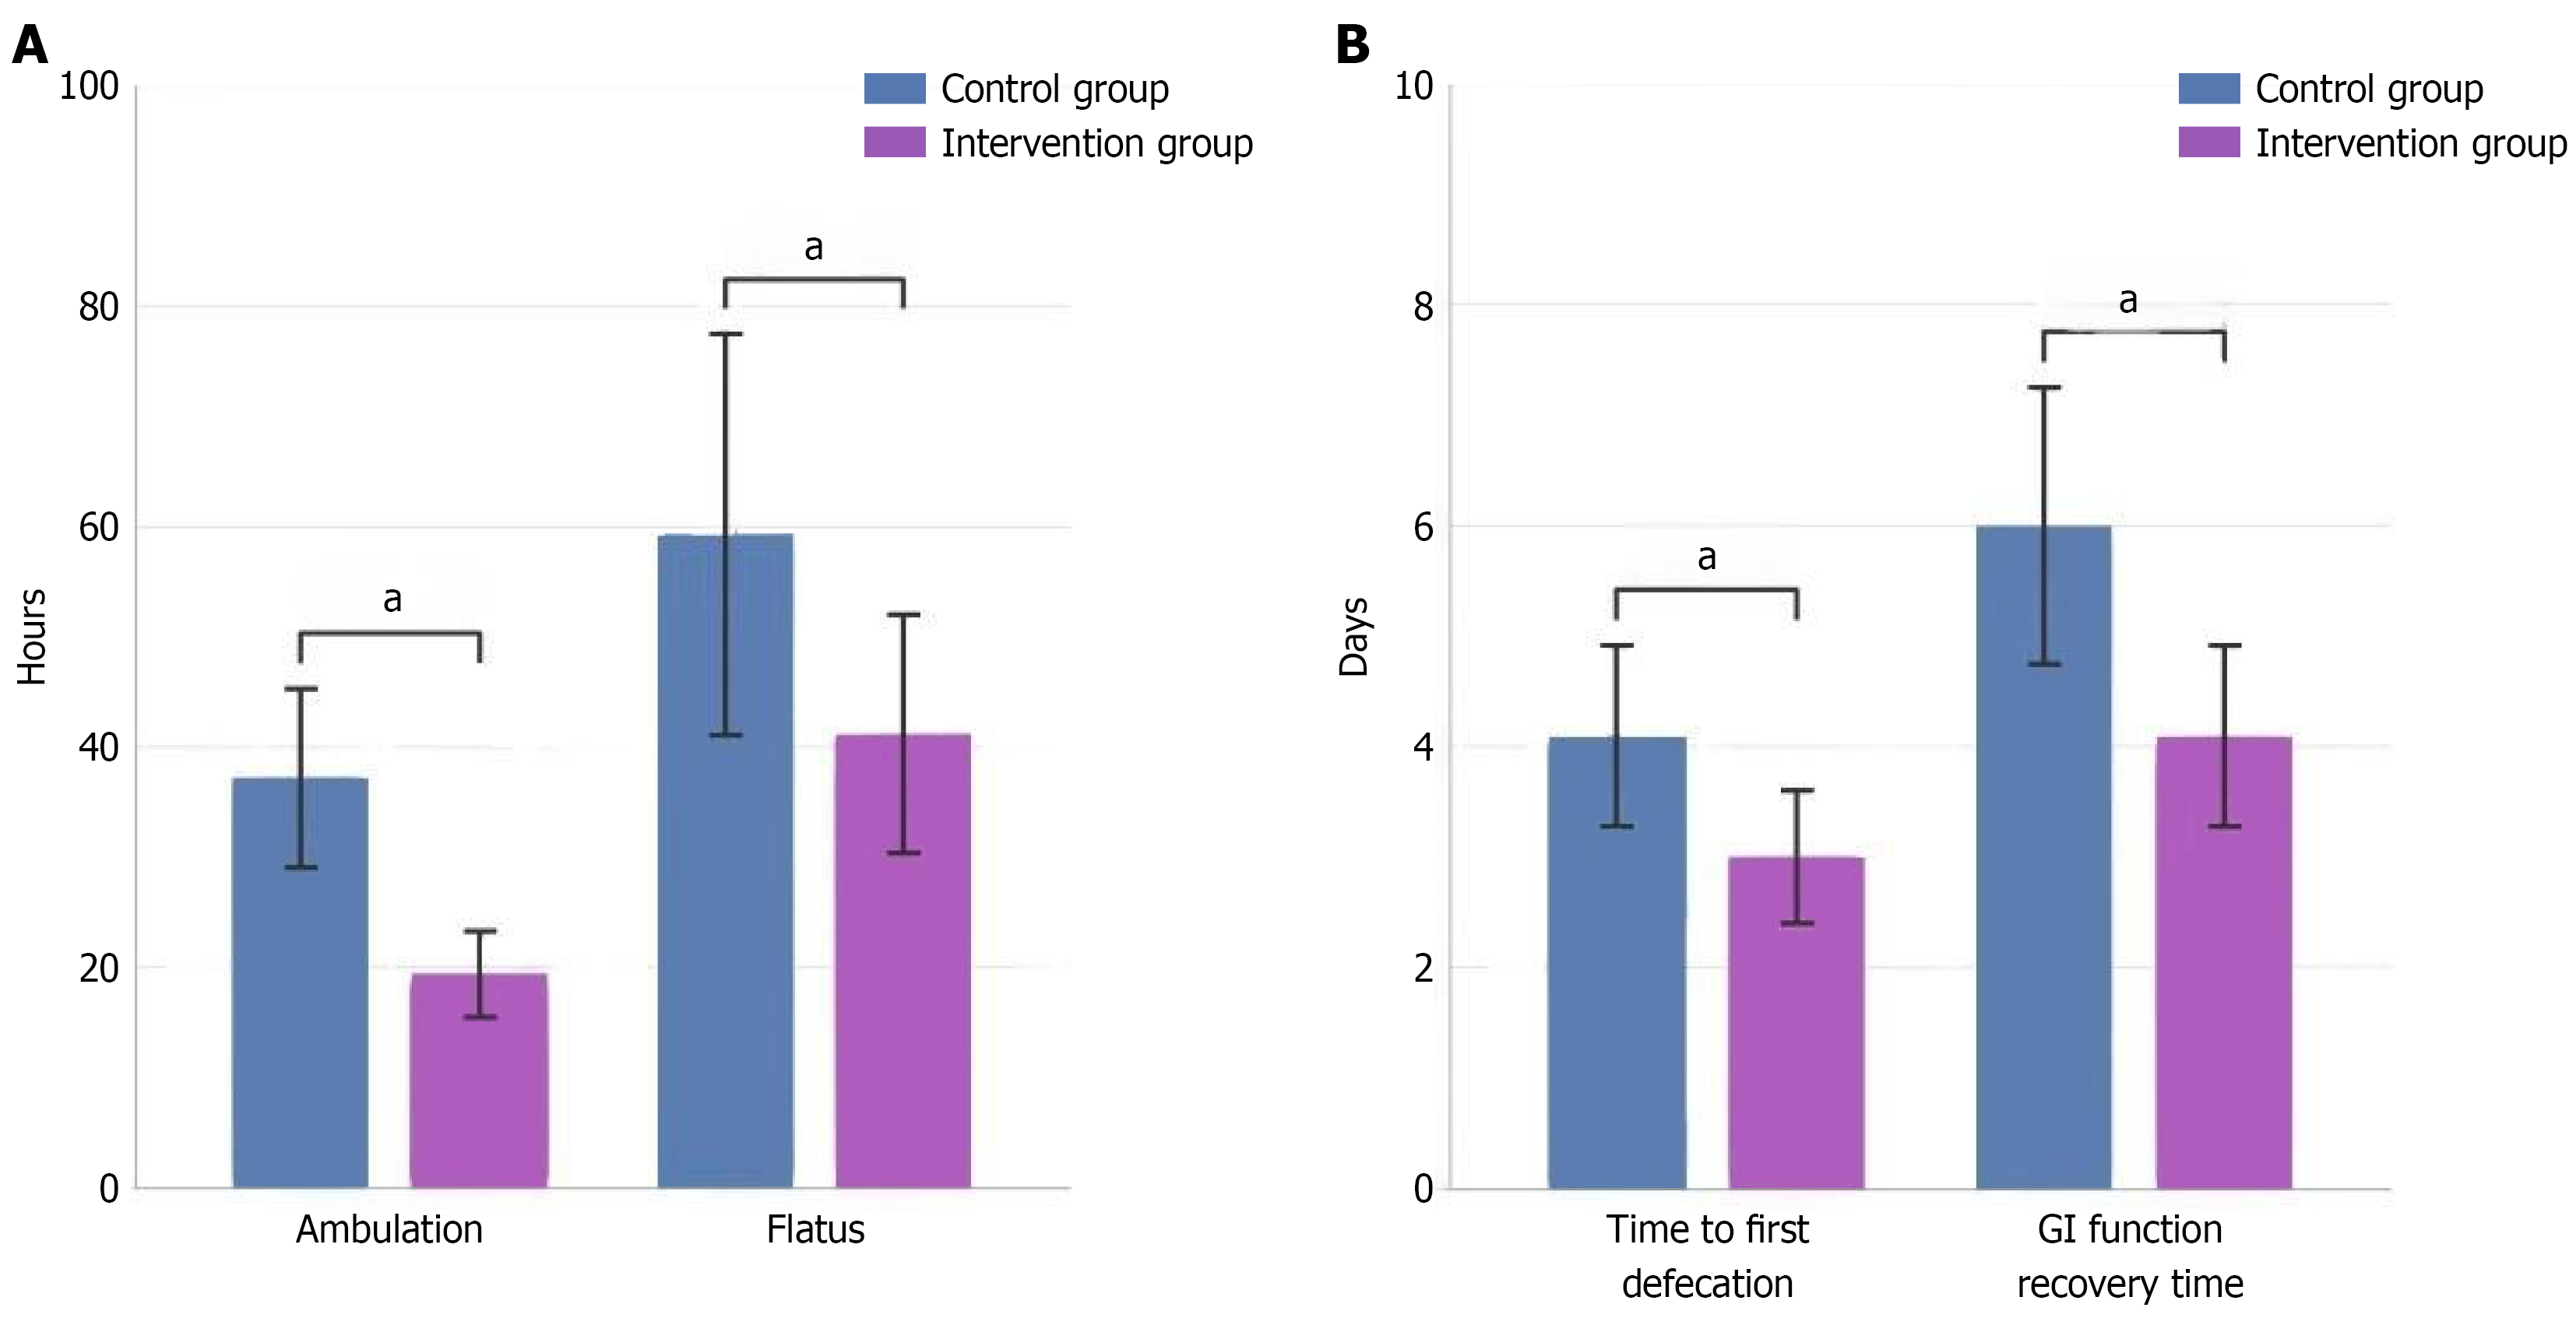
Figure 2 Comparison of postoperative recovery outcomes between the control group (n = 38) and intervention group (n = 39).
A: Time to first ambulation and time to first flatus (hours); B: Time to first defecation and gastrointestinal function recovery time (days). Data are presented as mean ± SD. All between-group differences were statistically significant (aP < 0.05).
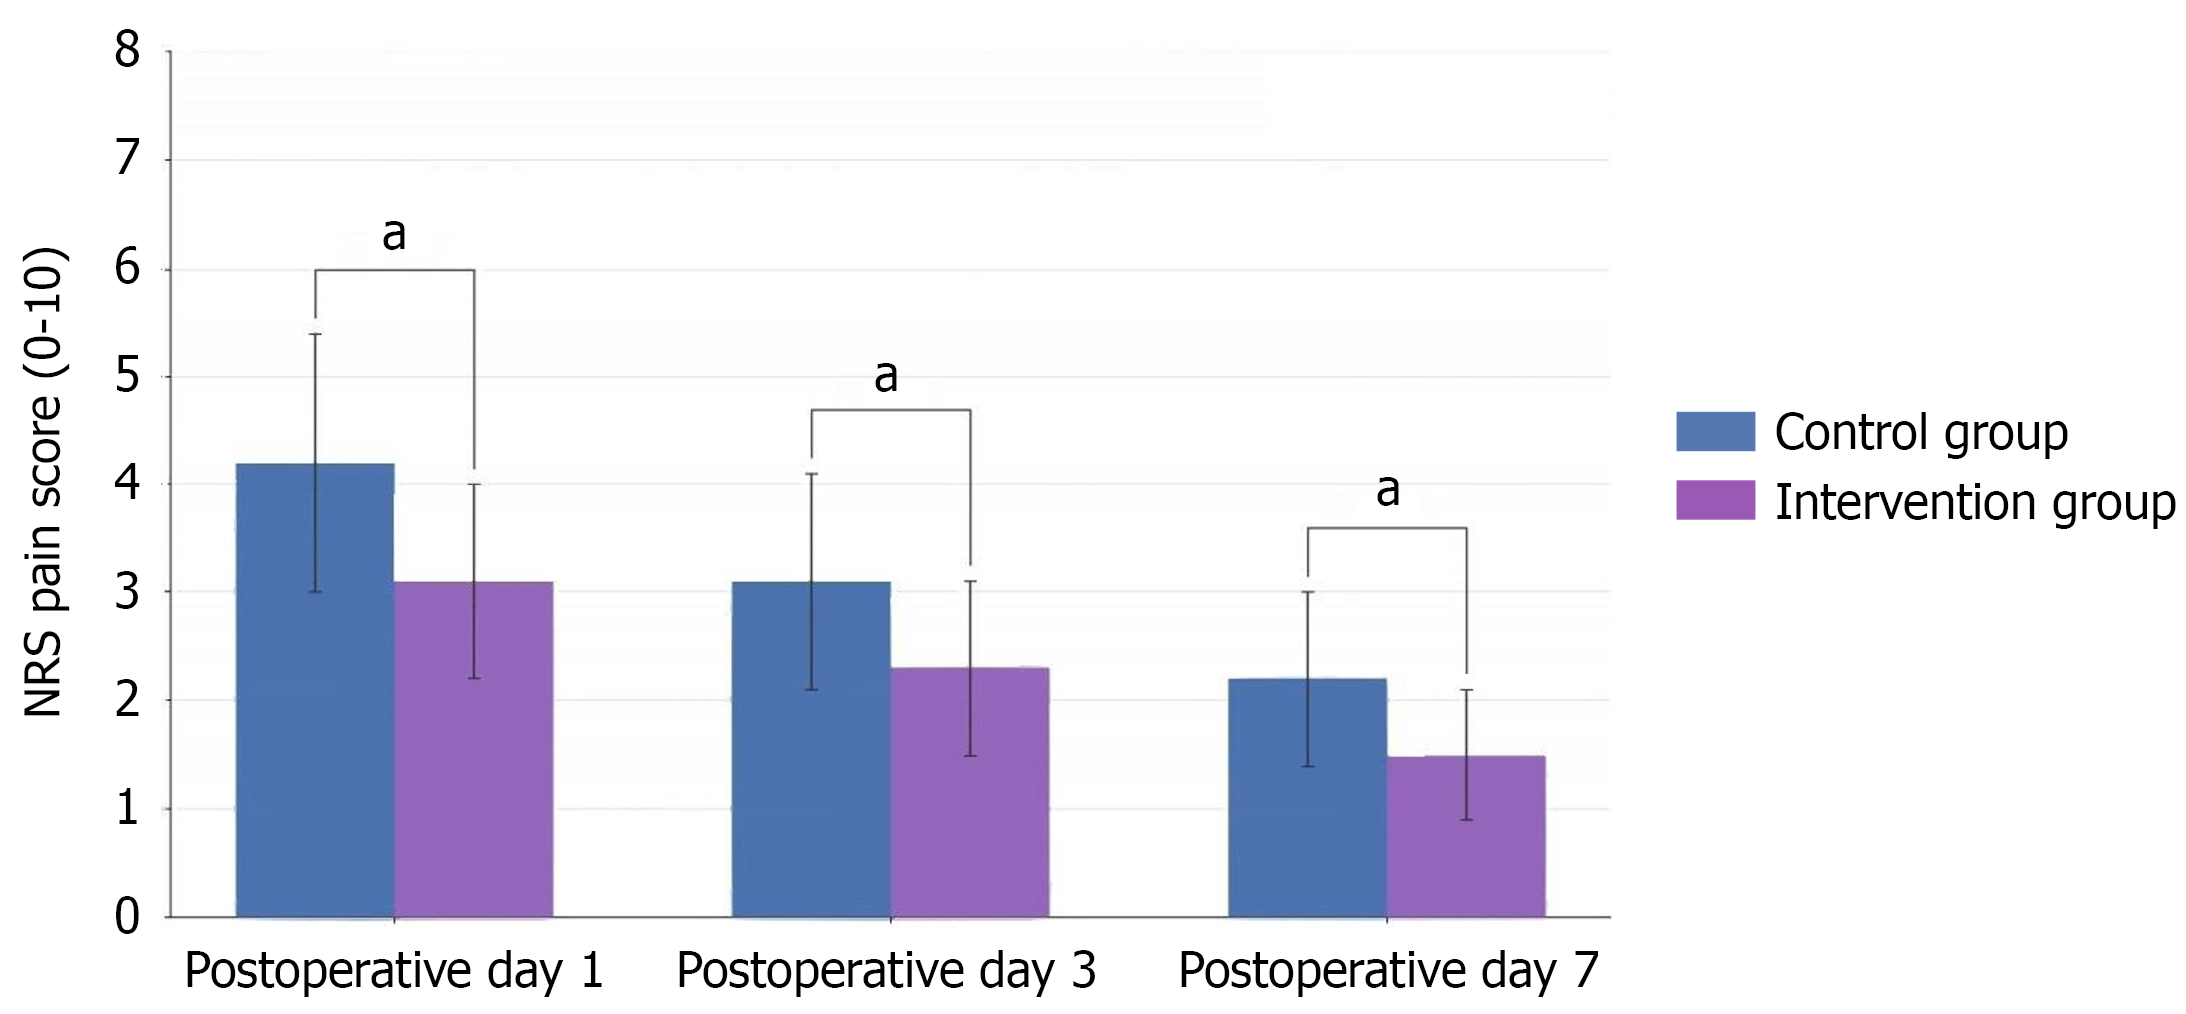
Figure 3 Postoperative pain scores assessed by the Numeric Rating Scale (0-10) on days 1, 3, and 7 in the control group (n = 38) and intervention group (n = 39).
Data are presented as mean ± SD. The intervention group demonstrated significantly lower pain scores at all three time points (aP < 0.001). NRS: Numeric Rating Scale
- Citation: Li HY, Rao X, Zhou XY. Enhanced recovery after surgery, based perioperative bundle reduces 30-day unplanned readmission after laparoscopic colorectal cancer surgery. World J Gastrointest Surg 2026; 18(11): 122260
- URL: https://www.wjgnet.com/1948-9366/full/v18/i11/122260.htm
- DOI: https://dx.doi.org/10.4240/wjgs.122260