


Published online Oct 15, 2023. doi: 10.4239/wjd.v14.i10.1562
Peer-review started: July 2, 2023
First decision: August 4, 2023
Revised: August 16, 2023
Accepted: September 8, 2023
Article in press: September 8, 2023
Published online: October 15, 2023
Processing time: 98 Days and 23 Hours
The continuous glucose monitoring (CGM) system has become a popular evaluation tool for glucose fluctuation, providing a detailed description of glucose change patterns. We hypothesized that glucose fluctuations may contain specific information on differences in glucose change between type 1 diabetes mellitus (T1DM) and type 2 diabetes mellitus (T2DM), despite similarities in change patterns, because of different etiologies. Unlike Fourier transform, continuous wavelet transform (CWT) is able to simultaneously analyze the time and fre-quency domains of oscillating data.
To investigate whether CWT can detect glucose fluctuations in T1DM.
The 60-d and 296-d glucose fluctuation data of patients with T1DM (n = 5) and T2DM (n = 25) were evaluated respectively. Glucose data obtained every 15 min for 356 d were analyzed. Data were assessed by CWT with Morlet form (n = 7) as the mother wavelet. This methodology was employed to search for limited frequency glucose fluctuation in the daily glucose change. The frequency and enclosed area (0.02625 scalogram value) of 18 emerged signals were compared. The specificity for T1DM was evaluated through multiple regression analysis using items that demonstrated significant differences between them as explana
The high frequency at midnight (median: 75 Hz, cycle time: 19 min) and middle frequency at noon (median: 45.5 Hz, cycle time: 32 min) were higher in T1DM vs T2DM (median: 73 and 44 Hz; P = 0.006 and 0.005, respectively). The area of the > 100 Hz zone at midnight to forenoon was more frequent and larger in T1DM vs T2DM. In a day, the lower frequency zone (15-35 Hz) was more frequent and the area was larger in T2DM than in T1DM. The three-dimensional scatter diagrams, which consist of the time of day, frequency, and area of each signal after CWT, revealed that high frequency signals belonging to T1DM at midnight had a loose distribution of wave cycles that were 17-24 min. Multivariate analysis revealed that the high frequency signal at midnight could characterize T1DM (odds ratio: 1.33, 95% confidence interval: 1.08-1.62; P = 0.006).
CWT might be a novel tool for differentiate glucose fluctuation of each type of diabetes mellitus using CGM data.
Core Tip: In the present study, we hypothesized that continuous wavelet transform differentiates glucose fluctuation according to the type of diabetes mellitus. Type 1 diabetes mellitus (T1DM) was characterized by a rapid change (cycle of a 17-24-min interval at midnight). T2DM was characterized by a broad wave (cycle of a 41-96-min interval during a day). Plotting at the three-dimensional scattergram consisting of time, frequency, and an enclosed area of interest revealed that the data of T1DM on the high frequency zone (60-85 Hz) at midnight dispersed into the allocated box, although the glucose fluctuation of T2DM was aligned regularly.
- Citation: Nakamura Y, Furukawa S. Characteristics of glucose change in diabetes mellitus generalized through continuous wavelet transform processing: A preliminary study. World J Diabetes 2023; 14(10): 1562-1572
- URL: https://www.wjgnet.com/1948-9358/full/v14/i10/1562.htm
- DOI: https://dx.doi.org/10.4239/wjd.v14.i10.1562
The levels of blood glucose change during a day because they are controlled by several factors (e.g., a hormonal network, dietary habits, glucose intake, exercise). With the development of continuous glucose monitoring (CGM) systems[1], such changes can be easily and continuously detected in clinical settings[2]. They are occasionally constituted from various waves with complex forms. Therefore, the properties of those waves are able to decompose any signals following elementary functions that are well concentrated in time and frequency.
Recently, the continuous wavelet transform (CWT) method was utilized for the analysis of oscillating data obtained from clinical diagnostic tools, such as those produced by electroencephalography[3,4], electromyography[5,6], electroretinography[7], phonocardiography[8,9], ultrasound sonoelastography[10], and electrocardiography including a longitudinal wave[5,11-14]. This type of processing has epochal merit for simultaneously exploring the time and frequency domains, although Fourier transform is unable to analyze a time domain[15-17].
When considering the pathophysiology of representative abnormal glucose dynamics, type 1 diabetes mellitus (T1DM) and type 2 diabetes mellitus (T2DM) exhibit marked differences. T1DM is an autoimmune disease characterized by β-cell destruction. T2DM is a complex metabolic disorder, in which the pathophysiology involves an interaction between genetic predisposition and environmental triggers. Based on this knowledge, it was hypothesized that daily glycemic variation may provide insight into the different fluctuation patterns of blood glucose according to the etiologies. Therefore, this study evaluated whether CWT could differentiate signals in blood glucose fluctuation between the two DM groups using CGM data.
Data were obtained from consecutive 5 outpatients with T1DM and 25 outpatients with T2DM, who visited the Specified Clinic of Soyokaze CardioVascular Medicine and Diabetes Care (Matsuyama, Ehime, Japan) from December 1, 2017 to June 30, 2018. In the present study, the inclusion criteria were: Patients receiving any diabetic therapy; and age > 20 years. The exclusion criteria were: Presence of a malignancy and history of treatment in the previous 5 years; liver dysfunction with transaminase levels > 100 IU/L; renal dysfunction with estimated glomerular filtration rate < 30 mL/min; implantation of a pacemaker; occurrence of acute coronary syndrome in the previous 2 mo; and pregnancy.
Furthermore, 8 outpatients treated for hypertension or dyslipidemia with normal glucose fluctuation applied through an in-hospital communication sheet supplied by the clinical study team. In addition to those volunteers, two healthy volunteers who applied via an invitation on the website homepage of the clinic were also included. Their data were utilized in this study as a reference to determine the normal glucose levels through CWT processing. All subjects provided written informed consent for their participation in this study. This study was approved by the ethics committee of Ehime University (approval No. 1711001).
A sensor of the flash glucose monitoring system (FreeStyle Libre Pro®; Abbott, Chicago, IL, United States) was attached to the back of the upper arm of all subjects. The memorized text document data obtained from subcutaneous tissue every 15 min over a period of 14 d were converted to comma-separated values files. These data were transformed through CWT processing. The 60-d data of 5 patients with T1DM and 296-d data obtained from 25 patients with T2DM were evaluated. Glucose data of a total of 356 d were employed in this analysis, because this evaluation tool was used to search for a limited frequency glucose fluctuation into the daily glucose change.
Wavelet transform decomposes a signal into a series of dilated and translated versions of the mother wavelet function[17]. The form of the CWT of a signal is defined by the following formula.

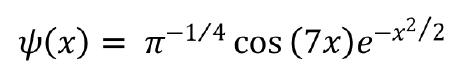
In this study, 𝜓(x) was nominated as a Morlet form, using wave number 7 as the mother wavelet. This process was performed using OriginPro® version 2018 (OriginLab Co., Northampton, MA, United States). This function computes the real continuous wavelet coefficient of x(t) for each given scale presented in the scale vector a and each position b from 1 to 96 during 24 h. The obtained scalogram matrix by CWT was presented in the form of a contour diagram. In case of data loss due to a sensor error, the data of that day were excluded from the analysis. Consequently, this application assigned a pseudo-frequency with a cycle of 1 Hz wave over a 24-h period. The signals that emerged on the contour diagram were divided into 18 areas according to the time and frequency zone, which corresponded to the peak scalogram value. The frequency zone was defined as follows: 60-85 Hz, high frequency signal (P1-P3); 35-55 Hz, middle frequency signal (P4-P8); > 100 Hz, super-high frequency signal (P9-P11); and 15-35 Hz, lower frequency signal (P12-P18). If the enclosed area at the 0.02625 scalogram value fused to another area of different points, those signal data were adopted at the point that showed the highest scalogram value. The other area points, which had a lower scalogram value, defined defect data because those borderlines could not be fixed.
The frequency at a point that showed the peak scalogram value was compared between the groups to clarify the specific glucose fluctuation in T1DM. The area enclosed at the scalogram value of 0.02625 on the contour diagram was also evaluated. Subsequently, the relationships of factors exhibiting significant differences with the specific glucose fluctuation in T1DM were determined through multivariate analysis.
The statistical methods used in this study were reviewed by Data Seed Inc., a consulting company specializing in biostatistics (https://dt-seed.com, info@dt-seed.com). Age, body mass index, hemoglobin A1c levels, and daily dose of insulin used were compared between the T1DM and T2DM groups using the Mann-Whitney U test. All frequencies and areas, which emerged through CWT in the two groups, were also evaluated using the Mann-Whitney U test. The statistically calculated data of mean glucose and mean amplitude of glucose excursion (MAGE) were converted to natural logarithm, because they were obtained based on an approximate normal distribution. Because of a normal distribution, those indices together with log mean glucose, standard deviation, percent coefficient of variation, and log MAGE were evaluated using the unpaired t-test. Sex, medications, and number of signals obtained through CWT were assessed using the Fisher’s exact test. For the selection of possible factor characterized in T1DM glucose fluctuation, logistic regression analysis was employed using factors that showed significant differences between the two groups as explanatory variables. P < 0.05 was considered statistically significant.
All statistical analyses were performed with EZR (Saitama Medical Center, Jichi Medical University, Saitama, Japan), which is a graphical user interface for R (The R Foundation for Statistical Computing, Vienna, Austria). More precisely, it is a modified version of R commander designed to include additional statistical functions frequently used in biostatistics[18].
The characteristics of subjects and medications used in both diabetes groups, as well as data of subjects without diabetes (reference), are summarized in Table 1. The average data for glucose change did not show a significant difference between the groups. However, significant differences between the two groups were recorded for the standard deviation, percent coefficient of variation, and log MAGE. The representative contour diagram that emerged from glucose fluctuation after conversion through CWT is shown in Figure 1. The T1DM group showed some signals on the super-high frequency zone (rate: 20% at P9, 27% at P10) in contrast with the T2DM group (rate: 7% at P9, 11% at P10) (P = 0.003 and P = 0.003, respectively). Signals of the T2DM group appeared more frequently on the lower frequency zone (i.e., 15-35 Hz on the contour map, indicating a time cycle of 41-96 min) throughout the day (Table 2). The median frequency of P1 signal in the T1DM group was 75 Hz (quartile: 72-78 Hz), indicating a time cycle of 19 min. This value was higher than that noted in the T2DM group [median: 73 Hz (quartile: 71–75 Hz)] (P = 0.006). The wave period of this range signals in T1DM was 18-20 min. Moreover, the median frequency of P6 signal in the T1DM group was 45.5 Hz (quartile: 44-46.25 Hz), indicating a time cycle of 32 min. Signals that emerged on the middle frequency range around noon each day were higher than those observed in the T2DM group [median: 44 Hz (quartile: 42-45 Hz)] (P = 0.005) (Table 3). The area of P9 and P10 points of the T1DM group was larger than that of the T2DM group, although both groups exhibited less emergence in that frequency zone compared with other zones. The area of the lower frequency zone, which was positioned at P12-P17, was smaller and less frequent in the T1DM group vs the T2DM group (Table 4).

| Characteristic | T1DM group | T2DM group | P value | Subjects without diabetes |
| Days evaluated, n | 60 | 296 | - | 23 |
| Age, yr | 50 (43-66) | 61 (48-71) | 0.419a | 60 (47.5-72.3) |
| Sex as female/male, n | 2/3 | 7/18 | 0.622b | 4/6 |
| BMI in kg/m2 | 28.3 (26.0-39.3) | 26.0 (22.5-28.6) | 0.229a | 22.9 (21.7-27.2) |
| HbA1c, % | 8.8 (8.6-9.3) | 7.6 (6.9-9.0) | 0.220a | 5.4 (5.4-5.5) |
| Log MG | 5.09 ± 0.32 | 5.11 ± 0.30 | 0.579c | 4.61 ± 0.08 |
| SD | 56.26 ± 18.63 | 44.60 ± 20.29 | < 0.001c | 11.58 ± 2.37 |
| %CV | 34.85 ± 11.85 | 25.53 ± 7.43 | < 0.001c | 11.56 ± 2.66 |
| Log MAGE | 4.58 ± 0.40 | 4.41 ± 0.42 | 0.003c | 3.17 ± 0.27 |
| Medication, n | ||||
| Metformin | 0 | 5 | 0.556b | N/A |
| DPP-4 inhibitor | 0 | 21 | 0.001b | N/A |
| α-GI | 0 | 3 | 1.000b | N/A |
| Thiazoline | 0 | 14 | 0.045b | N/A |
| SGLT2 inhibitor | 0 | 4 | 1.000b | N/A |
| SU | 0 | 0 | 1.000b | N/A |
| GLP-1 RA | 0 | 5 | 0.556b | N/A |
| Insulin | 5 | 16 | 0.286b | N/A |
| Total insulin dose in U | 37 (34-38) | 8 (0-20) | 0.008a | N/A |
| Ultra-rapid in U | 21 (18-26) | 0 (0-11) | 0.030a | N/A |
| Lasting in U | 16 (11-20) | 2 (0-14) | 0.022a | N/A |
| Time zone | Position | Frequency zone | Prevalence rate, % | ||
| T1DM group | T2DM group | P value | |||
| Midnight | |||||
| P9 | Super-high | 20 | 7 | 0.003 | |
| P1 | High | 85 | 88 | 0.527 | |
| P4 | Middle | 20 | 34 | 0.047 | |
| P12 | Low | 13 | 26 | 0.032 | |
| P13 | Low | 15 | 32 | 0.008 | |
| Daytime | |||||
| P10 | Super-high | 27 | 11 | 0.003 | |
| P2 | High | 88 | 93 | 0.299 | |
| P5 | Middle | 32 | 39 | 0.311 | |
| P6 | Middle | 40 | 43 | 0.670 | |
| P7 | Middle | 42 | 48 | 0.478 | |
| P14 | Low | 15 | 33 | 0.005 | |
| P15 | Low | 15 | 35 | 0.001 | |
| Night | |||||
| P11 | Super-high | 13 | 10 | 0.491 | |
| P3 | High | 83 | 94 | 0.014 | |
| P8 | Middle | 42 | 50 | 0.321 | |
| P17 | Low | 25 | 43 | 0.014 | |
| P18 | Low | 22 | 41 | 0.005 | |
| Time zone | Position | Frequency zone | T1DM group | T2DM group | P value | ||||
| Min | Median | Max | Min | Median | Max | ||||
| Midnight | |||||||||
| P9 | Super-high | 106 | 108 | 108 | 106 | 107 | 108 | 0.433 | |
| P1 | High | 61 | 75 | 85 | 61 | 73 | 80 | 0.006 | |
| P4 | Middle | 39 | 45 | 53 | 38 | 45 | 56 | 0.265 | |
| P12 | Low | 29 | 30.5 | 38 | 28 | 32 | 36 | 0.634 | |
| P13 | Low | 29 | 30 | 36 | 27 | 31 | 35 | 0.965 | |
| Daytime | |||||||||
| P10 | Super-high | 106 | 108 | 108 | 106 | 107 | 108 | 0.100 | |
| P2 | High | 66 | 75 | 84 | 59 | 74 | 81 | 0.088 | |
| P5 | Middle | 37 | 45 | 50 | 37 | 44 | 51 | 0.418 | |
| P6 | Middle | 33 | 45.5 | 58 | 37 | 44 | 51 | 0.005 | |
| P7 | Middle | 35 | 45 | 54 | 33 | 44 | 57 | 0.225 | |
| P14 | Low | 25 | 30 | 33 | 18 | 30 | 35 | 0.895 | |
| P15 | Low | 25 | 30 | 32 | 17 | 30 | 37 | 0.885 | |
| P16 | Low | 25 | 30.5 | 33 | 20 | 30 | 36 | 0.725 | |
| Night | |||||||||
| P11 | Super-high | 107 | 108 | 108 | 105 | 107 | 108 | 0.004 | |
| P3 | High | 65 | 75 | 85 | 59 | 74 | 86 | 0.104 | |
| P8 | Middle | 36 | 45 | 54 | 37 | 44 | 53 | 0.893 | |
| P17 | Low | 25 | 28.5 | 33 | 17 | 29 | 36 | 0.395 | |
| P18 | Low | 26 | 33 | 35 | 17 | 31 | 37 | 0.166 | |
| Time zone | Position | Frequency zone | T1DM group | T2DM group | P value | ||||
| Min | Median | Max | Min | Median | Max | ||||
| Midnight | |||||||||
| P9 | Super-high | 0.00 | 0.00 | 8.70 | 0.00 | 0.00 | 5.34 | 0.008 | |
| P1 | High | 0.00 | 3.01 | 8.99 | 0.00 | 2.75 | 8.14 | 0.866 | |
| P4 | Middle | 0.00 | 0.00 | 5.06 | 0.00 | 0.00 | 5.67 | 0.111 | |
| P12 | Low | 0.00 | 0.00 | 0.60 | 0.00 | 0.00 | 4.01 | 0.043 | |
| P13 | Low | 0.00 | 0.00 | 0.65 | 0.00 | 0.00 | 1.83 | 0.011 | |
| Daytime | |||||||||
| P10 | Super-high | 0.00 | 0.00 | 8.32 | 0.00 | 0.00 | 6.81 | 0.001 | |
| P2 | High | 0.00 | 3.96 | 5.87 | 0.00 | 3.65 | 6.43 | 0.267 | |
| P5 | Middle | 0.00 | 0.00 | 3.32 | 0.00 | 0.00 | 5.23 | 0.249 | |
| P6 | Middle | 0.00 | 0.00 | 5.77 | 0.00 | 0.00 | 3.70 | 0.812 | |
| P7 | Middle | 0.00 | 0.00 | 5.29 | 0.00 | 0.00 | 5.50 | 0.348 | |
| P14 | Low | 0.00 | 0.00 | 0.95 | 0.00 | 0.00 | 3.91 | 0.005 | |
| P15 | Low | 0.00 | 0.00 | 1.42 | 0.00 | 0.00 | 4.40 | 0.003 | |
| P16 | Low | 0.00 | 0.00 | 1.63 | 0.00 | 0.00 | 2.22 | 0.020 | |
| Night | |||||||||
| P11 | Super-high | 0.00 | 0.00 | 1.07 | 0.00 | 0.00 | 6.48 | 0.257 | |
| P3 | High | 0.00 | 3.39 | 8.38 | 0.00 | 3.75 | 9.18 | 0.258 | |
| P8 | Middle | 0.00 | 0.00 | 5.09 | 0.00 | 0.00 | 6.70 | 0.163 | |
| P17 | Low | 0.00 | 0.00 | 2.02 | 0.00 | 0.00 | 2.47 | 0.031 | |
| P18 | Low | 0.00 | 0.00 | 7.09 | 0.00 | 0.00 | 7.08 | 0.059 | |
The three-dimensional (3D) scatter diagrams, which consist of a time of a day, a frequency, and an area of each signal after CWT, are demonstrated in Figure 2. Subjects without diabetes showed three high frequency signals (P1-P3) and five middle frequency signals (P4-P8) regularly distributed in a similar interval during 24 h. Occasionally, some cases exhibited signals in the low frequency zone. The distribution of T2DM was similar to that observed in subjects without diabetes, although each signal zone expanded toward a time (x-axis) and an area (y-axis) direction; the frequency fluctuation (z-axis) was small for all signals. Furthermore, signals that emerged on the low frequency zone were increased, whereas other signals of the super-high frequency zone were observed in the glucose fluctuation of patients with T2DM in a few days. By contrast, the 3D scatter diagram of T1DM showed a destroyed distribution pattern, particularly in the frequency width of the P1 signal. Consequently, the borderline of each signal disappeared, complicating the differentiation of signals.

In the multivariate analysis, the area data of P13, P14, and P15 were removed because the value of the variance inflation factor was > 5. Furthermore, the area data of P9, P12, and P16 were also removed because those items had a large 95% confidence interval (CI) (1.33 × 10⁻¹⁶ to 1.90 × 10¹² at P9, 0.08-50.4 at P12, and 0.01-213 at P16) (Supple
| Selected item | Odds ratio | 95%CI | P value | |
| Lower | Upper | |||
| Frequency of P1 signal | 1.33 | 1.08 | 1.62 | 0.006 |
| Frequency of P6 signal | 0.84 | 0.63 | 1.12 | 0.232 |
| Area of P10 signal | 1.24 | 0.72 | 2.14 | 0.432 |
| Area of P17 signal | 1.24 | 0.29 | 5.29 | 0.771 |
The present evaluation of 356-d glucose data demonstrated that CWT processing can detect the specific glucose wave form of T1DM with regard to the onset time and time cycle in the contour map. It revealed that the P1 signal wave length was broadly distributed during a 17-24 min interval at midnight. This finding indicated that the cycle of glucose change in T1DM was irregular and involved different waves around a 19 min interval at midnight. On the other hand, T2DM was characterized by low frequency signals distributed during a 39-85 min cycle that emerged frequently, and those areas increased during 1 d.
The CWT represents the time-frequency space of a signal as a matrix with magnitude values that can be readily visualized in the form of a heat map to reveal important features, transient effects, and anomalies[17]. T1DM showed super-high frequency signals from midnight to forenoon with high probability. Furthermore, the distribution of P1 signals in the T1DM group showed differences in time, area, and frequency on the contour map after CWT processing. However, the distribution in the T2DM group was similar to that observed in subjects without diabetes. This observation suggested that T1DM exhibits complex and short glucose changes. Those rapid and varied glucose changes at midnight might reflect the presence of the dawn phenomenon or Somogyi effect. Notably, a regular signal appearance observed after CWT may indicate preserved basal insulin secretion. By contrast, increased signals on the low frequency zone were frequently noted in the T2DM group. This finding suggested that slow glucose change components were included in the CGM glucose data. However, the reason underlying this finding could not be determined in this study. It is hypothesized that the results might reflect the effects of medications or the pathophysiology of insulin resistance.
Glucose variability in T1DM is largely due to the lack of or diminished insulin secretion. The frequency of fluctuation might be an important phenomenon when considering differences in the pathophysiology of diabetes. Previous studies have reported increases in several statistical calculation markers of T1DM such as the standard deviation of blood glucose change, percent cyclic variation, and MAGE[19,20]. Those indices are calculated based on the amplitude of the glucose value. However, CWT processing discovered the object wave of interest from daily glucose change; furthermore, this method could detect the time when the target wave presented during a day. This is fundamentally different from conventional statistical indices. Unfortunately, CWT could not reverse original data; therefore, it could not detect the amplitude width of the glucose wave, although the value of the scalogram could detect the wave power.
Recently, it was reported that the use of artificial intelligence and CWT may improve the accuracy of atrial fibrillation detection through electrocardiography (10 s)[14]. This proposed evaluation method based on CGM data may be able to accurately and promptly diagnose pathogenesis through the use of deep learning after CWT processing.
In the present study, it was not possible to remove the effects of medications on glucose fluctuation owing to the small sample size. To exclude such bias and identify the specificity for T1DM glucose fluctuation, a large number of patients are required because the degree of impaired β cells differs depending on the stage. Furthermore, T2DM had a different pathophysiology, such as an insulin resistance or a decrease of insulin secretion. Glucose fluctuations differ between days. Therefore, when the pathophysiology of diabetes is assessed, it is important to determine whether glucose data from several days were averaged or data from a single day were used. In this study, the latter approach was employed. Furthermore, this analysis could not determine the amplitude of the target wave form, although the duration of a wave period was obtained because CWT could not reverse original data after processing.
The contour diagram obtained through CWT demonstrated that fluctuation in the high frequency wave, indicating a time cycle of 17-24 min at midnight, could characterize T1DM based on glucose transition. The scatter diagram of signals demonstrated that the distribution pattern in T1DM was destroyed, although T2DM exhibited a similar pattern to that observed in subjects without diabetes. The present method may contribute to the differentiation of glucose fluctuations according to the etiology of DM.
Recently, the continuous glucose monitoring (CGM) system was readily accepted in the clinical setting. Although that system provides details of the glucose fluctuation that occur during a day, occasionally, a lot of vague data might confuse the interpretation of a glucose shift. Continuous wavelet transform (CWT) is a novel approach for analyzing oscillating data in the case of clinical field. That methodology is able to analyze time domain and frequency domain simultaneously, although Fourier transforms are limited to the analysis of frequency domain.
When the glucose change during a day can replace a waveform, the glucose fluctuation includes some waveform in the glucose change. We hypothesized the specific waveform of type 1 diabetes mellitus (T1DM) might be present because glucose change pattern might be different from T2DM due to a different etiology. The CWT is an available method to explore the target substance into the objects through analyzing oscillating data.
The present study evaluated 60-d glucose fluctuation data obtained from T1DM patients (n = 5) and 296-d data from T2DM patients (n = 25).
The data obtained every 15 min from a flash glucose monitoring system during 14 d were converted through the CWT process. In the present study, Morlet form (n = 7) was employed as the mother wavelet. The produced scalogram matrix by CWT was converted to the contour diagram. Through this process, the waveform obtained from CGM divided 18 segment signals, that is, 3 super-high frequency (> 100 Hz) zones, 3 high frequency (60-85 Hz) zones, 5 middle frequency (35-55 Hz) zones, and 7 low frequency (15-35 Hz) zones. The frequency and an enclosed area at 0.02625 scalogram value obtained from those emerged signals were compared between the T1DM and T2DM groups at 18 segments. To identify the specificity of T1DM, a statistical approach was applied. The explanatory variables of a logistic regression analysis model were the nominated items, which were significantly different between groups.
In the T1DM group, super-high frequency signals at midnight and forenoon emerged more frequently. On the other hand, the prevalence rate of low frequency signals in a day in the T2DM group was increased. The high frequency signal at night and middle frequency signal also emerged frequently in the T2DM group. The frequency of the high frequency signal at midnight and the middle frequency signal at noon in the T1DM group were higher than those of the T2DM group. The areas of low frequent zone in a day in the T2DM group were significantly higher than those of the T1DM group. In multivariate analysis, some data were excluded because of the variance inflation factor and a large 95% confidence interval (CI). Finally, the fine waveform presented in the high frequency signal zone at midnight showed the characteristic wave pattern of T1DM (odds ratio = 1.33, 95%CI: 1.08-1.62; P = 0.006).
Through the contour diagram after CWT processing, the fine waveform indicating a time cycle of 17-24 min at midnight had characterized the glucose fluctuation of T1DM. However, the low frequency signals emerged frequently in T2DM in 1 d.
Confirming the accuracy of present study required a lot of data to be obtained from both groups. If an artificial intelligence including deep learning is available in this analyzing system, it will obtain the results rapidly and correctly because this manual process takes a lot of time, even though it is a 1 d data calculation. Furthermore, this novel approach will be available to research the relationship between the diabetic complications and any specific waveform and might select medications according to the patients’ conditions to decease any diabetic complications.
Provenance and peer review: Unsolicited article; Externally peer reviewed.
Peer-review model: Single blind
Specialty type: Endocrinology and metabolism
Country/Territory of origin: Japan
Peer-review report’s scientific quality classification
Grade A (Excellent): 0
Grade B (Very good): B, B
Grade C (Good): C, C
Grade D (Fair): 0
Grade E (Poor): 0
P-Reviewer: Duan W, China; Liu D, China; Su G, China; Islam, South Africa S-Editor: Wang JJ L-Editor: A P-Editor: Yuan YY
| 1. | Clarke SF, Foster JR. A history of blood glucose meters and their role in self-monitoring of diabetes mellitus. Br J Biomed Sci. 2012;69:83-93. [PubMed] |
| 2. | Cappon G, Vettoretti M, Sparacino G, Facchinetti A. Continuous glucose monitoring sensors for diabetes management: A review of technologies and applications. Diabetes Metab J. 2019;43:383-397. [RCA] [PubMed] [DOI] [Full Text] [Full Text (PDF)] [Cited by in Crossref: 155] [Cited by in RCA: 211] [Article Influence: 35.2] [Reference Citation Analysis (0)] |
| 3. | Salyers JB, Dong Y, Gai Y. Continuous wavelet transform for decoding finger movements from single-channel EEG. IEEE Trans Biomed Eng. 2019;66:1588-1597. [RCA] [PubMed] [DOI] [Full Text] [Cited by in Crossref: 16] [Cited by in RCA: 16] [Article Influence: 2.3] [Reference Citation Analysis (0)] |
| 4. | Farabi SS, Carley DW, Quinn L. EEG power and glucose fluctuations are coupled during sleep in young adults with type 1 diabetes. Clin Neurophysiol. 2016;127:2739-2746. [RCA] [PubMed] [DOI] [Full Text] [Cited by in Crossref: 11] [Cited by in RCA: 18] [Article Influence: 2.0] [Reference Citation Analysis (0)] |
| 5. | Wachowiak MP, Wachowiak-Smolíková R, Johnson MJ, Hay DC, Power KE, Williams-Bell FM. Quantitative feature analysis of continuous analytic wavelet transforms of electrocardiography and electromyography. Philos Trans A Math Phys Eng Sci. 2018;376. [RCA] [PubMed] [DOI] [Full Text] [Cited by in Crossref: 15] [Cited by in RCA: 5] [Article Influence: 0.7] [Reference Citation Analysis (0)] |
| 6. | Fu J, Cao S, Cai L, Yang L. Finger gesture recognition using sensing and classification of surface electromyography signals with high-precision wireless surface electromyography sensors. Front Comput Neurosci. 2021;15:770692. [RCA] [PubMed] [DOI] [Full Text] [Full Text (PDF)] [Reference Citation Analysis (0)] |
| 7. | Ahmadieh H, Behbahani S, Safi S. Continuous wavelet transform analysis of ERG in patients with diabetic retinopathy. Doc Ophthalmol. 2021;142:305-314. [RCA] [PubMed] [DOI] [Full Text] [Cited by in Crossref: 5] [Cited by in RCA: 11] [Article Influence: 2.2] [Reference Citation Analysis (0)] |
| 8. | Meintjes A, Lowe A, Legget M. Fundamental heart sound classification using the continuous wavelet transform and convolutional neural networks. Annu Int Conf IEEE Eng Med Biol Soc. 2018;409-412. [RCA] [PubMed] [DOI] [Full Text] [Cited by in Crossref: 18] [Cited by in RCA: 13] [Article Influence: 1.9] [Reference Citation Analysis (0)] |
| 9. | Sugiki H, Sugiki K. The scalographic pattern of Morlet continuous wavelet transform can differentiate bileaflet valve function. J Artif Organs. 2018;21:308-316. [RCA] [PubMed] [DOI] [Full Text] [Reference Citation Analysis (0)] |
| 10. | Merino S, Romero SE, Gonzalez EA, Castaneda B. Shear wave speed estimator using continuous wavelet transform for crawling wave sonoelastography. Annu Int Conf IEEE Eng Med Biol Soc. 2021;3994-3997. [RCA] [PubMed] [DOI] [Full Text] [Reference Citation Analysis (0)] |
| 11. | Kimata A, Yokoyama Y, Aita S, Nakamura H, Higuchi K, Tanaka Y, Nogami A, Hirao K, Aonuma K. Temporally stable frequency mapping using continuous wavelet transform analysis in patients with persistent atrial fibrillation. J Cardiovasc Electrophysiol. 2018;29:514-522. [RCA] [PubMed] [DOI] [Full Text] [Cited by in Crossref: 13] [Cited by in RCA: 15] [Article Influence: 2.1] [Reference Citation Analysis (0)] |
| 12. | Biscay CF, Arini PD, Soler AIR, Bonomini MP. Classification of ischemic and non-ischemic cardiac events in Holter recordings based on the continuous wavelet transform. Med Biol Eng Comput. 2020;58:1069-1078. [RCA] [PubMed] [DOI] [Full Text] [Reference Citation Analysis (0)] |
| 13. | Wachowiak MP, Moggridge JJ, Wachowiak-Smolíková R. Clustering continuous wavelet transform characteristics of heart rate variability through unsupervised learning. Annu Int Conf IEEE Eng Med Biol Soc. 2019;4584-4587. [RCA] [PubMed] [DOI] [Full Text] [Cited by in Crossref: 1] [Cited by in RCA: 1] [Article Influence: 0.2] [Reference Citation Analysis (0)] |
| 14. | Wu Z, Feng X, Yang C. A Deep Learning Method to Detect Atrial Fibrillation Based on Continuous Wavelet Transform. Annu Int Conf IEEE Eng Med Biol Soc. 2019;1908-1912. [RCA] [PubMed] [DOI] [Full Text] [Cited by in Crossref: 4] [Cited by in RCA: 9] [Article Influence: 1.8] [Reference Citation Analysis (0)] |
| 15. | Morlet J, Arens G, Fourgeau E, Giard D. Wave propagation and sampling theory-Part I: Complex signal and scattering in multilayered media. Geophysics. 1982;47:203-221. [DOI] [Full Text] |
| 16. | Morlet J, Arens G, Fourgeau E, Giard D. Wave propagation and sampling theory-Part II: Sampling theory and complex waves. Geophysics. 1982;47:222-236. [DOI] [Full Text] |
| 17. | Mallat S. A wavelet tour of signal processing. 2nd ed. California: Elsevier, 1998. |
| 18. | Kanda Y. Investigation of the freely available easy-to-use software 'EZR' for medical statistics. Bone Marrow Transplant. 2013;48:452-458. [RCA] [PubMed] [DOI] [Full Text] [Full Text (PDF)] [Cited by in Crossref: 9275] [Cited by in RCA: 13232] [Article Influence: 1102.7] [Reference Citation Analysis (0)] |
| 19. | Kuenen JC, Borg R, Kuik DJ, Zheng H, Schoenfeld D, Diamant M, Nathan DM, Heine RJ; ADAG Study Group. Does glucose variability influence the relationship between mean plasma glucose and HbA1c levels in type 1 and type 2 diabetic patients? Diabetes Care. 2011;34:1843-1847. [RCA] [PubMed] [DOI] [Full Text] [Full Text (PDF)] [Cited by in Crossref: 66] [Cited by in RCA: 58] [Article Influence: 4.1] [Reference Citation Analysis (0)] |
| 20. | Yapanis M, James S, Craig ME, O'Neal D, Ekinci EI. Complications of diabetes and metrics of glycemic management derived from continuous glucose monitoring. J Clin Endocrinol Metab. 2022;107:e2221-e2236. [RCA] [PubMed] [DOI] [Full Text] [Cited by in Crossref: 15] [Cited by in RCA: 132] [Article Influence: 44.0] [Reference Citation Analysis (0)] |