Published online Aug 15, 2021. doi: 10.4239/wjd.v12.i8.1267
Peer-review started: December 18, 2020
First decision: May 3, 2021
Revised: May 15, 2021
Accepted: June 25, 2021
Article in press: June 25, 2021
Published online: August 15, 2021
Processing time: 233 Days and 5.2 Hours
Decabromodiphenyl ether (BDE-209) is the most commonly used brominated flame retardant. Recently, BDE-209 has been suspected of being an environmental risk factor for metabolic diseases such as obesity, insulin resistance (IR), type 2 diabetes mellitus, and hypertension.
To investigate the effects of BDE-209 on IR and glucose and lipid metabolism in C57BL/6 mice.
Adult male C57BL/6 mice were randomly divided into high, medium-high, medium, medium-low, and low dose BDE-209 groups, and a control group (n = 6 per group), which received 1000, 800, 600, 450, 300, and 0 mg/kg BDE-209, respectively. After BDE-209 exposure for 60 d, the mice were fasted overnight, and then sacrificed to obtain tissues. An automatic biochemical analyzer was used to detect serum triglyceride (TG), total cholesterol (TC), low-density lipoprotein cholesterol (LDL-C), and high density lipoprotein cholesterol (HDL-C); enzyme-linked immunosorbent assay kits were used to detect fasting serum insulin (FINS), leptin (LEP), and adiponectin (Adp) levels; a blood glucose meter was used to detect fasting blood glucose (FBG). Morphological changes of the liver were observed by hematoxylin and eosin staining. Real-time quantitative polymerase chain reaction and Western blot were used to determine the messenger ribonucleic acid (mRNA) and protein levels, respectively, of LEP, Adp, and peroxisome proliferators activated receptor-γ (PPARγ) in mouse liver and adipose tissues.
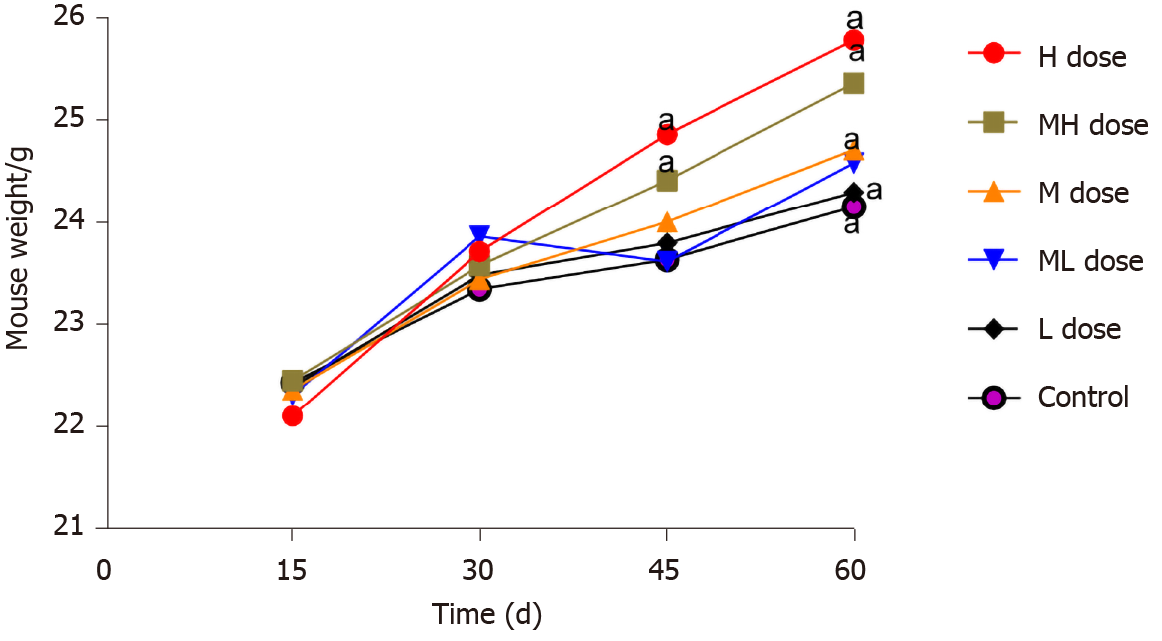
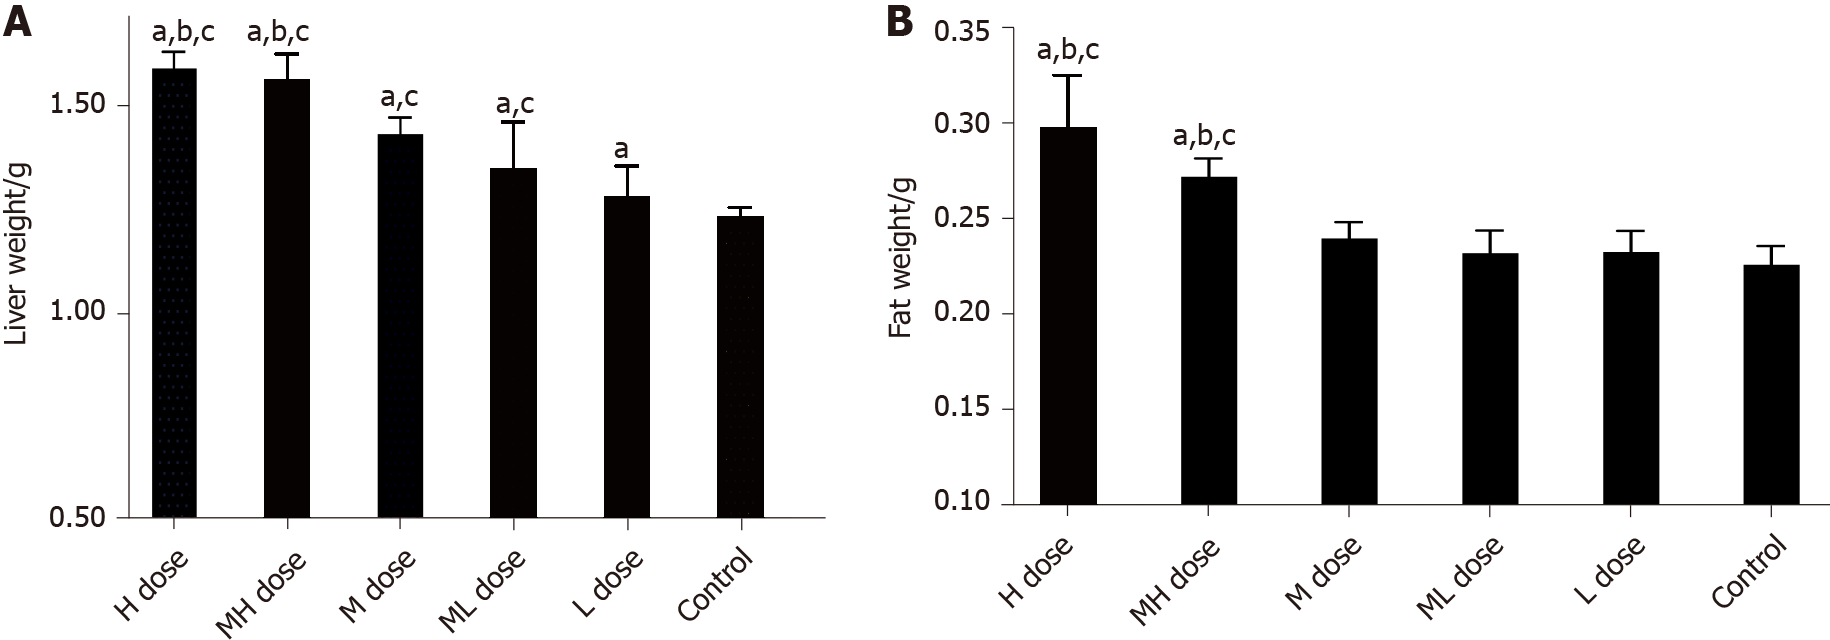
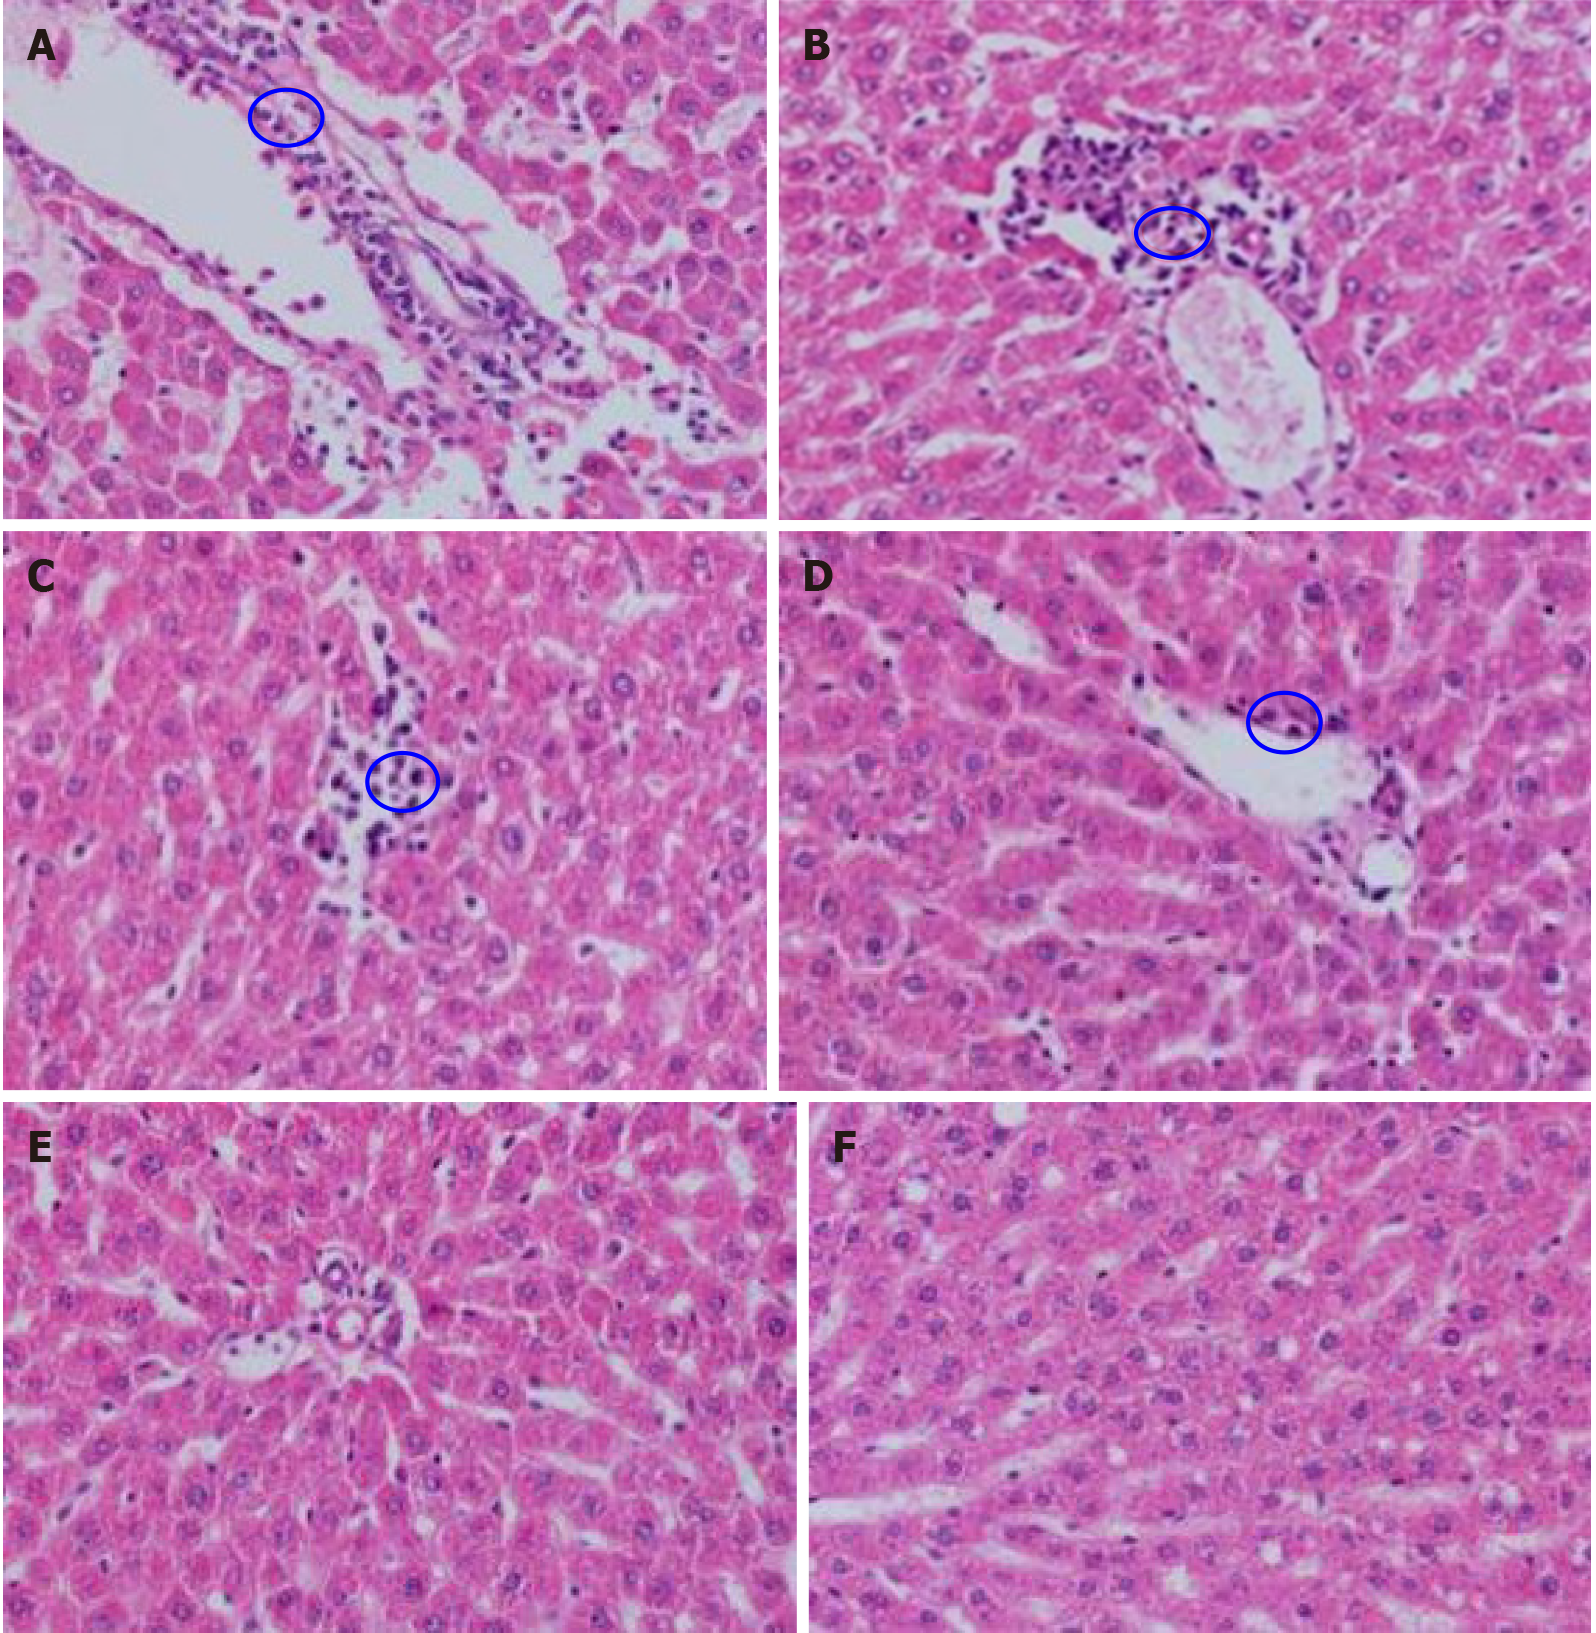
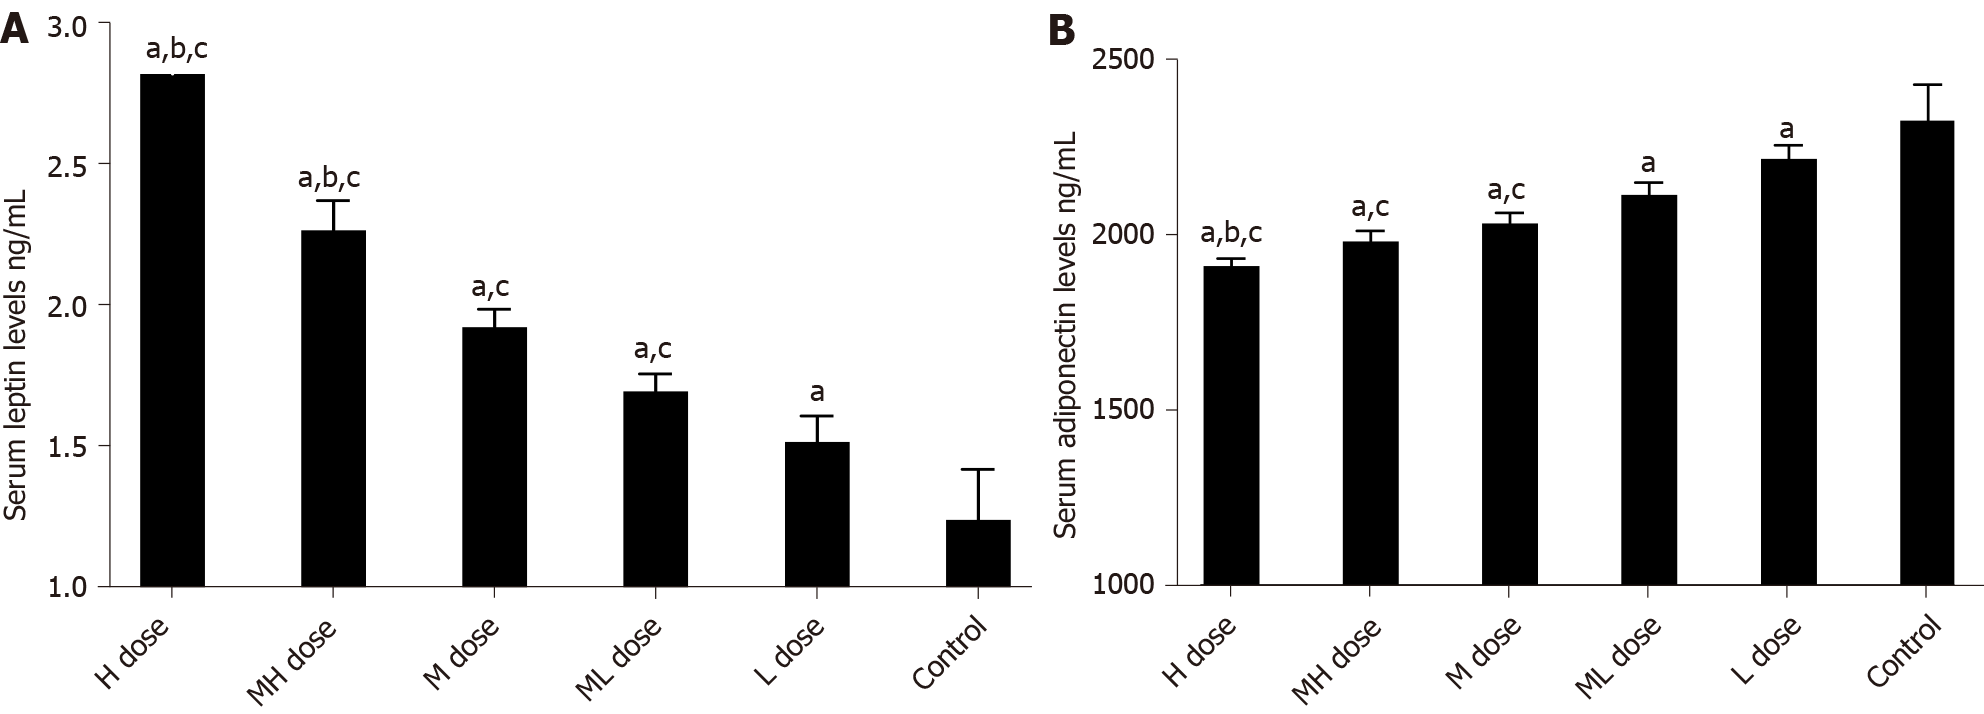
There was a statistically significant difference in the weight of mice in each group after 45 and 60 d of exposure (P < 0.05). After 60 d of exposure, the weight of liver and adipose tissues in the exposure groups were greater than that of the control group (P < 0.05). The liver tissue structure was disordered and the liver tissues were accompanied by local inflammatory cell infiltration in the high, medium-high, and medium dose BDE-209 groups. The levels of FINS, insulin sensitivity index, Adp, and HDL-C were decreased in the BDE-209 group compared with the control group, as were the mRNA and protein levels of Adp in liver and adipose tissues (P < 0.05). Serum level of FBG and LEP were higher in the BDE-209 group than in controls. TC, TG, and LDL-C levels as well as the mRNA and protein expression of LEP and PPARγ in liver and adipose tissues were higher than those in the control group (P < 0.05). Homeostatic assessment model of IR was higher in the medium and medium-low dose BDE-209 groups (P < 0.05).
BDE-209 increases the body weight, fat and liver tissue weight, TC, TG, and LDL-C, reduces HDL-C, and causes IR in mice, which may be related to activating the PPARγ receptor.
Core Tip: Decabromodiphenyl ether (BDE-209) may be an environmental risk factor leading to obesity. There are limited literature reports on the correlation between BDE-209 and obesity. This type of research began with animal experiments, and the results showed that BDE-209 affects animal body weight, but the direction of the effect is not consistent. This study found that BDE-209 increased the body weight and body fat and liver tissue weight in mice, which may be related to the activation of peroxisome proliferators activated receptor-γ receptor and the abnormal differentiation of adipocytes. In obese patients, proinflammatory cytokines and interleukin-6 can cause insulin resistance through a variety of mechanisms.
- Citation: Alimu A, Abudureman H, Wang YZ, Li MY, Wang JS, Liu ZL. Decabromodiphenyl ether causes insulin resistance and glucose and lipid metabolism disorders in mice. World J Diabetes 2021; 12(8): 1267-1281
- URL: https://www.wjgnet.com/1948-9358/full/v12/i8/1267.htm
- DOI: https://dx.doi.org/10.4239/wjd.v12.i8.1267
Glucose and lipid metabolism disorders are hallmark metabolic changes in obese people. Studies have shown that children with different degrees of obesity have different degrees of glucose and lipid metabolism disorders. In these cases, as the degree of obesity increases, glucose and lipid metabolism disorders become more aggravated[1]. Insulin resistance (IR) refers to a decrease in the body's sensitivity to insulin, a decrease in the ability of insulin to lower blood sugar, and an obstacle to the use of glucose by tissues[2]. Obesity and IR are the central link of metabolic syndrome. As the body's sensitivity to insulin is reduced, the ability of insulin to lower blood sugar is reduced, and tissues have impaired glucose utilization[3]. Type 2 diabetes mellitus (T2DM) usually results from IR and secretion imbalance. Studies have found that adipocytokines play an important role in the occurrence and development of T2DM by participating in glucose and lipid metabolism[4].
Adipocytokines are the biologically active substances produced by fat cells. Leptin (LEP) is an adipokine that can reduce appetite, increase energy expenditure, increase sympathetic nerve activity, promote glucose utilization, and improve insulin sensitivity under normal physiological conditions[3]. The role of LEP as a biomarker of metabolic syndrome has been studied in different populations[5]. Elevated LEP levels are associated with metabolic syndrome because LEP is associated with obesity, IR, myocardial infarction, and congestive heart failure[6]. Like LEP, adiponectin (Adp) is a fat-derived plasma protein with a wide ranging effects. Adp has many functions, including anti-atherosclerosis, insulin sensitization, enhanced lipid oxidation, and vasodilation[7]. Peroxisome proliferators activated receptor-γ (PPARγ) is the main regulator of adipocyte differentiation. PPARγ regulates fat formation, controls lipid metabolism, and can reduce Adp expression in fat cells in obesity[8,9].
Decabromodiphenyl ether (BDE-209) is the most commonly used brominated flame retardant. Recently, BDE-209 has been suspected of being an environmental risk factor for metabolic diseases such as obesity, IR, T2DM, and hypertension[10,11]. Data suggest that it may play a key role in the occurrence, development, and treatment of these diseases. The underlying mechanism may be that BDE-209 inappropriately regulates the number and volume of adipocytes at the molecular level, leading to adipogenesis and lipid metabolism disorders. These changes further alter the function of metabolic disease related factors, leading to disease occurrence[12]. Therefore, this study used an animal model to explore the effects of BDE-209 on IR and glucose and lipid metabolism disorders in C57BL/6 mice, and to preliminarily explore the underlying mechanism.
Thirty-six healthy specified pathogen free C57BL/6 male mice (weight: 20 ± 2 g) were purchased from the Experimental Animal Center of Xinjiang Medical University [Experimental animal use license number: SYXX (new) 2020-0001]. Our animal research protocol was evaluated and approved by the Ethics Review Committee of the First Affiliated Hospital of Xinjiang Medical University (No. 20170214-107).
Thirty-six healthy male C57BL/6 mice were bred adaptively for 1 wk, during which they had free access to food and water, at 23 ± 2°C, a relative humidity of 55% ± 5%, and an illumination time of 12 h/d. The mice were then randomly divided according to their weights into a control group (corn oil) and five BDE-209 dose groups: low, medium-low, medium, medium-high, and high, which were given 300, 450, 600, 800, and 1000 mg/kg BW daily. The mice were dosed at 0.1 mL/10 g for 2 wk with one day off for 60 d.
The following reagents were used in this study: BDE-209 (98% purity; Yuanye Chemical Co., Ltd., Shanghai, China); blood glucose test paper (Bayer, Leverkusen, Germany); mouse fasting insulin (FINS), LEP, and Adp enzyme-linked immunosorbent assay (ELISA) kits (Jianglai Biotechnology Company, Shanghai, China); RevertAid First Strand complementary deoxyribonucleic acid Synthesis Kit (Thermo Fisher Scientific, Waltham, MA, United States); QuantiNova SYBR Green polymerase chain (PCR) reaction Kit (Qijie Enterprise Management Co., Ltd., Shanghai, China); LEP, Adp, PPARγ, and β-actin primers (Shenggong Technology Company, Shanghai, China); sodium dodecyl sulfate polyacrylamide gel electrophoresis (SDS-PAGE) gel preparation kit, high efficiency radioimmunoprecipitation assay (RIPA) lysis solution, and protein quantification kit (Solarbio, Beijing, China); and rabbit anti-LEP, anti-Adp, and anti-PPARγ polyclonal antibodies (Ab-cam, Cambridge, United Kingdom).
The following equipment was used in this study: AB135-S standard analytical balance (Mettler-Toledo, Ltd., Columbus, OH, United States), ACCU-CHEK blood glucose meter (Roche, Basel, Switzerland), automatic biochemical analyzer (Rebenrily), microplate reader (Bio-RAD Laboratories, Hercules, CA, United States), real-time quantitative PCR (RT-qPCR) instrument (Thermo Fisher Scientific), Gel Doc XR gel imager (Bio-RAD Laboratories), Nano Drop 1000 nucleic acid quantifier (Thermo Fisher Scientific), vortex mixer (Qilin Bell Company, Jiangsu, China), and a tissue slicer (Thermo Fisher Scientific).
The mouse eyeballs were taken off to collect blood in an EP tube. A cotton swab was used to gently wipe the blood on the wall of the EP tube (to avoid clotting of the closed blood and fall into the blood when rubbing). The EP tube was left at room temperature for 30 min and then centrifuged at 4 °C at 3000 rpm for 15 min to separate the serum, which was subsequently stored at -80 °C until further analysis. The animals were dissected quickly in a sterile environment, and the mesangium was slowly peeled off with tissue scissors and tweezers. The mouse liver and adipose tissue were completely separated. Cryopreservation tubes were numbered, and the tissues were put into corresponding cryopreservation tubes, and stored at -80 °C until further analysis.
A small piece of liver was fixed overnight in 4% formalin solution. After being taken out the next day, it was subjected to gradient dehydration and paraffin embedding to make a 3 um pathological section. After the section was stained, the liver tissue changes were observed under an optical microscope.
ELISA kits were used according to the manufacturer’s instructions to detect murine insulin, LEP, and Adp contents. An automatic biochemical analyzer was used to detect serum levels of TC, TG, low-density lipoprotein cholesterol (LDL-C), and high density lipoprotein cholesterol (HDL-C). Finally, we calculated the homeostatic assessment model of insulin resistance (HOMA-IR) and the insulin sensitivity index (ISI) as follows[13]:
HOMA-IR = Fasting blood glucose (FBG) × FINS/22.5; ISI = In[1/(FBG × FINS)].
The mRNA levels of Adp and PPARγ were measured by RT-qPCR. Briefly, the tissue was ground in liquid nitrogen, and then 20–50 mg of tissue was added to 1 mL of TRIzol for RNA extraction. Reverse transcription was performed immediately after RNA isolation using the following conditions: 42 °C for 60 min, 72 °C for 5 min, and then the reaction was terminated. PCR parameters were as follows: 94 °C for 30 s, 94 °C for 5 s, and 60 °C for 20 s for 40 cycles. Primer 5 program was used to design primer sequences, all primers were synthesized by Shanghai Bioengineering Co., Ltd. (Shanghai, China) (Table 1). β-actin was used as the reference gene, and the 2(-ΔΔCT) method was used to analyze the relative expression level of PCR-amplified products.
| Gene | Primer sequences (5'→3') | Length/bp |
| PPARγ | F-CTCCAAGAATACCAAAGTGCGA | 104 |
| R-GCCTGATGCTTTATCCCCACA | ||
| Adiponectin | F-ATCTGGAGGTGGGAGACCAA | 144 |
| R-GGGCATTGGGTAGTTGCAGT | ||
| β-actin | F-AGAGGGAAATCGTGCGTGACATCAAAGAG | 196 |
| R-GATGCCACAGGATTCCATACCCAAGAAGG | ||
| Leptin | F: AGAGTGACAGGAAGTGCTGAGAGG | 106 |
| R: TCTGACACCAGCCACCACGAG |
RIPA lysis buffer containing protease inhibitors was added to 20–50 mg of mouse tissue, which was then ground in an ice bath until fully lysed. After homogenization, the mixture was centrifuged at 12000 rpm for 15 min at 4 °C. The supernatant was then isolated and quantified with the BCA protein quantification kit. Proteins were denatured at 100 °C for 10 min prior to performing SDS-PAGE. The proteins were then transferred to a membrane, which was blocked in skimmed milk, incubated with primary antibodies, washed, and incubated with secondary antibodies. The membrane was then treated with chemiluminescence reagents and exposed to film to reveal immunoreactive bands. Intensity values of target proteins were then normalized to the intensity value of the internal reference to analyze target protein expression.
Statistic Package for Social Science 21.0 software (International Business Machine Corp., Armonk, NY, United States) was used for statistical analyses. Quantitative data following a normal distribution are expressed as the mean ± SD. Data that had a homogeneity of variance were compared by analysis of variance between multiple groups, followed by pairwise comparisons. According to the least significant difference test, P < 0.05 was considered statistically significant. Bar and line graphs were generated using GraphPad Prism 8.0 (GraphPad Software, Inc., San Diego, CA, United States).
During the exposure period, the growth and development of mice in all groups were normal, and their weights increased. There were no significant differences in the body weight of mice in any group on days 15 or 30 (P > 0.05). However, the weights of mice in the BDE-209 high and medium-high groups were significantly increased on days 45 and 60 compared with those of the other groups (P < 0.05). Except for the low dose group, the liver weights of mice in the exposure groups were significantly greater than that of the control group (P < 0.05). The fat weights of mice in the high and medium-high groups were greater than those in the control and low dose groups (P < 0.05). The liver and fat weights of mice in the high and medium-high BDE-209 groups were greater than those in the medium dose group (P < 0.05) (Figures 1 and 2).
Macroscopic observation showed that the liver of the control group was bright red in color with a smooth surface, while the liver of the treated groups was gray-red in color with a smooth surface. Observation under the microscope showed that the liver structure of the control group was clear, the liver sinusoids and hepatocyte cords were regular, the size of liver cells was normal, and there was no interstitial proliferation or inflammatory cell infiltration; the liver tissue structure of the treated groups was disordered, and the liver sinusoids and hepatocytes were irregular. And the liver tissues of the high, medium-high, and medium dose groups were accompanied by local inflammatory cell infiltration (Figure 3).
We detected serum levels of factors related to glucose metabolism and adipocytokines. Serum levels of FINS, ISI, and Adp in the BDE-209 exposure groups were lower than those of the control group (P < 0.05). FBG and LEP levels were higher in the BDE-209 exposure groups than in controls (P < 0.05). HOMA-IR was also higher in the medium and medium-low dose BDE-209 groups compared with the control group (P < 0.05); however, there was no statistical difference in HOMA-IR between the medium-high and high dose BDE-209groups (P > 0.05). Levels of FINS, ISI, and Adp were lower in all other BDE-209 groups compared with the lowest dose group (P < 0.05); conversely, FBG and LEP levels were higher in all other BDE-209 groups compared with the low dose group (P < 0.05) (Table 2, Figure 4)
| Group | FINS (mIU/L) | ISI | HOMA-IR | FBG |
| High dose | 20.91 ± 0.96a,b,c | 0.78 ± 0.13a,b,c | 8.38 ± 0.44a | 8.85 ± 0.35a,b,c |
| Medium-high dose | 21.71 ± 0.56a,b,c | 0.94 ± 0.11a,b,c | 8.28 ± 0.37a | 8.58 ± 0.32a,b,c |
| Medium dose | 23.87 ± 0.46a,c | 1.05 ± 0.32a,c | 8.15 ± 0.43a | 7.81 ± 0.49a |
| Medium-low dose | 24.89 ± 0.27a,c | 1.08 ± 0.11a,c | 7.76 ± 0.53 | 7.02 ± 0.44 |
| Low dose | 26.02 ± 0.84a | 1.41 ± 0.21 | 7.56 ± 0.61 | 6.53 ± 0.39 |
| Control | 27.37 ± 0.28 | 1.57 ± 0.08 | 7.57 ± 0.65 | 6.52 ± 0.68 |
| F value | 61.06 | 2.968 | 2.719 | 28.574 |
| P value | 0.001 | 0.027 | 0.038 | 0.001 |
Levels of blood lipids, TC, TG, and LDL were higher in all BDE-209 groups compared with the control group (P < 0.05), and the high dose BDE-209 group had higher levels than the medium and medium-low dose groups (P < 0.05). The serum HDL-C contents of BDE-209 treated groups were lower than that of the control group (P < 0.05) (Table 3).
| Group | TC | TG | LDL-C | HDL-C |
| High dose | 5.29 ± 1.20a,b,c | 1.46 ± 0.36a,b,c | 2.44 ± 0.21a,b,c | 1.33 ± 0.12a,b,c |
| Medium-high dose | 4.64 ± 0.49a | 1.12 ± 0.11a | 2.14 ± 0.29a,c | 1.51 ± 0.12a,c |
| Medium dose | 3.67 ± 0.49a | 0.97 ± 0.14a | 1.95 ± 0.49a,c | 1.53 ± 0.17a |
| Medium-low dose | 3.48 ± 0.64a | 0.92 ± 0.18a | 1.78 ± 0.34a | 1.72 ± 0.10a |
| Low dose | 3.36 ± 1.11a | 0.91 ± 0.06a | 1.70 ± 0.15a | 1.73 ± 0.10a |
| Control | 2.95 ± 1.35 | 0.75 ± 0.07 | 1.27 ± 0.15 | 1.95 ± 0.10 |
| F value | 5.38 | 10.32 | 13.3 | 17.44 |
| P value | 0.002 | 0.001 | 0.001 | 0.001 |
Adp mRNA levels were higher in the BDE-209 groups than in the control group (P < 0.05), and Adp mRNA expression in the high and medium-high dose groups were lower than that of the low dose group (P < 0.05). LEP mRNA expression was increased in the high and medium-high dose groups compared with the medium, medium-low, low dose groups and the control group (P < 0.05). There was no significant difference in LEP mRNA expression in the medium, medium-low, and low dose groups compared with the control group (P > 0.05). LEP mRNA expression was higher in the high, medium-high, and medium dose groups than in the control group (P < 0.05); LEP mRNA expression was not significantly different between the medium-low and low dose groups and the control group (P > 0.05) (Table 4).
| Group | n | Adp | LEP | PPARγ |
| High dose | 6 | 1.85 ± 0.25a,c | 3.27 ± 0.80a,b,c | 2.96 ± 0.98a |
| Medium-high dose | 6 | 2.25 ± 0.37a,c | 2.61 ± 0.62a,b,c | 2.93 ± 0.95a |
| Medium dose | 6 | 2.63 ± 0.41a | 1.58 ± 0.48 | 2.56 ± 1.18a |
| Medium-low dose | 6 | 3.24 ± 0.99a | 1.47 ± 0.59 | 1.68 ± 0.71 |
| Low dose | 6 | 3.38 ± 0.89a | 1.09 ± 0.57 | 1.71 ± 0.24 |
| Control | 6 | 1.00 ± 0.00 | 1.00 ± 0.00 | 1.00 ± 0.00 |
| F value | 13.38 | 15.16 | 5.61 | |
| P value | 0.001 | 0.001 | 0.001 |
Adp mRNA levels were not significantly different in the high, medium-high, and medium dose groups compared with the control group (P > 0.05); Adp mRNA levels were increased in the medium-low and low dose groups compared with the control group (P > 0.05). Adp mRNA levels were decreased in the high, medium-high, and medium dose groups compared with the low dose group (P < 0.05). LEP mRNA levels were higher in the high and medium-high dose groups than in the low dose and control groups (P < 0.05). LEP mRNA expression was not significantly different in the medium, medium-low, and low dose groups compared with the control group (P > 0.05). The high, medium-high, and medium dose groups showed higher PPARγ mRNA expression than the low dose and control groups (P < 0.05) (Table 5).
| Group | n | Adp | LEP | PPARγ |
| High dose | 6 | 0.97 ± 0.16b,c | 3.12 ± 1.86a,b,c | 1.39 ± 0.31a,c |
| Medium-high dose | 6 | 1.27 ± 0.34c | 2.35 ± 1.08a,c | 1.35 ± 0.21a,c |
| Medium dose | 6 | 1.24 ± 0.32c | 1.59 ± 1.19 | 1.17 ± 0.34a,c |
| Medium-low dose | 6 | 1.52 ± 0.54a | 1.35 ± 0.76 | 0.90 ± 0.20 |
| Low dose | 6 | 1.61 ± 0.43a | 1.32 ± 0.46 | 0.72 ± 0.10 |
| Control | 6 | 1.00 ± 0.00 | 1.00 ± 0.00 | 1.00 ± 0.20 |
| F value | 3.36 | 3.35 | 7.85 | |
| P value | 0.016 | 0.016 | 0.001 |
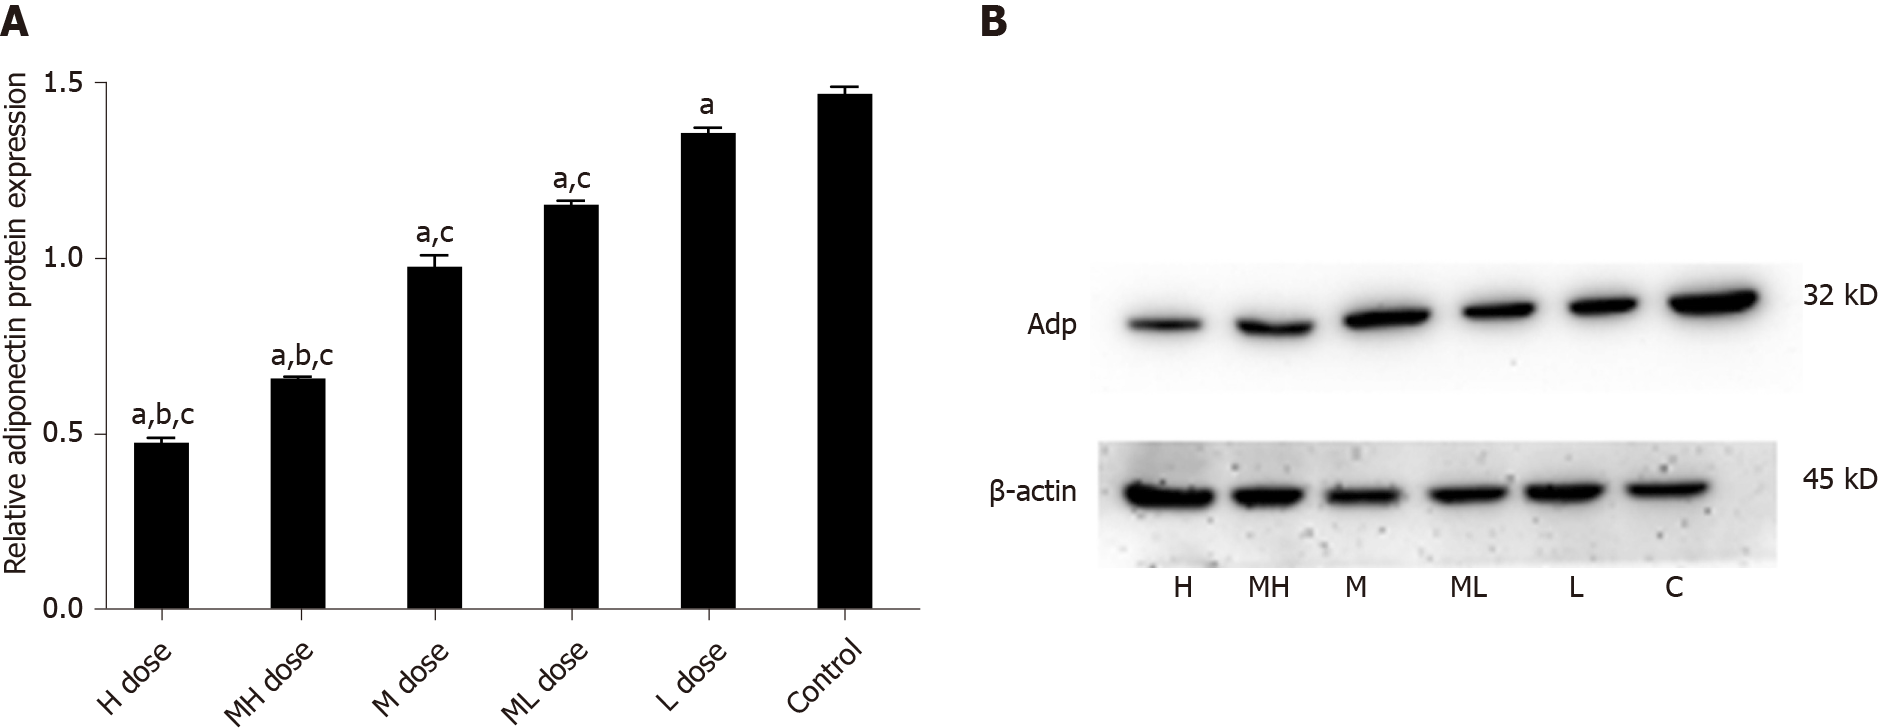
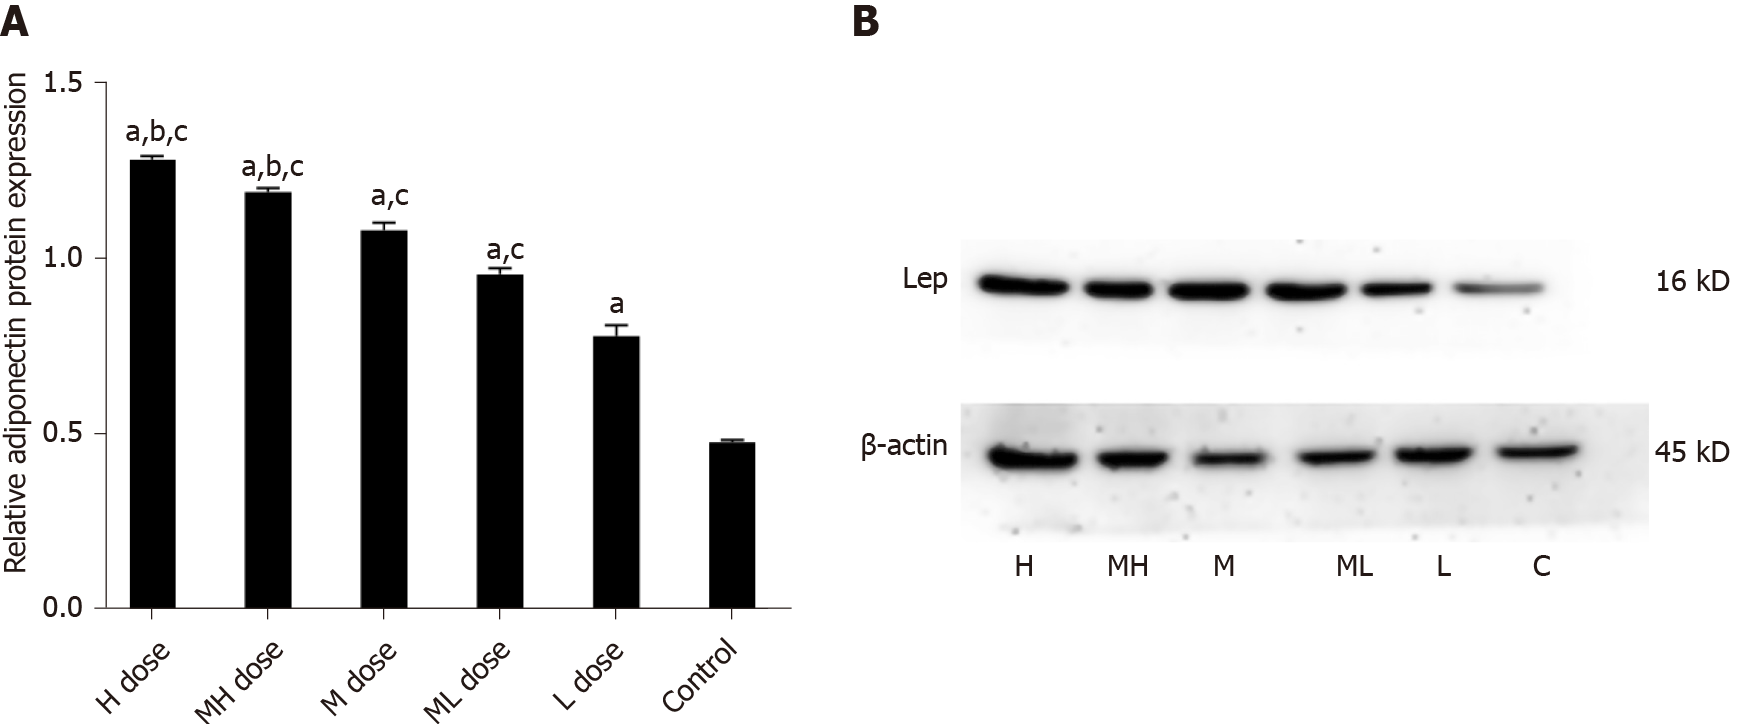
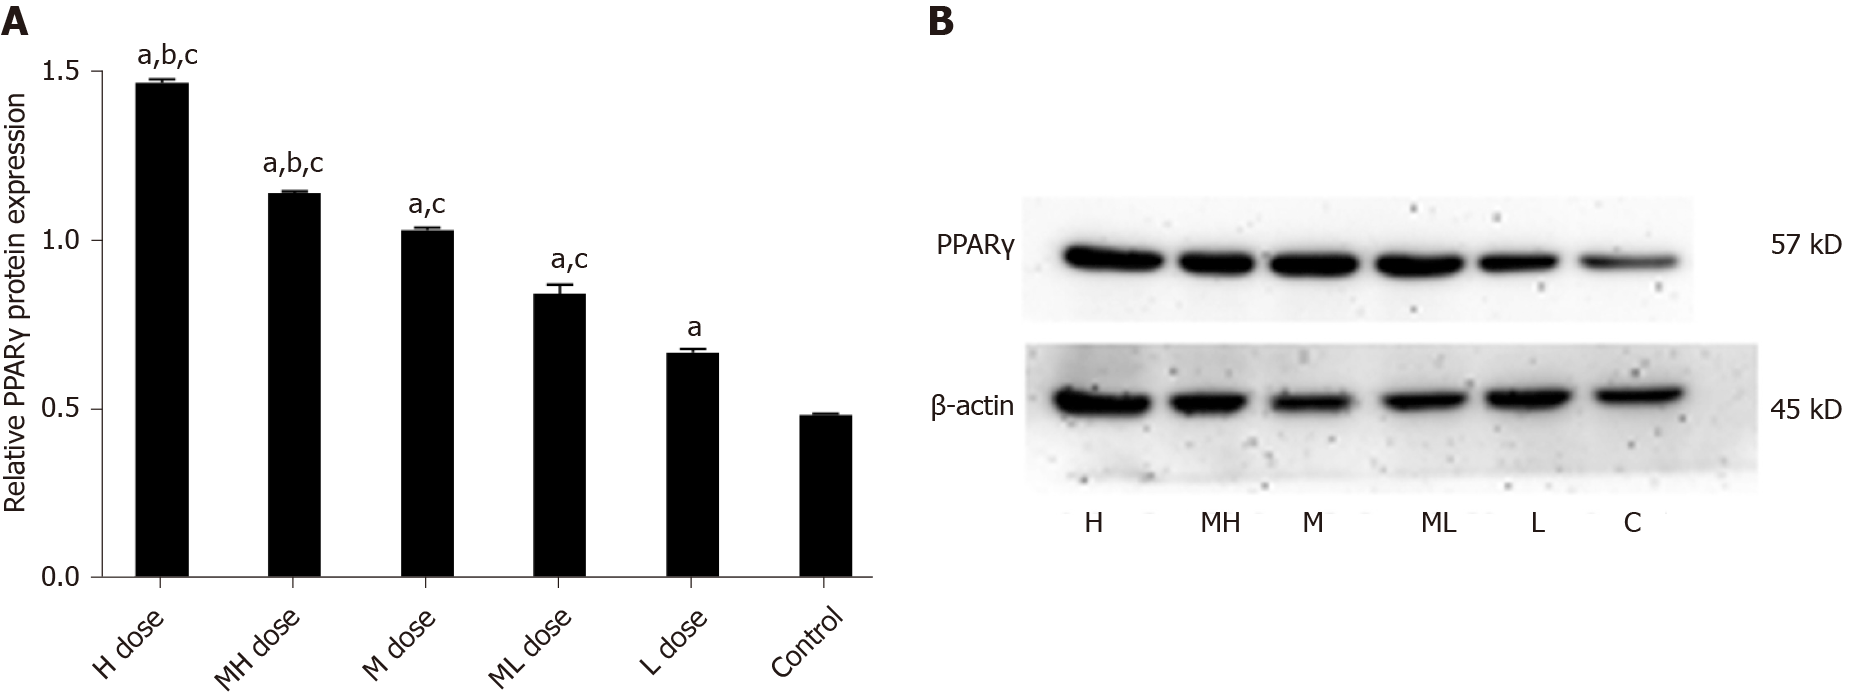
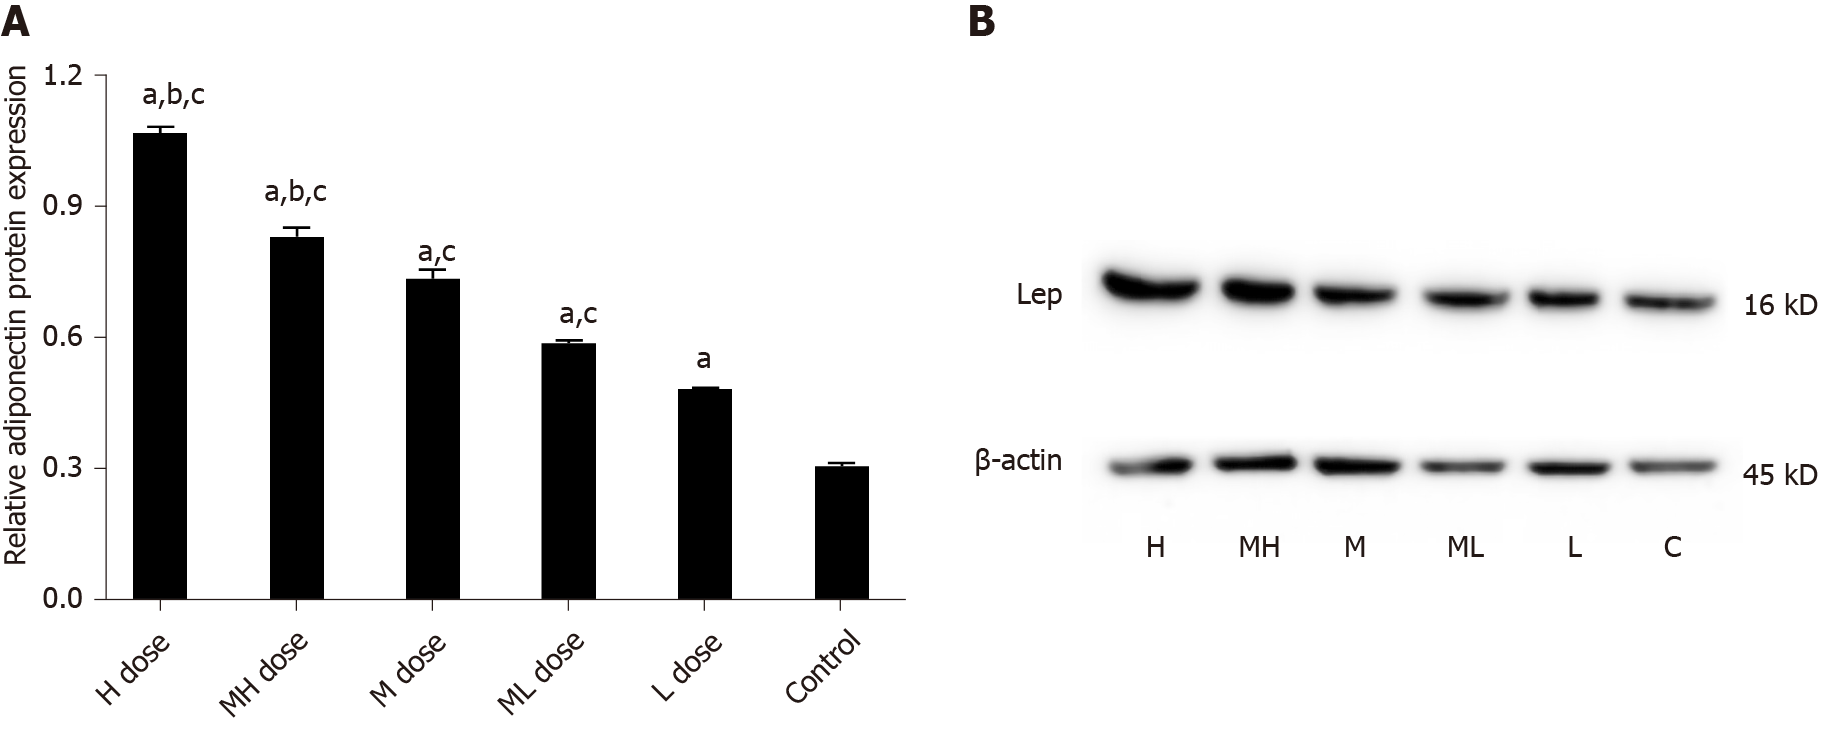
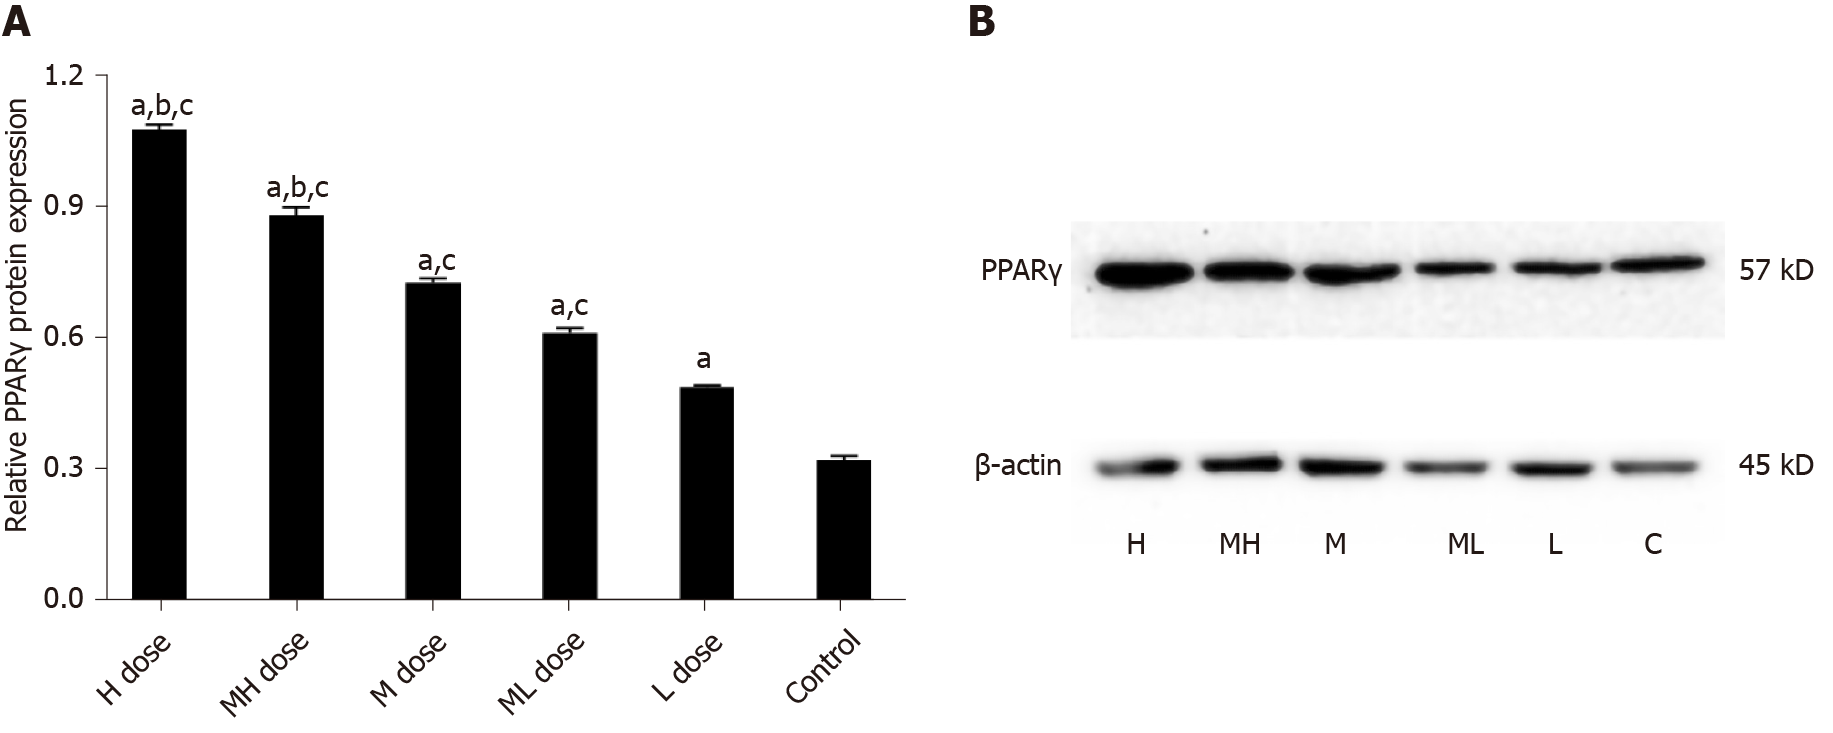
The gray values of Adp protein in the high and medium-high groups were lower than those in the medium and low dose groups and the control group (P < 0.05). The gray values of Adp protein in the medium and medium-low groups were lower than those in the low dose and control groups (P < 0.05). The gray values of LEP protein were higher in the high and medium-high dose groups than in the medium and low dose groups and the control group (P < 0.05). The gray values of LEP protein in the medium and medium-low dose groups were higher than those of the low dose and control groups (P < 0.05). The gray values of PPARγ protein were higher in the high and medium-high groups than in the medium and low dose groups and the control group (P < 0.05). The gray values of PPARγ protein in the low and medium-low dose groups were higher than that in the control group (P < 0.05) (Figures 5-7).
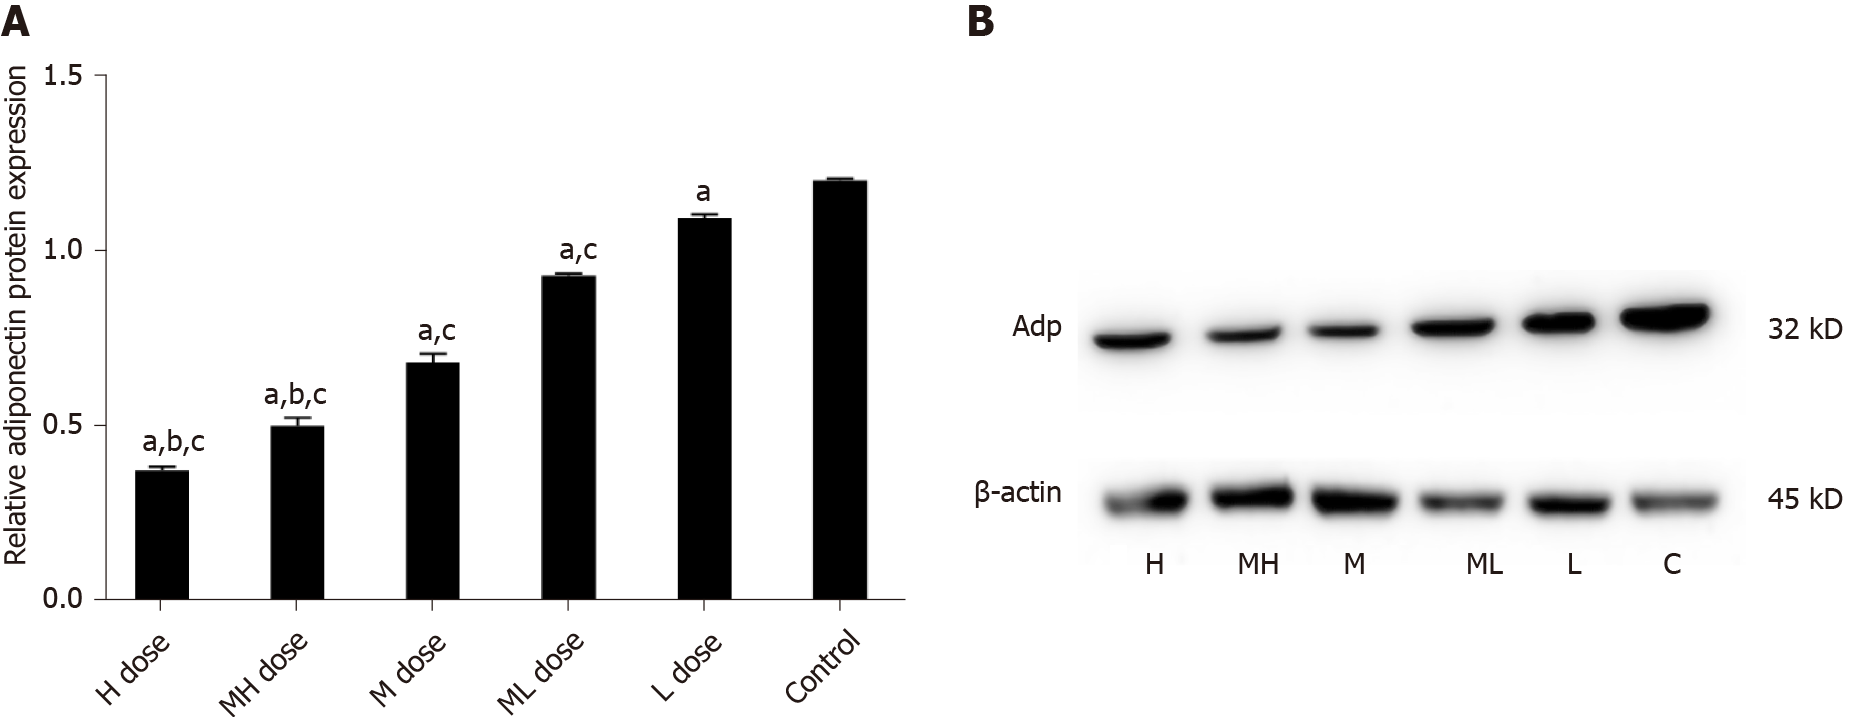
The gray values of Adp protein were lower in the high and medium-high groups compared with the medium and low dose groups and the control group (P < 0.05); the gray values of Adp protein in the medium and medium-low dose groups were lower than those in the low dose and control groups (P < 0.05). The gray values of LEP protein were higher in the high and medium-high dose groups than in the medium and low dose groups and the control group (P < 0.05). The gray values of LEP protein in the medium and medium-low dose groups were higher than those in the low dose and control groups (P < 0.05). The gray values of PPARγ protein in the high and medium-high dose groups were higher than those in the middle and low dose groups and the control group (P < 0.05). The gray values of PPARγ protein were higher in the low and medium-low dose groups compared with the control group (P < 0.05) (Figures 8-10).
The results of this study showed that obesity indicators, including body weight and abdominal fat weight, were significantly higher in mice exposed to BDE-209 than in control mice. Mice exposed to high doses of BDE-209 for a long period of time had the highest concentrations of BDE-209 in fat and fat-soluble tissues. At the molecular level, BDE-209 swelled fat cells, which eventually led to increased volume of fat tissue. The liver is the main place for metabolism in heterologous organisms, and polybrominated diphenyl ether has been proven to be biotransformed into long-lasting biologically-active metabolites in animals. BDE-209 is decomposed into longer-lasting low molecular weight polybrominated diphenyl ethers (PBDEs) through photolysis and microbial decomposition. These processes have a great impact on bioaccumulation and toxicity[14].
This study shows that BDE-209 disrupts liver tissue structure, with irregular liver sinusoids and liver cells, accompanied by local inflammatory cell infiltration. The liver is the main site for the metabolism of heterologous organisms, and PBDEs have been proven to be biotransformed into long-lasting biologically active metabolites in animals[15]. Studies have found that exposure to persistent organic pollutants can damage the function of mitochondria and reduce their oxidative phosphorylation, leading to endocrine disorders, increasing inflammatory factors interleukin-6 and 8, and resulting in chronic low-grade inflammation and IR. The liver is not only an important organ for fat synthesis, but also the main site for fatty acid beta oxidation. Increasing the level of lipid metabolism in the liver and improving the efficiency of lipid metabolism are of great significance for maintaining the normal lipid metabolism function of the liver and the body. Free fatty acids can act as ligands for the Toll-like receptor 4 complex[16] and stimulate macrophages, leading to the infiltration of inflammatory cells in the liver tissue of the high-dose group.
Serum levels of TG, TC, and LDL were higher in mice exposed to BDE-209 than in the control group, and HDL levels were lower than those in the untreated group, indicating that BDE-209 disrupted lipid metabolism, increased TG, TC, and LDL-C contents, and reduced HDL-C. LDL-C and HDL-C are important lipid components in the body. LDL-C promotes the transport and deposition of cholesterol from the liver to the periphery, while HDL-C promotes the transport of cholesterol from the periphery to the liver and makes clear cholesterol in the liver[17]. Because BDE-209 disturbs liver tissue structure during these metabolic processes, LDL-C and HDL-C cannot function normally, causing the serum LDL-C content to increase and HDL-C to decrease. Under the action of lipoprotein lipase, PPAR-γ adjusts the glucose content, altering the final synthesis of TG by regulating 3-phosphate glycerol[18]. Therefore, PPAR-γ plays an important role in the final synthesis of TG.
Several epidemiological investigations have shown that long-term exposure to low concentrations of persistent organic pollutants increases the risk of glucose metabolism and IR[19]. The cause of IR is not limited to impaired insulin signaling, but also involves genetic and environmental factors. After 60 d of BDE-209 treatment, the FBG of mice in the low dose group was higher than that of the control group; meanwhile, FINS and the ISI were lower than those in the control group, indicating that BDE-209 may give the mice glucose tolerance but impair insulin sensitivity, which further leads to IR and T2DM. This may be related to the biochemical characteristics of the persistent organic pollutant BDE-209, which may change the function of endocrine organs and destroy insulinsecretion, thereby triggering diabetes or leading to IR.
A previous animal model showed that exposure to persistent organic pollutants (including BDE-209) can impair mitochondrial function and increase adipocytokine levels, which may mediate inflammation and IR[20]. More recent studies have found that mitochondrial damage is closely related to IR. Mitochondrial damage leads to increased production of reactive oxygen species (ROS), causing mitochondrial fatty acid metabolism disorders. Furthermore, increased ROS and accumulated lipids activate part of the inflammatory pathway, thereby inhibiting the transmission of insulin signals[21]. PPARγ is a key regulator of lipid absorption and synthesis. PPARγ mRNA expression was significantly increased in the liver of BDE-209 exposed mice, and this aggravated the increased PPARγ expression induced by BDE-209. The upregulation of PPARγ caused by BDE-209 exposure in vivo and in vitro is related to lipid accumulation and glucose metabolism dysfunction. Increased PPARγ expression can lead to glucose and lipid metabolism disorders to a certain extent, indicating that PPARγ may be a key molecule for glucose and lipid metabolism disorder that is involved in BDE-209 induced T2DM.
BDE-209 also increased LEP and PPARγ levels in serum and the mRNA and protein levels in adipose tissue but reduced Adp content in serum and its mRNA and protein expression in adipose tissue. BDE-209 activates the mouse Adp promoter to stimulate Adp mRNA and protein expression in adipocytes; it also stimulates fatty acid oxidation by reducing the globular domain of Adp[22], resulting in abnormal differentiation of mouse adipocytes. Decreased levels of secreted Adp by cells ultimately leads to body fat or weight gain. PPARγ is a key regulator of adipogenesis that transcriptionally promotes adipocyte differentiation, increases the number of adipocytes, and increases the expression of related genes in adipose tissue[23]. After PPARγ is activated by the ligand BDE-209, it binds to the retinol X receptor to form a heterodimer, and then interacts with PPARγ on the specific DNA. The combination of response element leads to a decrease in Adp levels. Adp is an effective insulin sensitizer in the body. The decrease in Adp content leads to decreased insulin sensitivity. A previous study showed that increased serum LEP level were associated with an increase in metabolic syndrome components, and Adp levels decreased with increased expression of metabolic syndrome components[24].
Through animal experiments and laboratory tests, this study explored the effects of BDE-209 on mouse body weight and organ weight, glucose and lipid metabolism disorders, and adipocytokines. Our data initially explained the relationship between BDE-209 and obesity, IR, and high TG. Ultimately, we will also be able to uncover the influence of these factors on other metabolic diseases, such as esteremia, hypercholesterolemia, and high and low density lipoproteinemia.
Our study shows that BDE-209 increases mouse body weight, body fat, liver tissue weight, triglyceridemia, TC, and LDL-C. BDE-209 also reduces HDL-C and causes IR in mice, which may be related to activating the PPARγ receptor.
Decabromodiphenyl ether (BDE-209) is the most commonly used brominated flame retardant. Recently, BDE-209 has been suspected of being an environmental risk factor for metabolic diseases such as obesity, insulin resistance (IR), type 2 diabetes mellitus, and hypertension. Data suggest that it may play a key role in the occurrence, development, and treatment of these diseases. The underlying mechanism may be that BDE-209 inappropriately regulates the number and volume of adipocytes at the molecular level, leading to adipogenesis and lipid metabolism disorders. These changes further alter the function of metabolic disease-related factors, leading to disease occurrence.
The research of BDE-209 on the body's adipocyte factor and insulin sensitivity is still not fully developed.
To investigate the effects of BDE-209 on IR and glucose and lipid metabolism in C57BL/6 mice.
Adult male C57BL/6 mice were randomly divided into high, medium-high, medium, medium-low, and low dose BDE-209 groups, as well as a control group. After BDE-209 exposure for 60 d, the mice were fasted overnight, and then sacrificed to obtain tissues and serum to detect serum triglyceride (TG), total cholesterol (TC), low-density lipoprotein cholesterol (LDL-C), and high density lipoprotein cholesterol (HDL-C) contents, and fasting insulin (FINS), leptin (LEP), and adiponectin (Adp) levels. Morphological changes of the liver were observed by hematoxylin and eosin staining. Real-time quantitative polymerase chain reaction and Western blot were used to determine the mRNA and protein levels of LEP, Adp, and peroxisome proliferators activated receptor-γ (PPARγ) in mouse liver and adipose tissues.
There was a statistically significant difference in the weight of mice in each group after 45 and 60 d of exposure. After 60 d of exposure, the weight of liver and adipose tissues in the exposure groups were greater than that in the control group. The liver tissue structure was disordered, and the liver tissues of the high, medium-high, and medium dose groups were accompanied by local inflammatory cell infiltration. Serum levels of FINS, insulin sensitivity index, Adp, and HDL-C were decreased in the BDE-209 groups compared with the control group, as were the mRNA and protein levels of Adp in liver and adipose tissues. Serum level of fasting blood glucose and LEP were higher in the BDE-209 group than in controls. TC, TG, and LDL-C levels and the mRNA and protein expression of LEP and PPARγ in liver and adipose tissue were higher than those in the control group. Homeostatic assessment model of FINS resistance was higher in the BDE-209 medium and medium-low dose groups.
BDE-209 increases mouse body weight, body fat, liver tissue weight, TC, TG, and LDL-C. BDE-209 also reduces HDL-C and cause IR in mice, which may be related to activating the PPARγ receptor.
Further studies on mouse serum biochemical indicators, FINS content, and adipocytokines are needed to better explore the relationship between BDE-209 and insulin sensitivity and adipocytokines.
Manuscript source: Unsolicited manuscript
Specialty type: Medicine, research and experimental
Country/Territory of origin: China
Peer-review report’s scientific quality classification
Grade A (Excellent): 0
Grade B (Very good): B
Grade C (Good): 0
Grade D (Fair): 0
Grade E (Poor): 0
P-Reviewer: Jialal I S-Editor: Zhang L L-Editor: Wang TQ P-Editor: Ma YJ
| 1. | Basios N, Lampropoulos P, Papalois A, Lambropoulou M, Pitiakoudis MK, Kotini A, Simopoulos C, Tsaroucha AK. Apigenin Attenuates Inflammation in Experimentally Induced Acute Pancreatitis-Associated Lung Injury. J Invest Surg. 2016;29:121-127. [RCA] [PubMed] [DOI] [Full Text] [Cited by in Crossref: 7] [Cited by in RCA: 10] [Article Influence: 1.0] [Reference Citation Analysis (0)] |
| 2. | de Dios O, Vales-Villamarín C, Herrero L, Pérez-Segura P, Soriano-Guillén L, Garcés C. Analysis of leptin-adiponectin ratio and C-reactive protein as potential biomarkers of metabolic syndrome in adolescents. Clin Chem Lab Med. 2021;. [RCA] [PubMed] [DOI] [Full Text] [Cited by in Crossref: 2] [Cited by in RCA: 2] [Article Influence: 0.5] [Reference Citation Analysis (0)] |
| 3. | Dong M, Ren J. What fans the fire: insights into mechanisms of leptin in metabolic syndrome-associated heart diseases. Curr Pharm Des. 2014;20:652-658. [RCA] [PubMed] [DOI] [Full Text] [Cited by in Crossref: 33] [Cited by in RCA: 43] [Article Influence: 3.9] [Reference Citation Analysis (0)] |
| 4. | Ghantous CM, Azrak Z, Hanache S, Abou-Kheir W, Zeidan A. Differential Role of Leptin and Adiponectin in Cardiovascular System. Int J Endocrinol. 2015;2015:534320. [RCA] [PubMed] [DOI] [Full Text] [Full Text (PDF)] [Cited by in Crossref: 111] [Cited by in RCA: 138] [Article Influence: 13.8] [Reference Citation Analysis (0)] |
| 5. | Srikanthan K, Feyh A, Visweshwar H, Shapiro JI, Sodhi K. Systematic Review of Metabolic Syndrome Biomarkers: A Panel for Early Detection, Management, and Risk Stratification in the West Virginian Population. Int J Med Sci. 2016;13:25-38. [RCA] [PubMed] [DOI] [Full Text] [Full Text (PDF)] [Cited by in Crossref: 324] [Cited by in RCA: 293] [Article Influence: 32.6] [Reference Citation Analysis (0)] |
| 6. | Archer AE, Von Schulze AT, Geiger PC. Exercise, heat shock proteins and insulin resistance. Philos Trans R Soc Lond B Biol Sci. 2018;373:20160529. [RCA] [PubMed] [DOI] [Full Text] [Cited by in Crossref: 46] [Cited by in RCA: 79] [Article Influence: 11.3] [Reference Citation Analysis (0)] |
| 7. | Potron G, Droulle-Bertignon C, Ledoyen MP. [The effect of activator on the esterase activity of plasmin obtained by streptokinase]. C R Seances Soc Biol Fil. 1975;169:1029-1033. [PubMed] |
| 8. | Ji X, Ding J, Xie X, Cheng Y, Huang Y, Qin L, Han C. Pollution Status and Human Exposure of Decabromodiphenyl Ether (BDE-209) in China. ACS Omega. 2017;2:3333-3348. [RCA] [PubMed] [DOI] [Full Text] [Cited by in Crossref: 50] [Cited by in RCA: 53] [Article Influence: 6.6] [Reference Citation Analysis (0)] |
| 9. | Yanagisawa R, Koike E, Win-Shwe TT, Takano H. Decabromodiphenyl ether exacerbates hyperglycemia in diet-induced obese mice. Toxicology. 2019;412:12-18. [RCA] [PubMed] [DOI] [Full Text] [Cited by in Crossref: 6] [Cited by in RCA: 11] [Article Influence: 1.6] [Reference Citation Analysis (0)] |
| 10. | Zhi H, Wu JP, Lu LM, Li Y, Chen XY, Tao J, Mai BX. Decabromodiphenyl ether (BDE-209) enhances foam cell formation in human macrophages via augmenting Toll-like receptor 4-dependent lipid uptake. Food Chem Toxicol. 2018;121:367-373. [RCA] [PubMed] [DOI] [Full Text] [Cited by in Crossref: 12] [Cited by in RCA: 22] [Article Influence: 3.1] [Reference Citation Analysis (0)] |
| 11. | Fan X, Zhang K, Wang X, Zhang X, Zeng L, Li N, Han Q, Liu Z. Sleep disorders are associated with acetaminophen-induced adverse reactions and liver injury. Biomed Pharmacother. 2021;134:111150. [RCA] [PubMed] [DOI] [Full Text] [Cited by in Crossref: 3] [Cited by in RCA: 3] [Article Influence: 0.8] [Reference Citation Analysis (1)] |
| 12. | Xu X, Liu J, Zeng X, Lu F, Chen A, Huo X. Elevated serum polybrominated diphenyl ethers and alteration of thyroid hormones in children from Guiyu, China. PLoS One. 2014;9:e113699. [RCA] [PubMed] [DOI] [Full Text] [Full Text (PDF)] [Cited by in Crossref: 23] [Cited by in RCA: 31] [Article Influence: 2.8] [Reference Citation Analysis (0)] |
| 13. | Tang Q, Li X, Song P, Xu L. Optimal cut-off values for the homeostasis model assessment of insulin resistance (HOMA-IR) and pre-diabetes screening: Developments in research and prospects for the future. Drug Discov Ther. 2015;9:380-385. [RCA] [PubMed] [DOI] [Full Text] [Cited by in Crossref: 131] [Cited by in RCA: 191] [Article Influence: 21.2] [Reference Citation Analysis (0)] |
| 14. | Wu Z, Xie M, Li Y, Gao G, Bartlam M, Wang Y. Biodegradation of decabromodiphenyl ether (BDE 209) by a newly isolated bacterium from an e-waste recycling area. AMB Express. 2018;8:27. [RCA] [PubMed] [DOI] [Full Text] [Full Text (PDF)] [Cited by in Crossref: 30] [Cited by in RCA: 32] [Article Influence: 4.6] [Reference Citation Analysis (0)] |
| 15. | Sun Y, Wang Y, Liang B, Chen T, Zheng D, Zhao X, Jing L, Zhou X, Sun Z, Shi Z. Hepatotoxicity of decabromodiphenyl ethane (DBDPE) and decabromodiphenyl ether (BDE-209) in 28-day exposed Sprague-Dawley rats. Sci Total Environ. 2020;705:135783. [RCA] [PubMed] [DOI] [Full Text] [Cited by in Crossref: 56] [Cited by in RCA: 84] [Article Influence: 16.8] [Reference Citation Analysis (0)] |
| 16. | Jung UJ, Choi MS. Obesity and its metabolic complications: the role of adipokines and the relationship between obesity, inflammation, insulin resistance, dyslipidemia and nonalcoholic fatty liver disease. Int J Mol Sci. 2014;15:6184-6223. [RCA] [PubMed] [DOI] [Full Text] [Full Text (PDF)] [Cited by in Crossref: 1040] [Cited by in RCA: 1311] [Article Influence: 119.2] [Reference Citation Analysis (0)] |
| 17. | Hand LE, Usan P, Cooper GJ, Xu LY, Ammori B, Cunningham PS, Aghamohammadzadeh R, Soran H, Greenstein A, Loudon AS, Bechtold DA, Ray DW. Adiponectin induces A20 expression in adipose tissue to confer metabolic benefit. Diabetes. 2015;64:128-136. [RCA] [PubMed] [DOI] [Full Text] [Cited by in Crossref: 31] [Cited by in RCA: 32] [Article Influence: 3.2] [Reference Citation Analysis (0)] |
| 18. | You M, Yuan S, Shi J, Hou Y. PPARδ signaling regulates colorectal cancer. Curr Pharm Des. 2015;21:2956-2959. [RCA] [PubMed] [DOI] [Full Text] [Cited by in Crossref: 23] [Cited by in RCA: 34] [Article Influence: 3.8] [Reference Citation Analysis (0)] |
| 19. | Yun JE, Kimm H, Jo J, Jee SH. Serum leptin is associated with metabolic syndrome in obese and nonobese Korean populations. Metabolism. 2010;59:424-429. [RCA] [PubMed] [DOI] [Full Text] [Cited by in Crossref: 43] [Cited by in RCA: 49] [Article Influence: 3.3] [Reference Citation Analysis (0)] |
| 20. | Littlejohn NK, Seban N, Liu CC, Srinivasan S. A feedback loop governs the relationship between lipid metabolism and longevity. Elife. 2020;9:e58815. [RCA] [PubMed] [DOI] [Full Text] [Full Text (PDF)] [Cited by in Crossref: 10] [Cited by in RCA: 18] [Article Influence: 3.6] [Reference Citation Analysis (0)] |
| 21. | Yu T, Robotham JL, Yoon Y. Increased production of reactive oxygen species in hyperglycemic conditions requires dynamic change of mitochondrial morphology. Proc Natl Acad Sci USA. 2006;103:2653-2658. [RCA] [PubMed] [DOI] [Full Text] [Cited by in Crossref: 968] [Cited by in RCA: 984] [Article Influence: 51.8] [Reference Citation Analysis (0)] |
| 22. | Kim YA, Park JB, Woo MS, Lee SY, Kim HY, Yoo YH. Persistent Organic Pollutant-Mediated Insulin Resistance. Int J Environ Res Public Health. 2019;16:448. [RCA] [PubMed] [DOI] [Full Text] [Full Text (PDF)] [Cited by in Crossref: 22] [Cited by in RCA: 17] [Article Influence: 2.8] [Reference Citation Analysis (0)] |
| 23. | Di Ciaula A, Baj J, Garruti G, Celano G, De Angelis M, Wang HH, Di Palo DM, Bonfrate L, Wang DQ, Portincasa P. Liver Steatosis, Gut-Liver Axis, Microbiome and Environmental Factors. A Never-Ending Bidirectional Cross-Talk. J Clin Med. 2020;9:2648. [RCA] [PubMed] [DOI] [Full Text] [Full Text (PDF)] [Cited by in Crossref: 113] [Cited by in RCA: 105] [Article Influence: 21.0] [Reference Citation Analysis (0)] |
| 24. | Crissey JT, Denenholz DA. Syphilis. Clin Dermatol. 1984;2:1-166. [RCA] [PubMed] [DOI] [Full Text] [Cited by in Crossref: 4] [Cited by in RCA: 5] [Article Influence: 0.1] [Reference Citation Analysis (0)] |


