Copyright
©The Author(s) 2021.
World J Diabetes. Nov 15, 2021; 12(11): 1917-1927
Published online Nov 15, 2021. doi: 10.4239/wjd.v12.i11.1917
Published online Nov 15, 2021. doi: 10.4239/wjd.v12.i11.1917
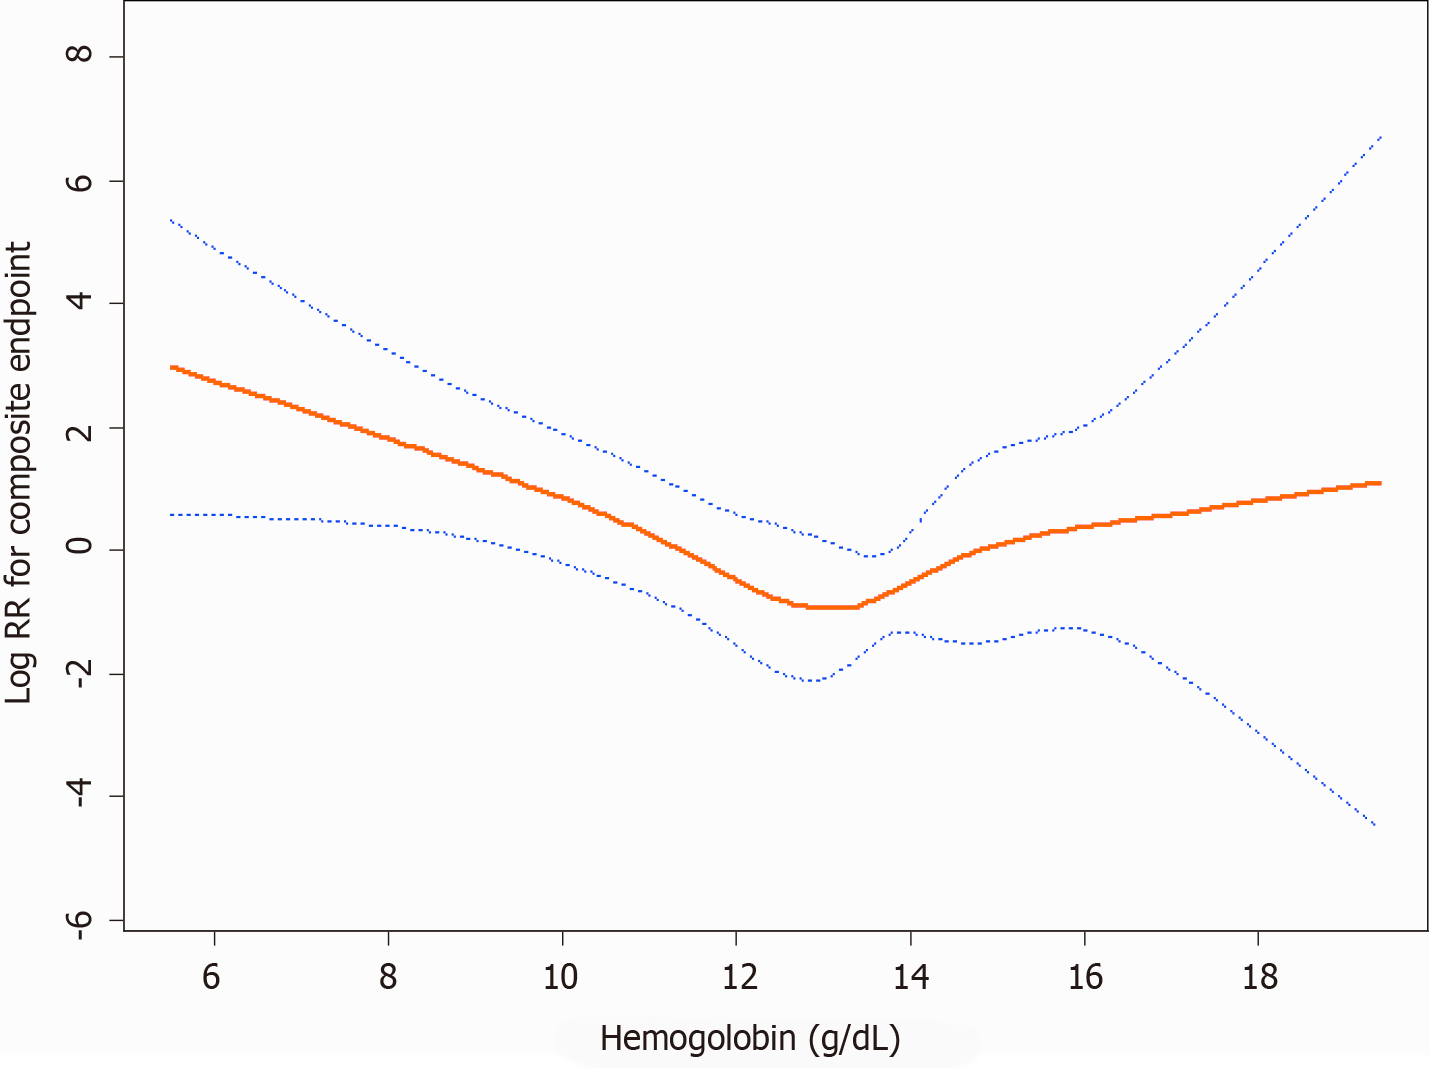
Figure 3 A U-shaped relationship was observed between hemoglobin levels and the composite endpoint.
The curve tended to reach the lowest level at an optimal hemoglobin level (approximately 13.3 g/dL). The red line denotes fitted curves, and the blue lines represent 95%CI for the association between hemoglobin levels and the composite endpoint. Adjusted for (model 4): Age, gender, body mass index, baseline estimated glomerular filtration rate, history of hypertension, systolic blood pressure, diastolic blood pressure, 24 h urinary protein, angiotensin-converting enzyme inhibitors and/or angiotensin receptor blockers use, albumin, total cholesterol, triglycerides, duration of diabetes, fasting glycaemia, and glycosylated hemoglobin.
- Citation: Song HY, Wei CM, Zhou WX, Hu HF, Wan QJ. Association between admission hemoglobin level and prognosis in patients with type 2 diabetes mellitus. World J Diabetes 2021; 12(11): 1917-1927
- URL: https://www.wjgnet.com/1948-9358/full/v12/i11/1917.htm
- DOI: https://dx.doi.org/10.4239/wjd.v12.i11.1917


