Copyright
©The Author(s) 2018.
World J Diabetes. Jan 15, 2018; 9(1): 25-32
Published online Jan 15, 2018. doi: 10.4239/wjd.v9.i1.25
Published online Jan 15, 2018. doi: 10.4239/wjd.v9.i1.25
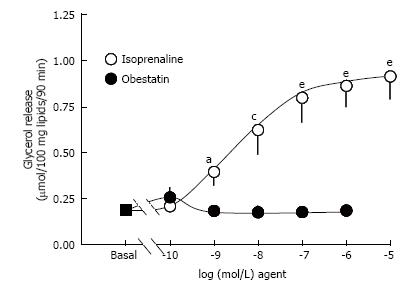
Figure 1 Effects of isoprenaline and of obestatin on lipolysis activation in human adipocytes.
Fat cells were incubated for 90 min with isoprenaline (open circles) or obestatin (closed circles) at the indicated concentrations. Mean ± SEM of 7 experiments. In several occurrences, SEM bar lies within the symbol. Different from basal lipolysis (black square) at: aP < 0.05; cP < 0.01; eP < 0.001.
Figure 2 Effects of obestatin and of insulin on isoprenaline-induced lipolysis in human adipocytes.
The submaximal stimulation of lipolysis by 5 nmol/L isoprenaline was set at 100 % (control) and determined in the presence of indicated doses of obestatin (open columns), insulin (shaded columns), or the combination of insulin/+ 100 nmol/L obestatin (dark columns). Mean ± SEM of 7 experiments.
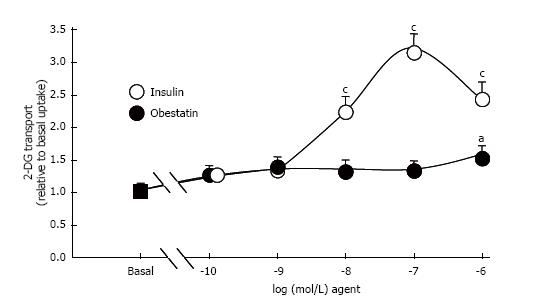
Figure 3 Effects of obestatin and insulin on glucose transport in human adipocytes.
2-deoxyglucose uptake (2-DG) was measured after 45-min incubation without (basal) and with the indicated doses of human insulin (open circles), or obestatin (closed circles). Mean ± SEM of 10 experiments. Statistically different from basal uptake (black square) at: aP < 0.05; cP < 0.001.
- Citation: Carpéné C, Les F, Estève D, Galitzky J. Short-term effects of obestatin on hexose uptake and triacylglycerol breakdown in human subcutaneous adipocytes. World J Diabetes 2018; 9(1): 25-32
- URL: https://www.wjgnet.com/1948-9358/full/v9/i1/25.htm
- DOI: https://dx.doi.org/10.4239/wjd.v9.i1.25


