Copyright
©The Author(s) 2015.
World J Diabetes. Aug 10, 2015; 6(9): 1113-1121
Published online Aug 10, 2015. doi: 10.4239/wjd.v6.i9.1113
Published online Aug 10, 2015. doi: 10.4239/wjd.v6.i9.1113
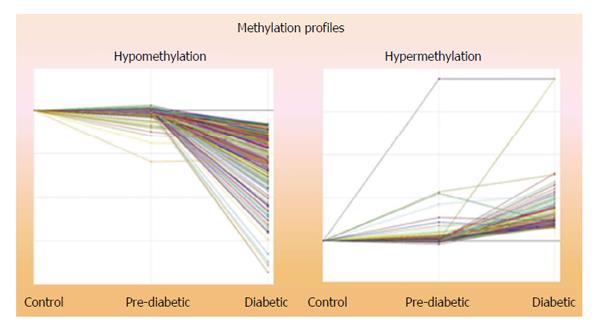
Figure 1 Global methylation profile depicting a total of 868 genes.
Total of 694 were hypomethylated, 174 were hypermethylated.
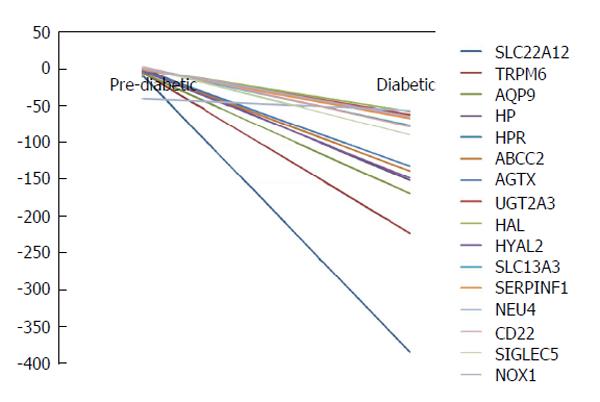
Figure 2 A total of 92 genes were hypomethylated and 54 were hypermethylated in all subjects using Illumina bead studio.
Significantly hypomethylated genes were compared to putative genes identified in literature review forming of a sub-group of sixteen genes related to kidney disease. These sixteen genes are represented here as cumulative average DiffScore deviations from control comparisons. Scores of ± 13 P-value of 0.05, ± 22 P-value of 0.01.
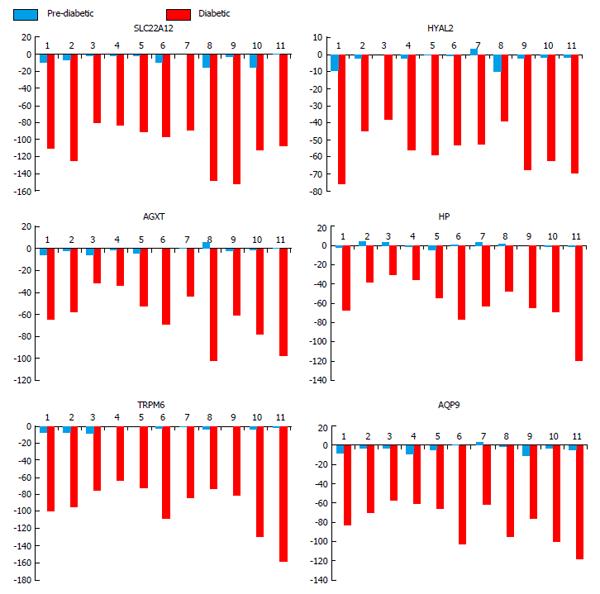
Figure 3 Hypo-methylated kidney disease associated gene loci.
Six putative genes related to kidney disease were hypomethylated across patients (numbered 1-11) compared to controls (n = 2). Red bars indicate diabetic time point and blue bars representing prediabetic time point. Data represented as DiffScore with ± 13 equating to P-value 0.05, ± 22 equating to P-value of 0.01, and ± 33 equating to P-value of 0.001. SLC22A12 (a urate transporter on the proximal tubule); TRPM6 (a cation channel in the kidney); AQP9 (an aquaporin); HP (haptoglobin, which binds plasma hemoglobin); AGXT (alanine-glyoxylate aminotransferase which is involved in oxalic acid secretion); HYAL2 (a hyaluronidase).
- Citation: VanderJagt TA, Neugebauer MH, Morgan M, Bowden DW, Shah VO. Epigenetic profiles of pre-diabetes transitioning to type 2 diabetes and nephropathy. World J Diabetes 2015; 6(9): 1113-1121
- URL: https://www.wjgnet.com/1948-9358/full/v6/i9/1113.htm
- DOI: https://dx.doi.org/10.4239/wjd.v6.i9.1113


