Copyright
©The Author(s) 2015.
World J Diabetes. Feb 15, 2015; 6(1): 208-216
Published online Feb 15, 2015. doi: 10.4239/wjd.v6.i1.208
Published online Feb 15, 2015. doi: 10.4239/wjd.v6.i1.208
Figure 1 DTSQ questionnaire results (Diabetes Treatment Satisfaction Questionnaire - as assessed by patients) from the Greek PANORAMA study population.
Graph presents the percentage of patients that provided positive answers following a series of questions of DTSQ’s specific domains related to their treatment satisfaction (grades 4-6 in DTSQ scale).
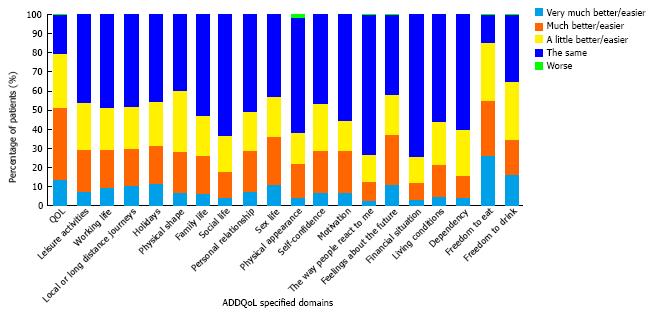
Figure 2 ADDQoL questionnaire results (Audit of Diabetes Dependent QoL) from the Greek PANORAMA study population.
ADDQoL is an individualized measure of the impact of diabetes on QoL. Graph presents the distribution of answers reported by patients following the question: “If I did not have diabetes my QoL would be…”.
Figure 3 HFS questionnaire results (Hypoglycaemia Fear Survey-II) from the Greek PANORAMA study population.
Graph presents the distribution of answers (“never”, “almost never”, “sometimes”, “frequently” and “almost always”) following questions in the 18 specific domains of the HFS questionnaire related to patients’ fear of hypoglycaemia. Each of the 18 items was preceded by the statement “Because my blood sugar could drop, I worried about …”.
- Citation: Avramopoulos I, Moulis A, Nikas N. Glycaemic control, treatment satisfaction and quality of life in type 2 diabetes patients in Greece: The PANORAMA study Greek results. World J Diabetes 2015; 6(1): 208-216
- URL: https://www.wjgnet.com/1948-9358/full/v6/i1/208.htm
- DOI: https://dx.doi.org/10.4239/wjd.v6.i1.208


