Copyright
©2014 Baishideng Publishing Group Inc.
World J Diabetes. Oct 15, 2014; 5(5): 606-629
Published online Oct 15, 2014. doi: 10.4239/wjd.v5.i5.606
Published online Oct 15, 2014. doi: 10.4239/wjd.v5.i5.606
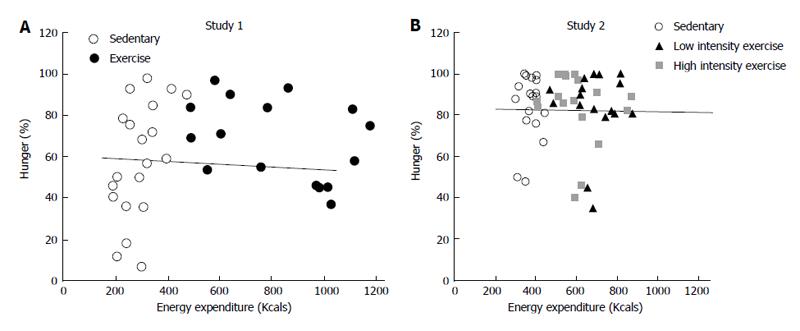
Figure 1 Correlation between energy expenditure and peak hunger in two studies in which exercise energy expenditure of between 2300 and 2500 KJ was inserted between the morning and midday meal (A) or between both morning and midday, and midday and afternoon, meals (B).
Correlation coefficient between energy expenditure during overnight fast before the morning meal, and during morning intermeal interval that included exercise on one hand and peak hunger at the next meal was 0.06 in A. In B, the correlation coefficient between intermeal intervals that included exercise and peak hunger at the subsequent meal was 0.0002. Data from Ref. [69].
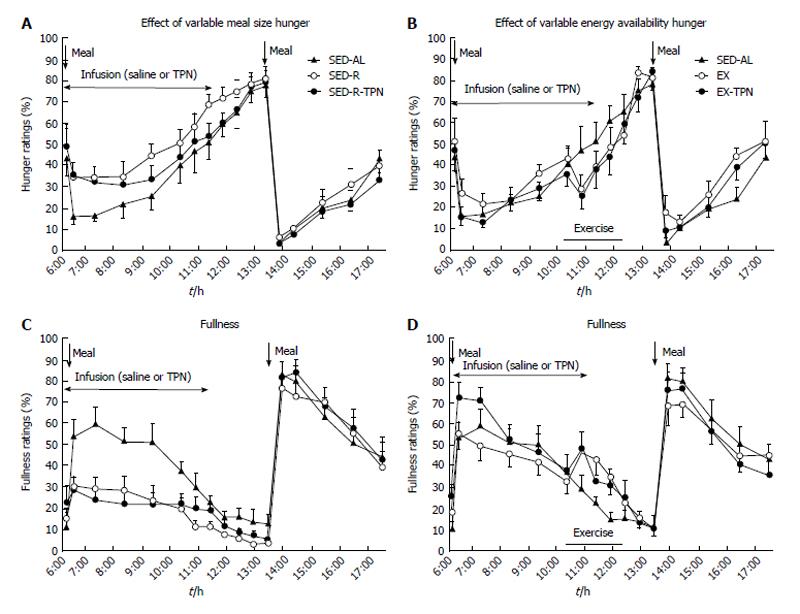
Figure 2 The effects of variable meal size (A) and energy availability (B) on the psychophysical ratings of hunger (A and B) and fullness (C and D) in 10 postmenopausal women subjected to a sedentary trial with a large morning meal (SED-AL), or a small morning meal SED-R, 2 h of moderate intensity exercise after a large morning meal (EX), and iv nutrient infusion (TPN) as a replacement of energy withheld from a morning meal (SED-R-TPN) or expended through exercise (EX-TPN).
Meal size had a negative effect on hunger (Fdf4,36 = 39.3, P < 0.0001) and a positive effect on fullness (Fdf4,36 = 115.3, P < 0.0001). Exercise energy expenditure had a negative effect on hunger (Fdf4,36 = 25.5, P < 0.0001), and a positive effect on fullness (Fdf4,36 = 42.8; P < 0.0001). TPN had no effect on psychophysical ratings. Data from Ref. [39].
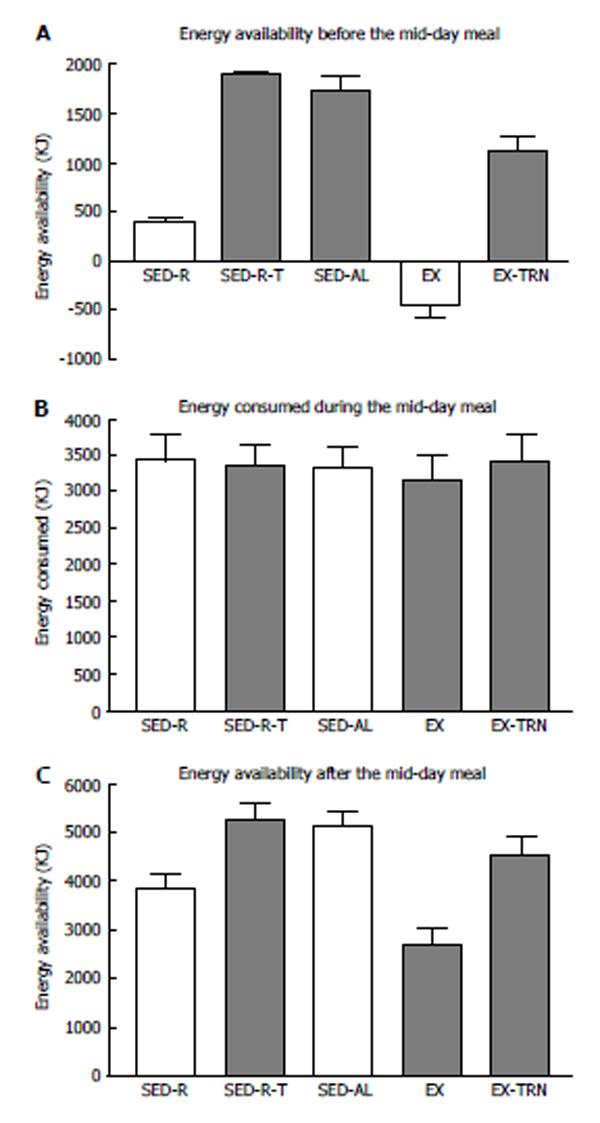
Figure 3 Effect of the morning energy availability (A) on the energy consumed during the midday meal (B) and the residual postmeal energy balance (C) in 10 women subjected to small (SED-R) or large (SED) morning meals, exercise (EX), and TPN (SED-R-T, EX-TPN).
Midday meal did not compensate for the significantly lower energy balance in SED-R and EX trials (Fdf4,45 = 77.2; P < 0.0001), which remained uncorrected after the meal (Fdf4,45 = 10.2; P < 0.0001). Data from Ref. [39].
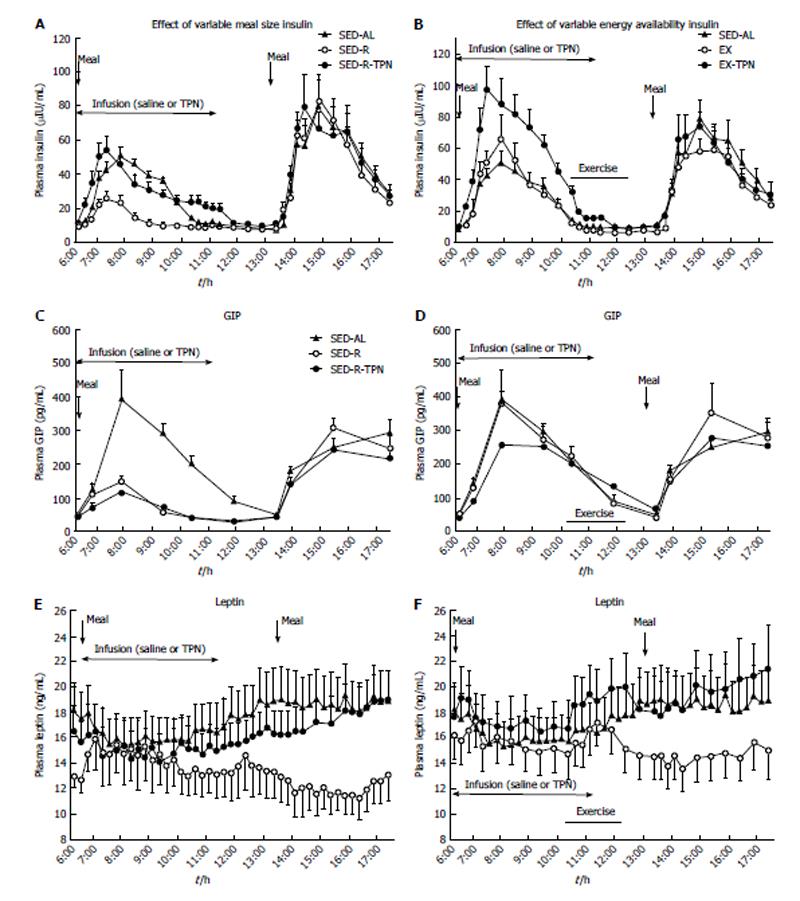
Figure 4 The effects of variable meal size (A) and energy variability (B) on the plasma concentrations of insulin (A and B), GIP (C and D) and leptin (E and F) under the conditions described in Figure 2.
Insulin showed significant postprandial increases to meal size (A) and TPN (B) (Fdf4,45 = 25.7; P < 0.0001), whereas GIP responded only to meal size (Fdf4,45 = 42.3; P < 0.0001). Neither insulin nor GIP responded to exercise energy expenditure. Plasma leptin concentration slowly and progressively decreased in response to reduced energy availability caused by small meal (Fdf4,36 = 48.1; P < 0.0001) and exercise (Fdf4,36 = 39.1; P < 0.0001), and this response was abolished by large meal and TPN. Data from Ref. [39].
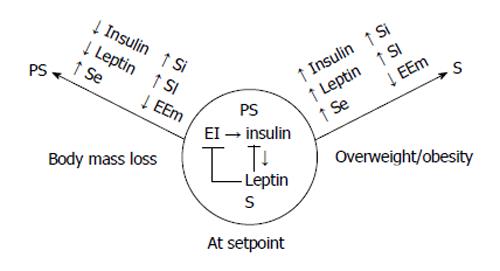
Figure 5 The conceptual model of the autonomic regulation of body weight.
Autonomic nervous system regulates the energy flux through the energy conserving actions of insulin that are counterbalanced by the energy expending actions of leptin to match energy intake (EI) and expenditure (EE) and maintain stable body weight (center circle). The counterbalancing is achieved by the upregulation of leptin by the glycolytic energy flux in the WAT stimulated by insulin. Leptin, in turn, inhibits insulin secretion and actions in several organs. If dieting or food scarcity cause weight loss (left arrow), energy conservation is achieved, in part, by reduced Symp activity and EE (EEm). Predominance of Parasymp actions are manifested in reduced fasting insulin and leptin concentrations, increased tissue sensitivities to insulin (Si) and leptin (Sl) along with increased sensitivity in enzymatic nutrient sensing (Se) of energy depletion. In addition, energy is conserved through reduced S activation of metabolism. When overeating and reduced physical activity result in obesity (right arrow), there is a reverse change in fasting insulin and leptin concentrations, tissues become resistant to both hormones as well as to S elicitation of metabolic EE. Due to insulin and leptin resistance, the ineffective compensatory increase in S activity to counteract further body fat, lean body mass, and bone accretion, mainly causes vasoconstriction and hypertension.
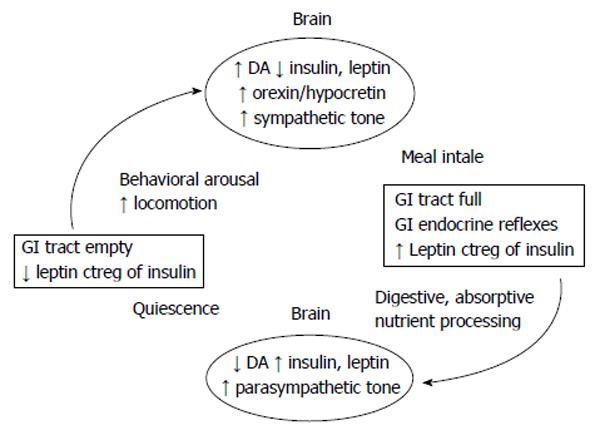
Figure 6 The conceptual model of the linkage between nonhomeostatic meal eating and nonhomeostatic facilitation of physical activity.
Completion of gastrointestinal (GI) transit of food removes the inhibitory influence of volumetric and nutritional afferent information mediated by the vagus nerve from reaching nucleus tractus solitaries and DA and opioidergic brain centers of reward.This allows activation of sympathetic actions over fuel mobilization, full operation of behavioral arousal, nonhomeostatic increase in locomotion in quest of food associated with activation of orexin/hypocretin and ghrelin. Completion of nonhomeostatically controled meal results in filling of the stomach, activation of GI nutrient sensing, and increases in postprandial plasma concentrations of insulin and leptin. Vagal projections of this information to the brain reinstate the inhibition over autonomic sympathetic actions and activate parasympathetic control of food digestion and absorption and behavioral quiescence. It is probable that weight loss increases postprandial events linked by the left arrow, and that obesity increases the postprandial events linked by right arrow. Additional consequences of weight loss and weight gain are mediated by changes in tissue sensitivities to leptin and insulin actions altering the prevailing sympathovagal balance and illustrated in Figure 5. DA: Dopaminergic.
- Citation: Borer KT. Counterregulation of insulin by leptin as key component of autonomic regulation of body weight. World J Diabetes 2014; 5(5): 606-629
- URL: https://www.wjgnet.com/1948-9358/full/v5/i5/606.htm
- DOI: https://dx.doi.org/10.4239/wjd.v5.i5.606


