Copyright
©2014 Baishideng Publishing Group Co.
World J Diabetes. Apr 15, 2014; 5(2): 198-208
Published online Apr 15, 2014. doi: 10.4239/wjd.v5.i2.198
Published online Apr 15, 2014. doi: 10.4239/wjd.v5.i2.198
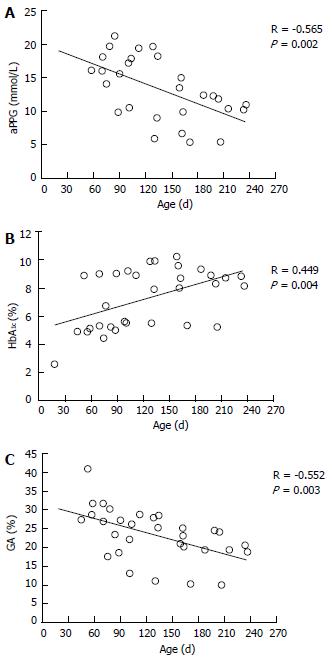
Figure 1 Time course of average preprandial plasma glucose for 1 mo (A), HbA1c (B), and glycated albumin (C) according to treatment in 5 patients with neonatal diabetes mellitus (modified from Ref[6], with permission from Copyright Clearance Center Inc.
).
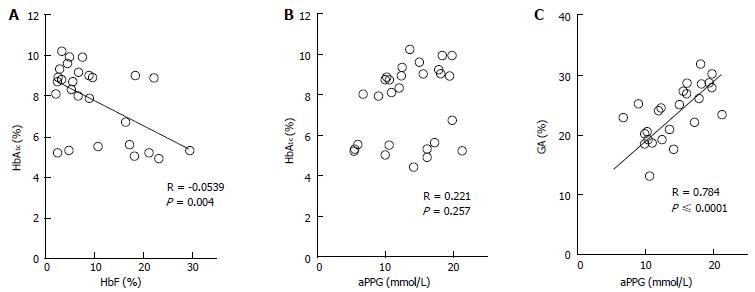
Figure 2 Correlations between HbA1c and HbF (A) and between HbA1c and average preprandial plasma glucose for 1 mo (B) and correlation between glycated albumin and average preprandial plasma glucose in 5 patients with neonatal diabetes mellitus (C) (modified from Ref[6], with permission from Copyright Clearance Center Inc.
).
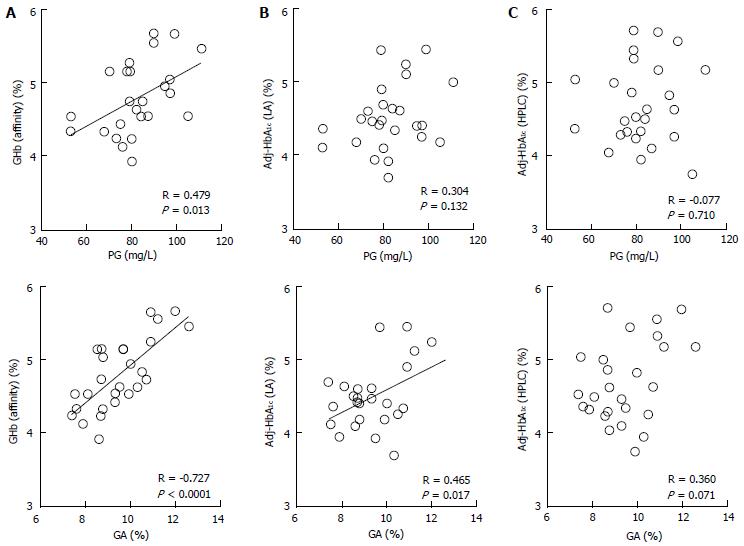
Figure 3 Correlations between glycated hemoglobin measure by various methods and plasma glucose or glycated albumin.
Correlations between GHb measured by the affinity method [GHb (affinity)] (A), HbF-adjusted HbA1c measured by the immunological method [Adj-HbA1c (LA)] (B), and HbF-adjusted HbA1c measured by the HPLC method [Adj-HbA1c (HPLC)] (C), and PG or GA in 26 healthy infants were shown (modified from Ref[72], with permission from Copyright Clearance Center Inc.). GA: Glycated albumin; PG: Plasma glucose; GHb: Glycated hemoglobin; HbF: Fetal hemoglobin.
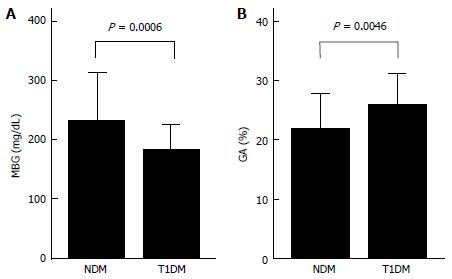
Figure 4 Comparisons of mean blood glucose for 1 mo (A) and GA (B) in 6 patients with neonatal diabetes mellitus and in 18 patients with type 1 diabetes mellitus (modified from Reference[65], with permission from Copyright Clearance Center Inc.
).
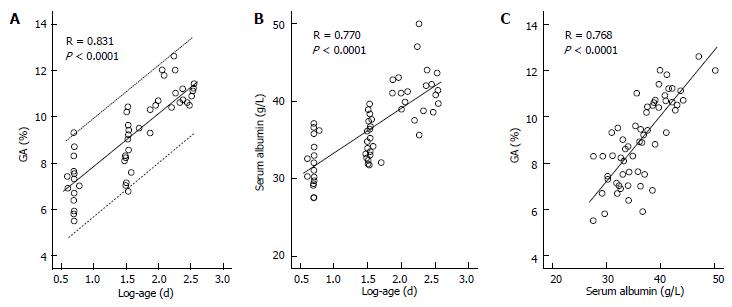
Figure 5 Correlations between glycated albumin and age and between serum albumin and age and correlation between glycated albumin and serum albumin in healthy infants.
A: Correlation between glycated albumin (GA) and log-age. The dotted line shows the 95%CI; B: Correlation between serum albumin and log-age; C: Correlation between GA and serum albumin (modified from Ref[66], with permission from Copyright Clearance Center Inc.).
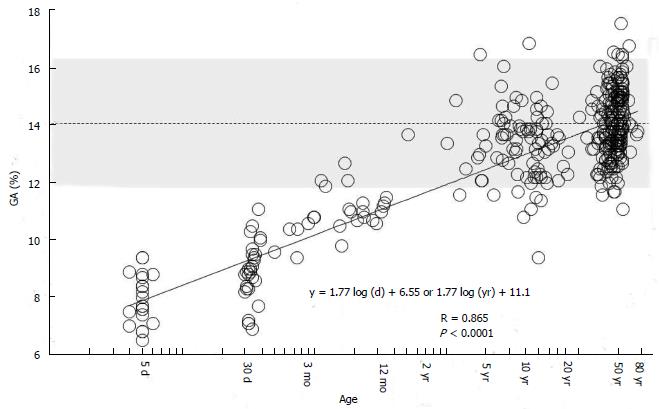
Figure 6 Correlation between glycated albumin and age in days (logarithmic transformation) in 376 healthy subjects (age: 4 d to 78 years).
The dotted line indicates the mean reference value for adults (14%), and the shading indicates the range of reference values for adults (11.7% to 16.2%) (modified from Ref[83], with permission from Royal Society of Medicine).
- Citation: Suzuki S, Koga M. Glycemic control indicators in patients with neonatal diabetes mellitus. World J Diabetes 2014; 5(2): 198-208
- URL: https://www.wjgnet.com/1948-9358/full/v5/i2/198.htm
- DOI: https://dx.doi.org/10.4239/wjd.v5.i2.198


