Copyright
©2014 Baishideng Publishing Group Co.
World J Diabetes. Apr 15, 2014; 5(2): 115-127
Published online Apr 15, 2014. doi: 10.4239/wjd.v5.i2.115
Published online Apr 15, 2014. doi: 10.4239/wjd.v5.i2.115
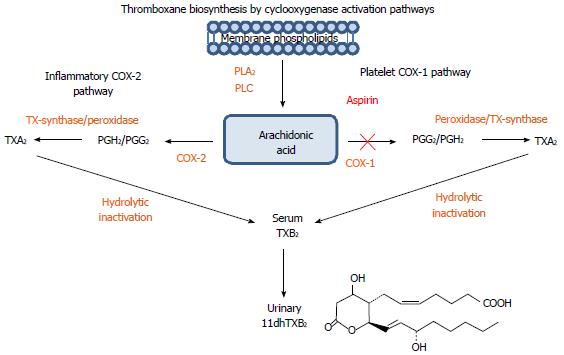
Figure 1 A schematic representation of the arachidonic/thromboxane metabolic pathway: Arachidonic acid generated from membrane phospholipids by phospholipase A2 and phospholipase C undergoes additional enzymatic transformation by cyclooxygenases (COX-1 and COX-2) into prostaglandin and thromboxane metabolites.
In platelets, Arachidonic acid (AA) is metabolized by COX-1 into prostaglandins PGG2, PGH2 and by thromboxane synthase into the bioactive thromboxane A2 (TXA2), which is a potent activator of platelet aggregation with a short half-life. TXA2 is quickly inactivated into a more stable thromboxane B2 (TXB2) and converted in the liver into an 11-dehydro-thromboxane B2 (11dhTXB2) metabolite excreted in the urine. Aspirin (ASA) irreversibly inhibits platelet COX-1 leading to decreased thromboxane-mediated platelet activation. TXA2 and 11dhTXB2 can be generated by COX-2 present in various inflammatory cells, pathway not affected by ASA.
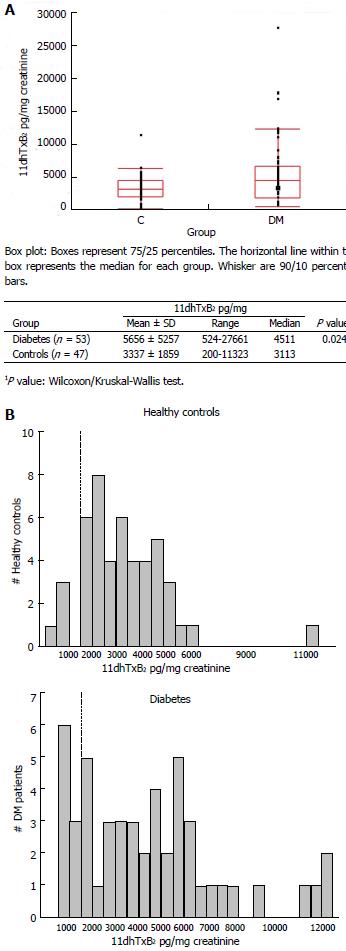
Figure 2 Distribution of baseline (aspirin-free) urinary 11-dehydro-thromboxane B2 levels (pg/mg) measured in healthy individuals and diabetes patients (A, top), and frequency distribution (histogram) of baseline urinary 11-dehydro-thromboxane B2 levels in the two groups studied (B, bottom).
A: Comparison of baseline 11-dehydro-thromboxane B2 levels of diabetes and controls; B: Frequency (Histogram) of baseline 11-dehydro-thromboxane B2 levels in diabetes and controls.
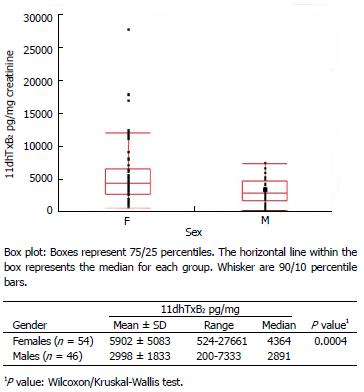
Figure 3 Distribution of baseline (aspirin-free) urinary 111-dehydro-thromboxane B2 levels (pg/mg) measured in healthy individuals and diabetes patients according to gender.
F: Females; M: Males.
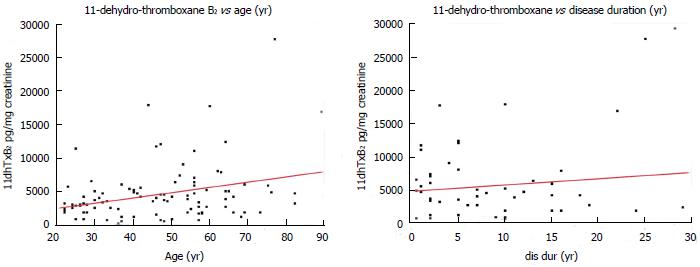
Figure 4 Correlation of baseline (aspirin-free) urinary 11-dehydro-thromboxane B2 levels (pg/mg) measured in healthy individuals and diabetes patients with age (left), and disease duration of diabetes patients (right).
Red lines: Linear regression fit.
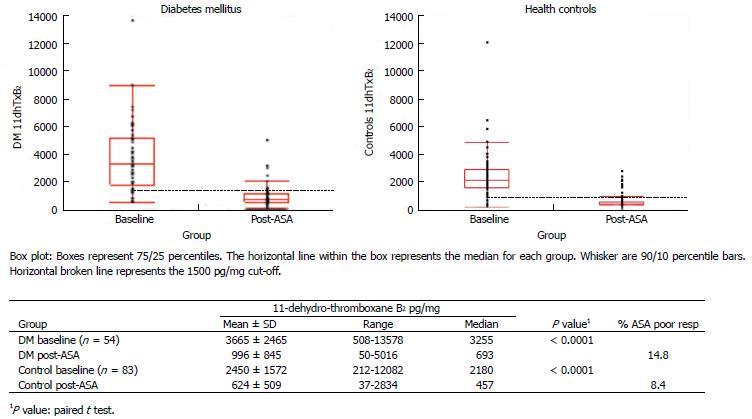
Figure 5 Distribution of baseline (aspirin-free) and post-aspirin urinary 11-dehydro-thromboxane B2 levels (pg/mg) measured in healthy individuals (right) and diabetes patients (left).
14.8% of diabetes patients were classified as aspirin (ASA) poor responders compared to 8.4% of healthy controls (post-ASA 11-dehydro-thromboxane B2 over the cutoff 1500 pg/mg).
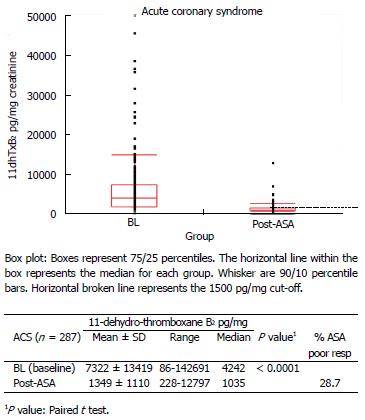
Figure 6 Distribution of baseline (aspirin-free) and post-aspirin urinary 11-dehydro-thromboxane B2 levels (pg/mg) measured in acute coronary syndrome patients.
28.7% of acute coronary syndrome patients were classified as ASA poor responders (post-ASA 11-dehydro-thromboxane B2 over the cutoff 1500 pg/mg). ACS: Acute coronary syndrome; ASA: Aspirin.
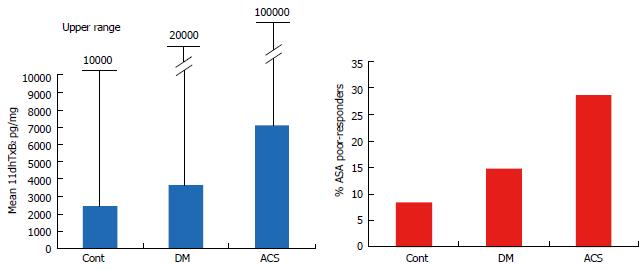
Figure 7 Mean and upper range of baseline (aspirin-free) urinary 11-dehydro-thromboxane B2 levels (pg/mg) measured in healthy controls, diabetes and acute coronary patients (left), and percent (%) of aspirin poor responders (post-aspirin 11-dehydro-thromboxane B2 over the cutoff 1500 pg/mg) in the populations studied (right).
DM: Diabetes; ACS: Acute coronary syndromes.
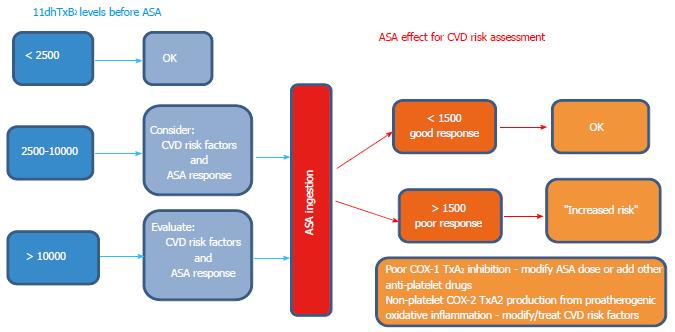
Figure 8 Proposed schematic representation (algorithm) to guide the clinical interpretation and decision making process for assessing CVD risk using baseline (aspirin-free) urinary 11-dehydro-thromboxane B2 (left), and post-aspirin 11-dehydro-thromboxane B2 levels (right).
Baseline 11-dehydro-thromboxane B2 levels suggested were taken from the mean and upper range of healthy controls. The cut-off of 1500 pg/mg applies only for subjects on aspirin (ASA) therapy to be classified as good or poor responders.
- Citation: Lopez LR, Guyer KE, Torre IGDL, Pitts KR, Matsuura E, Ames PR. Platelet thromboxane (11-dehydro-Thromboxane B2) and aspirin response in patients with diabetes and coronary artery disease. World J Diabetes 2014; 5(2): 115-127
- URL: https://www.wjgnet.com/1948-9358/full/v5/i2/115.htm
- DOI: https://dx.doi.org/10.4239/wjd.v5.i2.115


