Copyright
©2012 Baishideng Publishing Group Co.
World J Diabetes. May 15, 2012; 3(5): 94-104
Published online May 15, 2012. doi: 10.4239/wjd.v3.i5.94
Published online May 15, 2012. doi: 10.4239/wjd.v3.i5.94
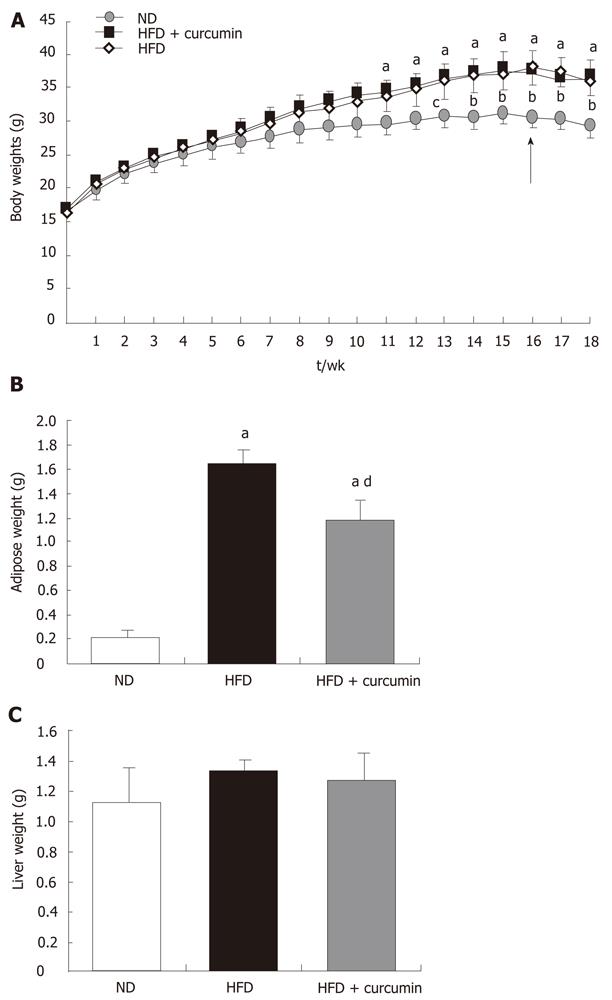
Figure 1 Effects of short term curcumin gavage on weights of whole body, epididymal fat tissue and liver.
A: Body weight. The body weight of mice was measured weekly following a normal diet or high fat diet feeding during the period of 18 wk. The arrow indicates the starting time of curcumin gavage; B: Weight of epididymal adipose tissue; C: Liver weight. The mice were fed with either a normal diet (ND, n = 10) or high fat diet (HFD, n = 20) for 16 wk. The HFD fed mice then received gavage of either curcumin (50 mg/kg per day, n = 10) or vehicle (1% carboxymethyl cellulose buffer, n = 10) for 15 d. The ND fed mice were also gavaged with the vehicle. The mice were sacrificed for tissue isolation and weighing. aP < 0.001, HFD or HFD + curcumin vs ND; bP < 0.001, HFD + curcumin vs ND; cP < 0.01 HFD + curcumin vs ND; dP < 0.05, HFD + curcumin vs HFD. Four mice from HFD and four mice from HFD + curcumin group died during the gavage procedure.
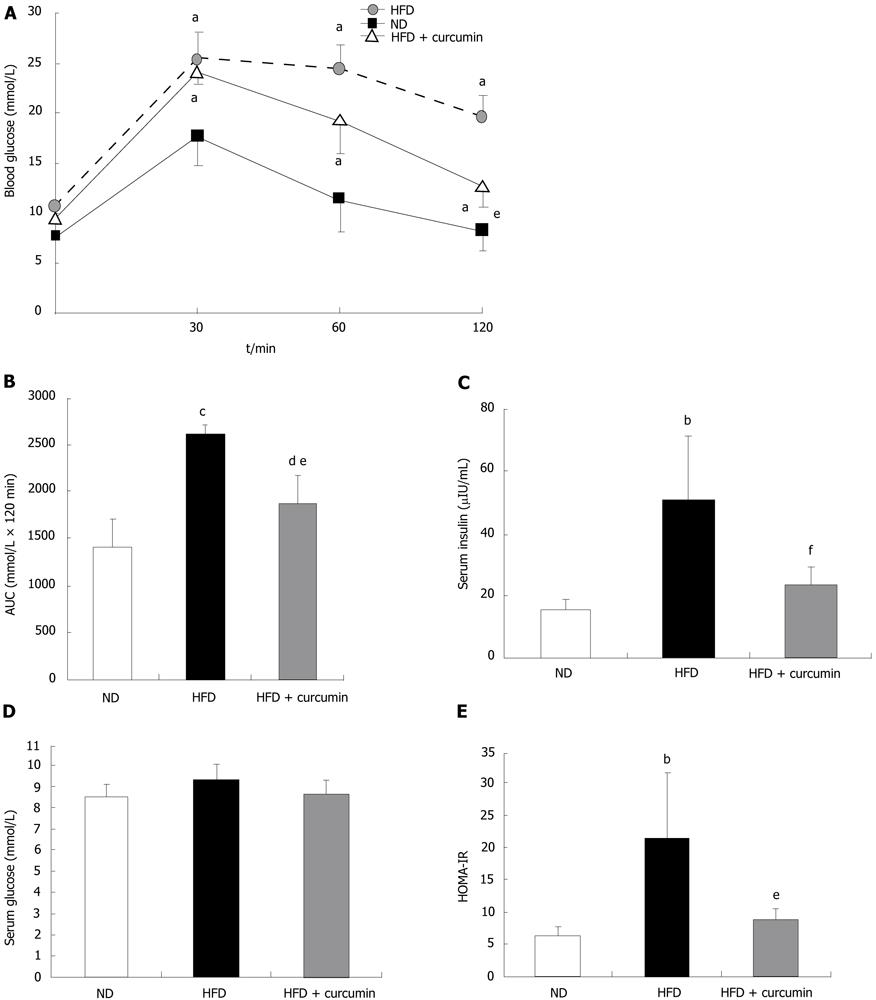
Figure 2 Effects of short term curcumin gavage on glucose tolerance and insulin sensitivity.
A: Intraperitoneal glucose tolerance test in the normal diet group (n = 10), high fat diet group (n = 6) and high fat diet plus curcumin group (n = 6); B: Area under the curve of glucose tolerance test; C: Area under the curve; D: Fasting plasma glucose levels; E: Homeostasis model assessment - insulin resistance index values. The mice were fed with different diets and gavaged with curcumin as indicated in Figure 1. At the end of 18 wk following normal diet (ND), high fat diet (HFD) and HFD+curcumin treatments, intraperitoneal glucose tolerance test was performed and blood glucose levels were measured. aP < 0.001, HFD or HFD + curcumin vs ND at each time point; bP < 0.01, HFD vs ND; cP < 0.001, HFD vs ND; dP < 0.05, HFD + curcumin vs ND; eP < 0.01, HFD + curcumin vs HFD; fP < 0.05, HFD+curcumin vs HFD. AUC: Area under the curve; HOMA-IR: Homeostasis model assessment- insulin resistance index.
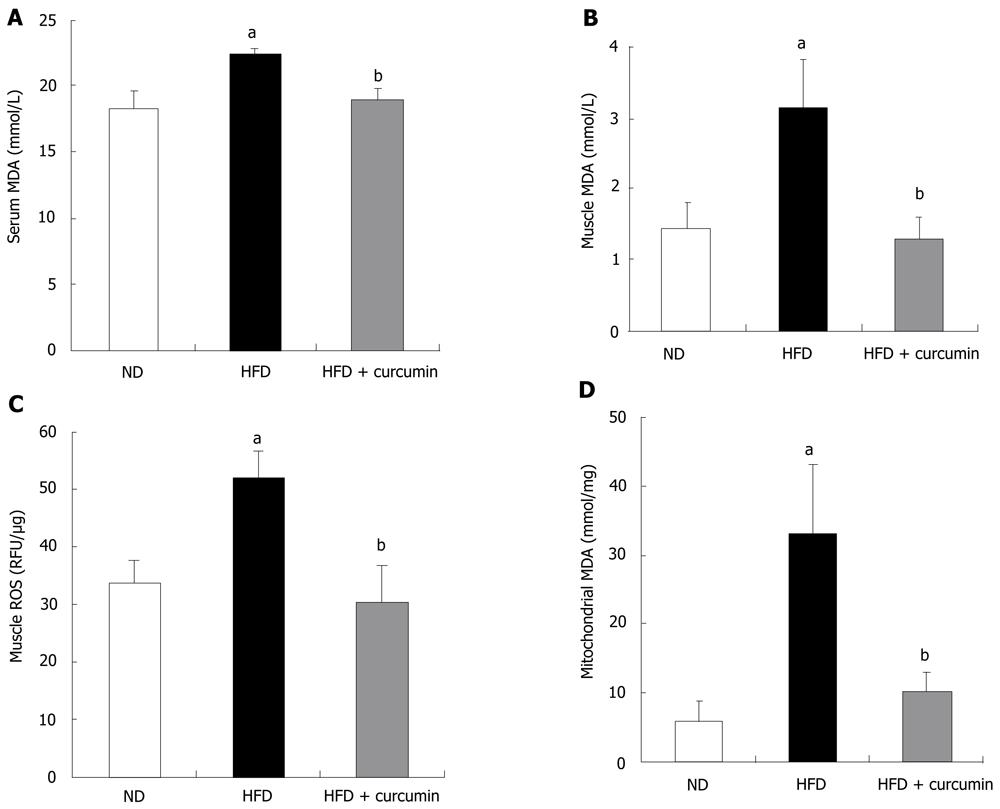
Figure 3 Effects of short term gavage of curcumin on malondialdehyde levels.
A: Serum malondialdehyde levels; B: Malondialdehyde levels in skeletal muscle; C: Reactive oxygen species level in whole cell lysates of skeletal muscle; D: Malondialdehyde levels in mitochondria of skeletal muscle. The mice were fed with indicated diets and gavaged with curcumin or vehicle. At the end of 18 wk following normal diet (ND, n = 10), high fat diet (HFD, n = 6) and HFD + curcumin (n = 6) treatments, the mice were sacrificed for blood and tissue collections. Serum was isolated, tissues were homogenized and mitochondria were isolated. Malondialdehyde assessments or reactive oxygen species assay were performed as described in “Materials and Methods”. aP < 0.001, HFD vs ND; bP < 0.001 HFD + curcumin vs HFD; cP < 0.01, HFD + curcumin vs HFD. MDA: Malondialdehyde; ROS: Reactive oxygen species.
Figure 4 Effects of curcumin on adipose and liver malondialdehyde levels.
A: Malondialdehyde levels in adipose tissue; B: Malondialdehyde levels in liver. The mice were fed with indicated diets and gavaged with curcumin or vehicle. At the end of 18 wk following normal diet (ND, n = 10), high fat diet (HFD, n = 6) and HFD + curcumin (n = 6) treatments, the mice were sacrificed, tissues were homogenized and malondialdehyde levels were measured as indicated in the “Materials and Methods”. aP < 0.001, HFD or HFD+curcumin vs ND. MDA: Malondialdehyde.
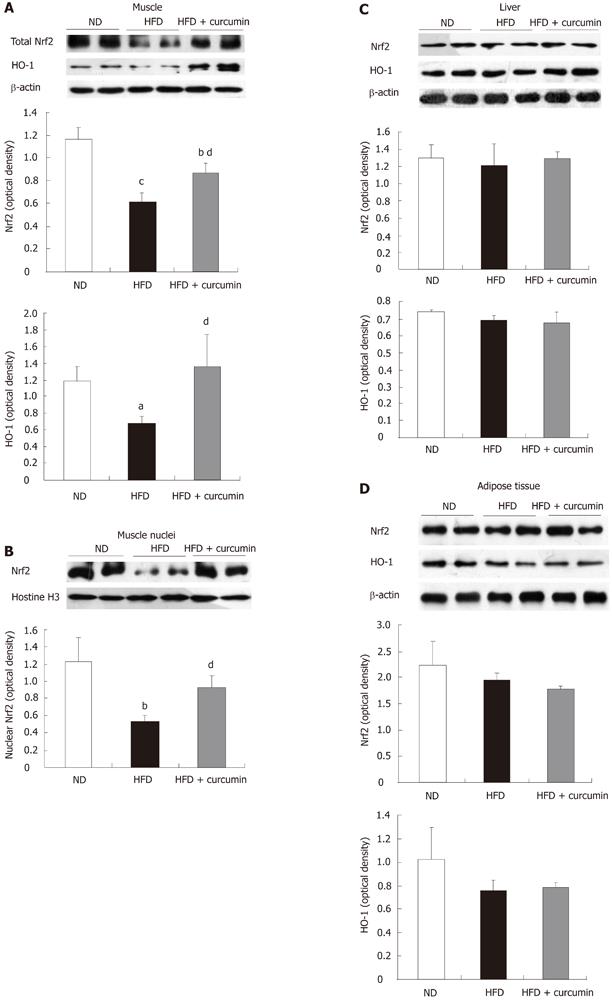
Figure 5 Effects of curcumin on nuclear factor erythroid-2-related factor-2 signaling.
A: The protein levels of nuclear factor erythroid-2-related factor-2 (Nrf2), heme oxygenase-1 (HO-1) in skeletal muscle (β-actin as the loading control of total protein); B: Nuclear Nrf2 contents in skeletal muscle were probed with Nrf2 antibody (Histone H3 as the nuclear protein loading control). C, D: The levels of Nrf2 and HO-1 in livers were examined by western blotting. The analysis of relative optical density on western blots was presented in the lower panels or the right panel for corresponding figures. The mice were fed with indicated diets and gavaged with curcumin or vehicle. At the end of 18 wk, the mice were sacrificed and tissues were collected for protein or nuclear preparation. Western blotting was performed with indicated antibodies. aP < 0.05, bP < 0.01, cP < 0.001, HFD or HFD+curcumin vs ND; dP < 0.05, HFD + curcumin vs HFD. HFD: High fat diet; ND: normal diet.
- Citation: He HJ, Wang GY, Gao Y, Ling WH, Yu ZW, Jin TR. Curcumin attenuates Nrf2 signaling defect, oxidative stress in muscle and glucose intolerance in high fat diet-fed mice. World J Diabetes 2012; 3(5): 94-104
- URL: https://www.wjgnet.com/1948-9358/full/v3/i5/94.htm
- DOI: https://dx.doi.org/10.4239/wjd.v3.i5.94


