Copyright
©2012 Baishideng Publishing Group Co.
World J Diabetes. May 15, 2012; 3(5): 94-104
Published online May 15, 2012. doi: 10.4239/wjd.v3.i5.94
Published online May 15, 2012. doi: 10.4239/wjd.v3.i5.94
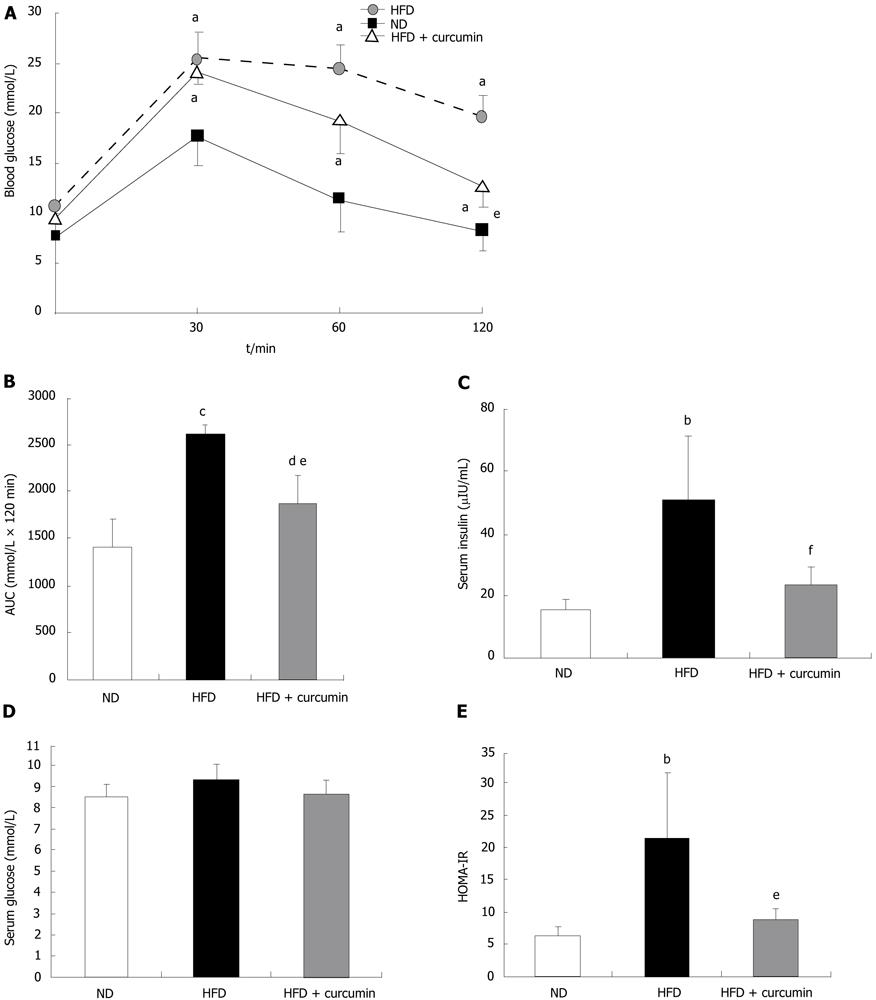
Figure 2 Effects of short term curcumin gavage on glucose tolerance and insulin sensitivity.
A: Intraperitoneal glucose tolerance test in the normal diet group (n = 10), high fat diet group (n = 6) and high fat diet plus curcumin group (n = 6); B: Area under the curve of glucose tolerance test; C: Area under the curve; D: Fasting plasma glucose levels; E: Homeostasis model assessment - insulin resistance index values. The mice were fed with different diets and gavaged with curcumin as indicated in Figure 1. At the end of 18 wk following normal diet (ND), high fat diet (HFD) and HFD+curcumin treatments, intraperitoneal glucose tolerance test was performed and blood glucose levels were measured. aP < 0.001, HFD or HFD + curcumin vs ND at each time point; bP < 0.01, HFD vs ND; cP < 0.001, HFD vs ND; dP < 0.05, HFD + curcumin vs ND; eP < 0.01, HFD + curcumin vs HFD; fP < 0.05, HFD+curcumin vs HFD. AUC: Area under the curve; HOMA-IR: Homeostasis model assessment- insulin resistance index.
- Citation: He HJ, Wang GY, Gao Y, Ling WH, Yu ZW, Jin TR. Curcumin attenuates Nrf2 signaling defect, oxidative stress in muscle and glucose intolerance in high fat diet-fed mice. World J Diabetes 2012; 3(5): 94-104
- URL: https://www.wjgnet.com/1948-9358/full/v3/i5/94.htm
- DOI: https://dx.doi.org/10.4239/wjd.v3.i5.94


