















Copyright: ©Author(s) 2026.
World J Diabetes. Nov 15, 2026; 17(11): 124291
Published online Nov 15, 2026. doi: 10.4239/wjd.124291
Published online Nov 15, 2026. doi: 10.4239/wjd.124291
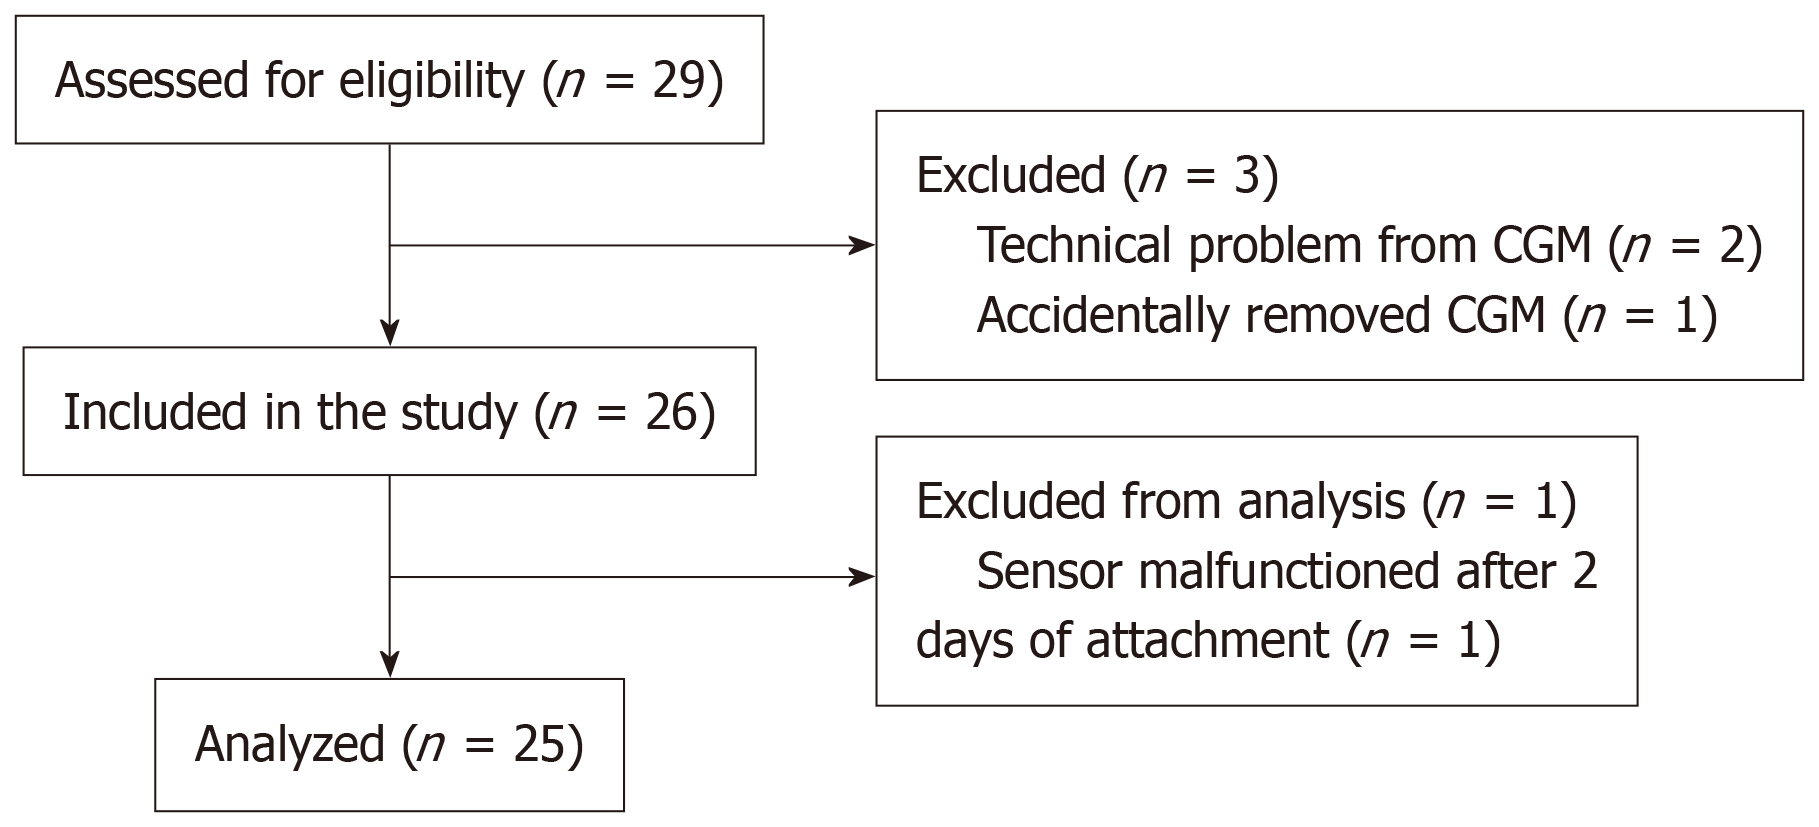
Figure 1 Flow of participants through the study.
CGM: Continuous glucose monitoring.
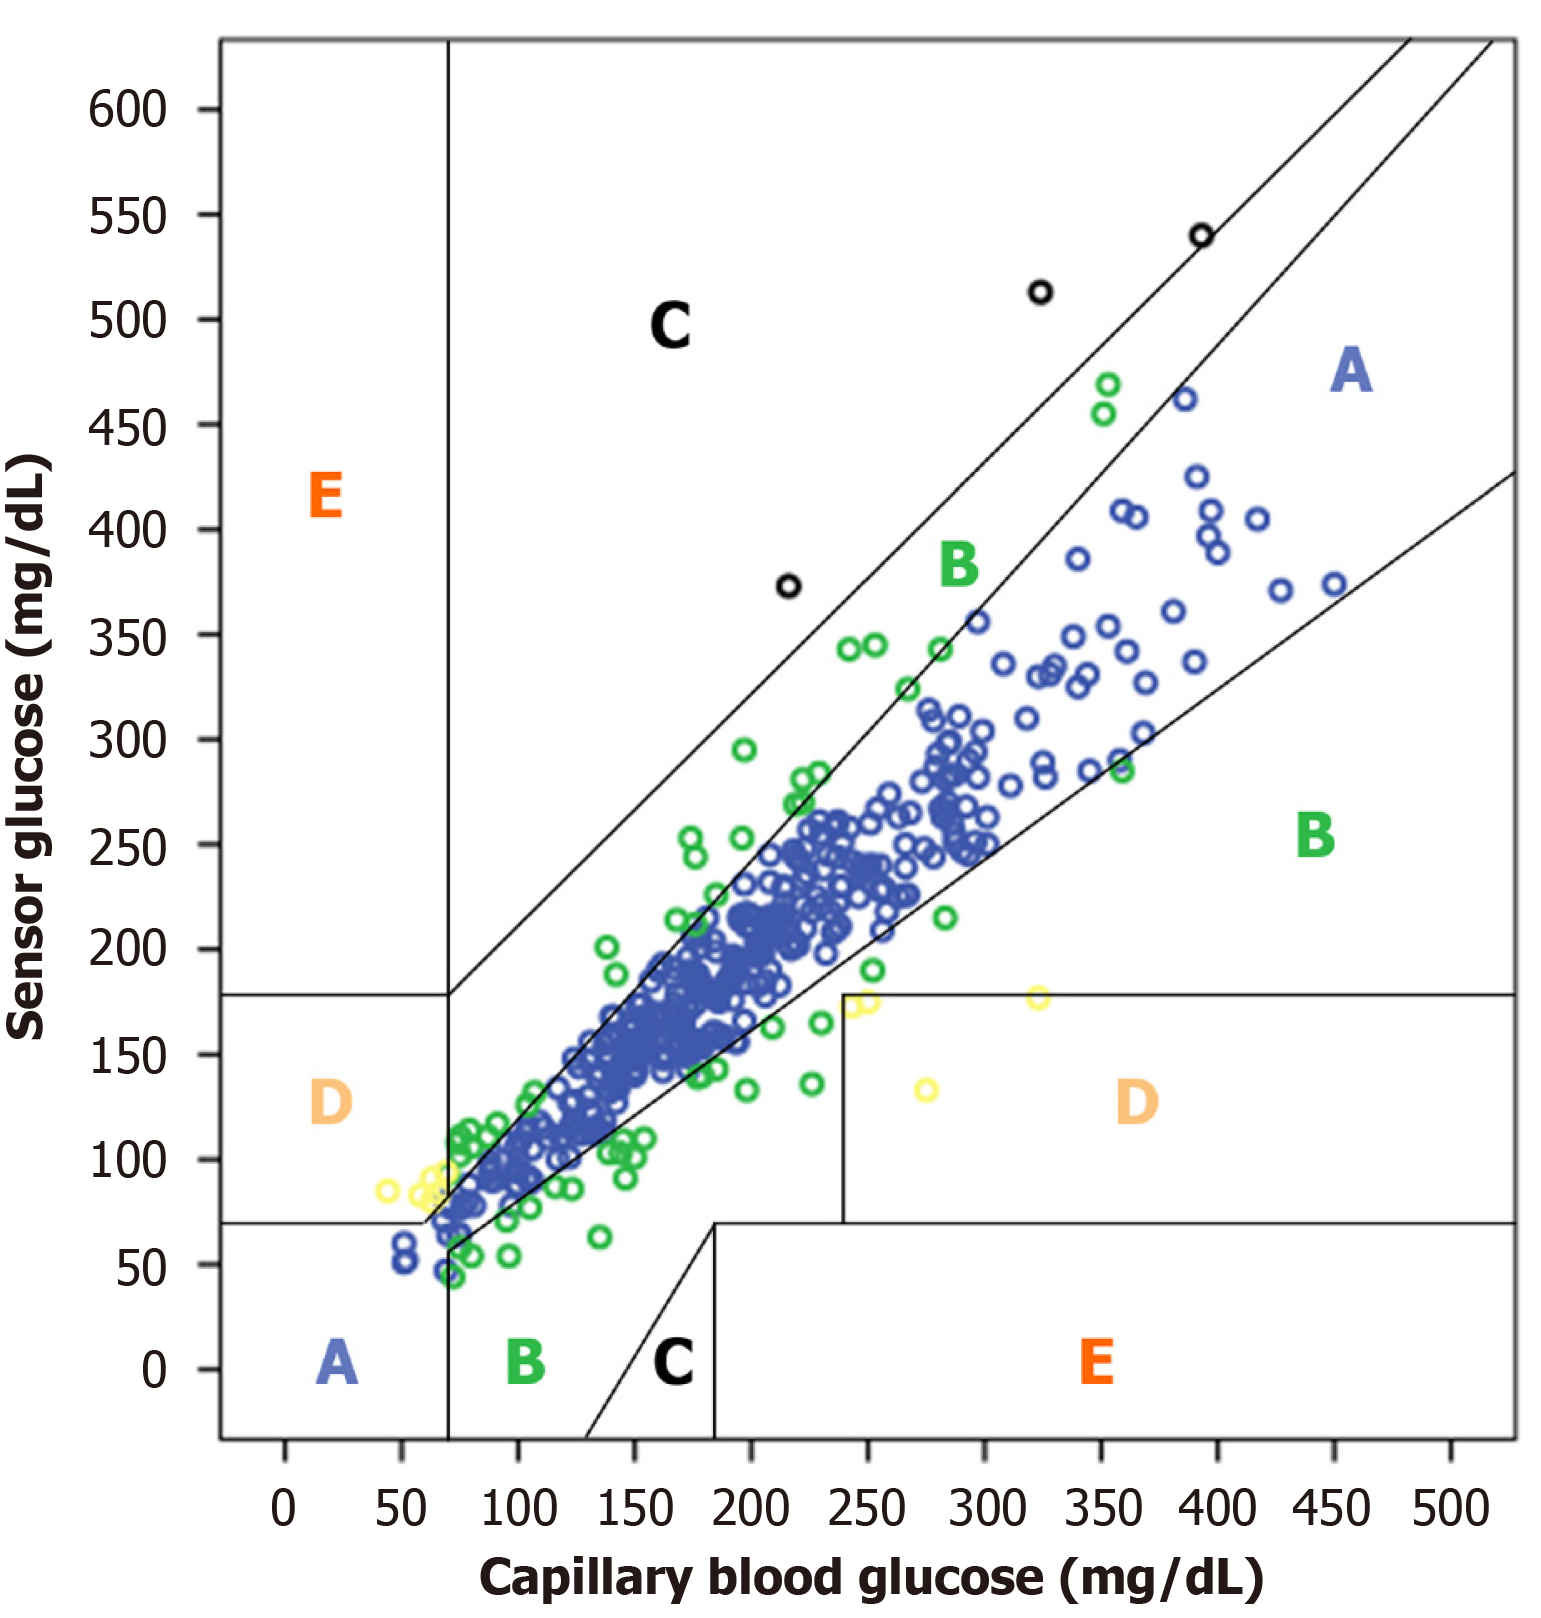
Figure 2 Clarke Error Grid Analysis of paired sensor glucose and capillary blood glucose measurements.
The paired sensor glucose and capillary blood glucose measurements were stratified into five zones. Overall, 96.7% of data points fell within zones A and B, which are considered clinically acceptable. Overcorrection of high glucose levels occurred in 0.8% of measurements (zone C). Failure to detect hypoglycemia and hyperglycemia occurred in 1.5% and 1.0% of measurements, respectively (zone D). No erroneous measurements were observed (zone E).
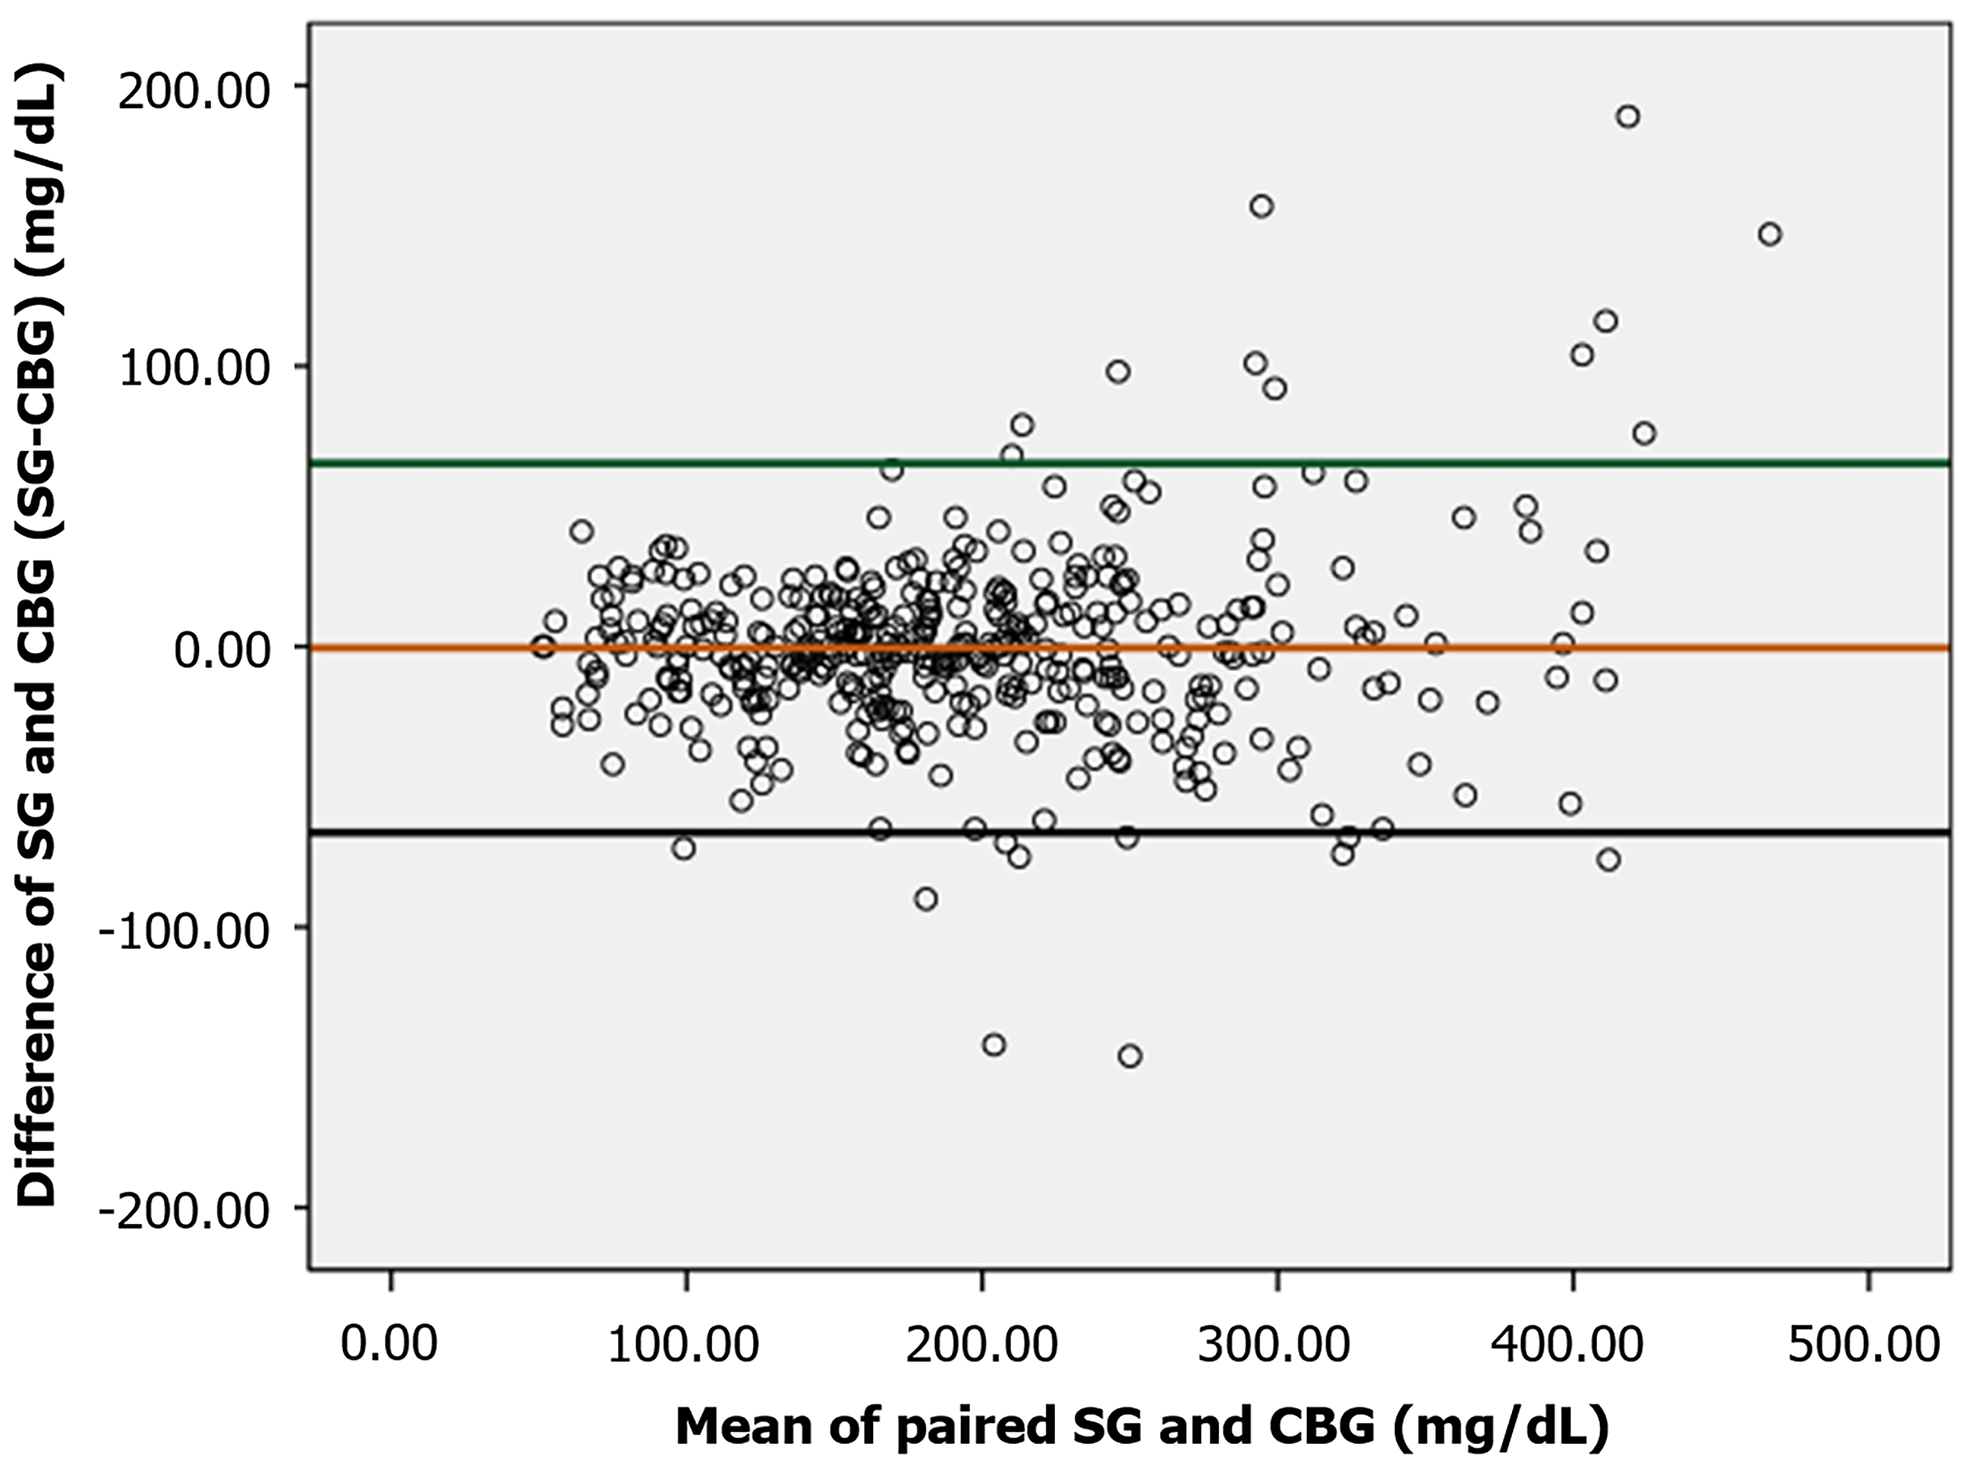
Figure 3 Bland-Altman plot of paired sensor glucose and capillary blood glucose measurements.
Each point represents one paired measurement. The horizontal axis shows the mean of sensor glucose (SG) and capillary blood glucose (CBG), and the vertical axis shows their difference (SG-CBG), both in mg/dL. The mean difference was -0.5 mg/dL, and the 95% limits of agreement were -66.3 mg/dL and 65.3 mg/dL. CBG: Capillary blood glucose; SG: Sensor glucose.
- Citation: Sirinvaravong S, Sakjirapapong C, Preechasuk L, Thongtang N. Accuracy and feasibility of initiating real-time continuous glucose monitoring in noncritically ill hospitalized patients with type 2 diabetes. World J Diabetes 2026; 17(11): 124291
- URL: https://www.wjgnet.com/1948-9358/full/v17/i11/124291.htm
- DOI: https://dx.doi.org/10.4239/wjd.124291