















Copyright: ©Author(s) 2026.
World J Diabetes. Nov 15, 2026; 17(11): 124291
Published online Nov 15, 2026. doi: 10.4239/wjd.124291
Published online Nov 15, 2026. doi: 10.4239/wjd.124291
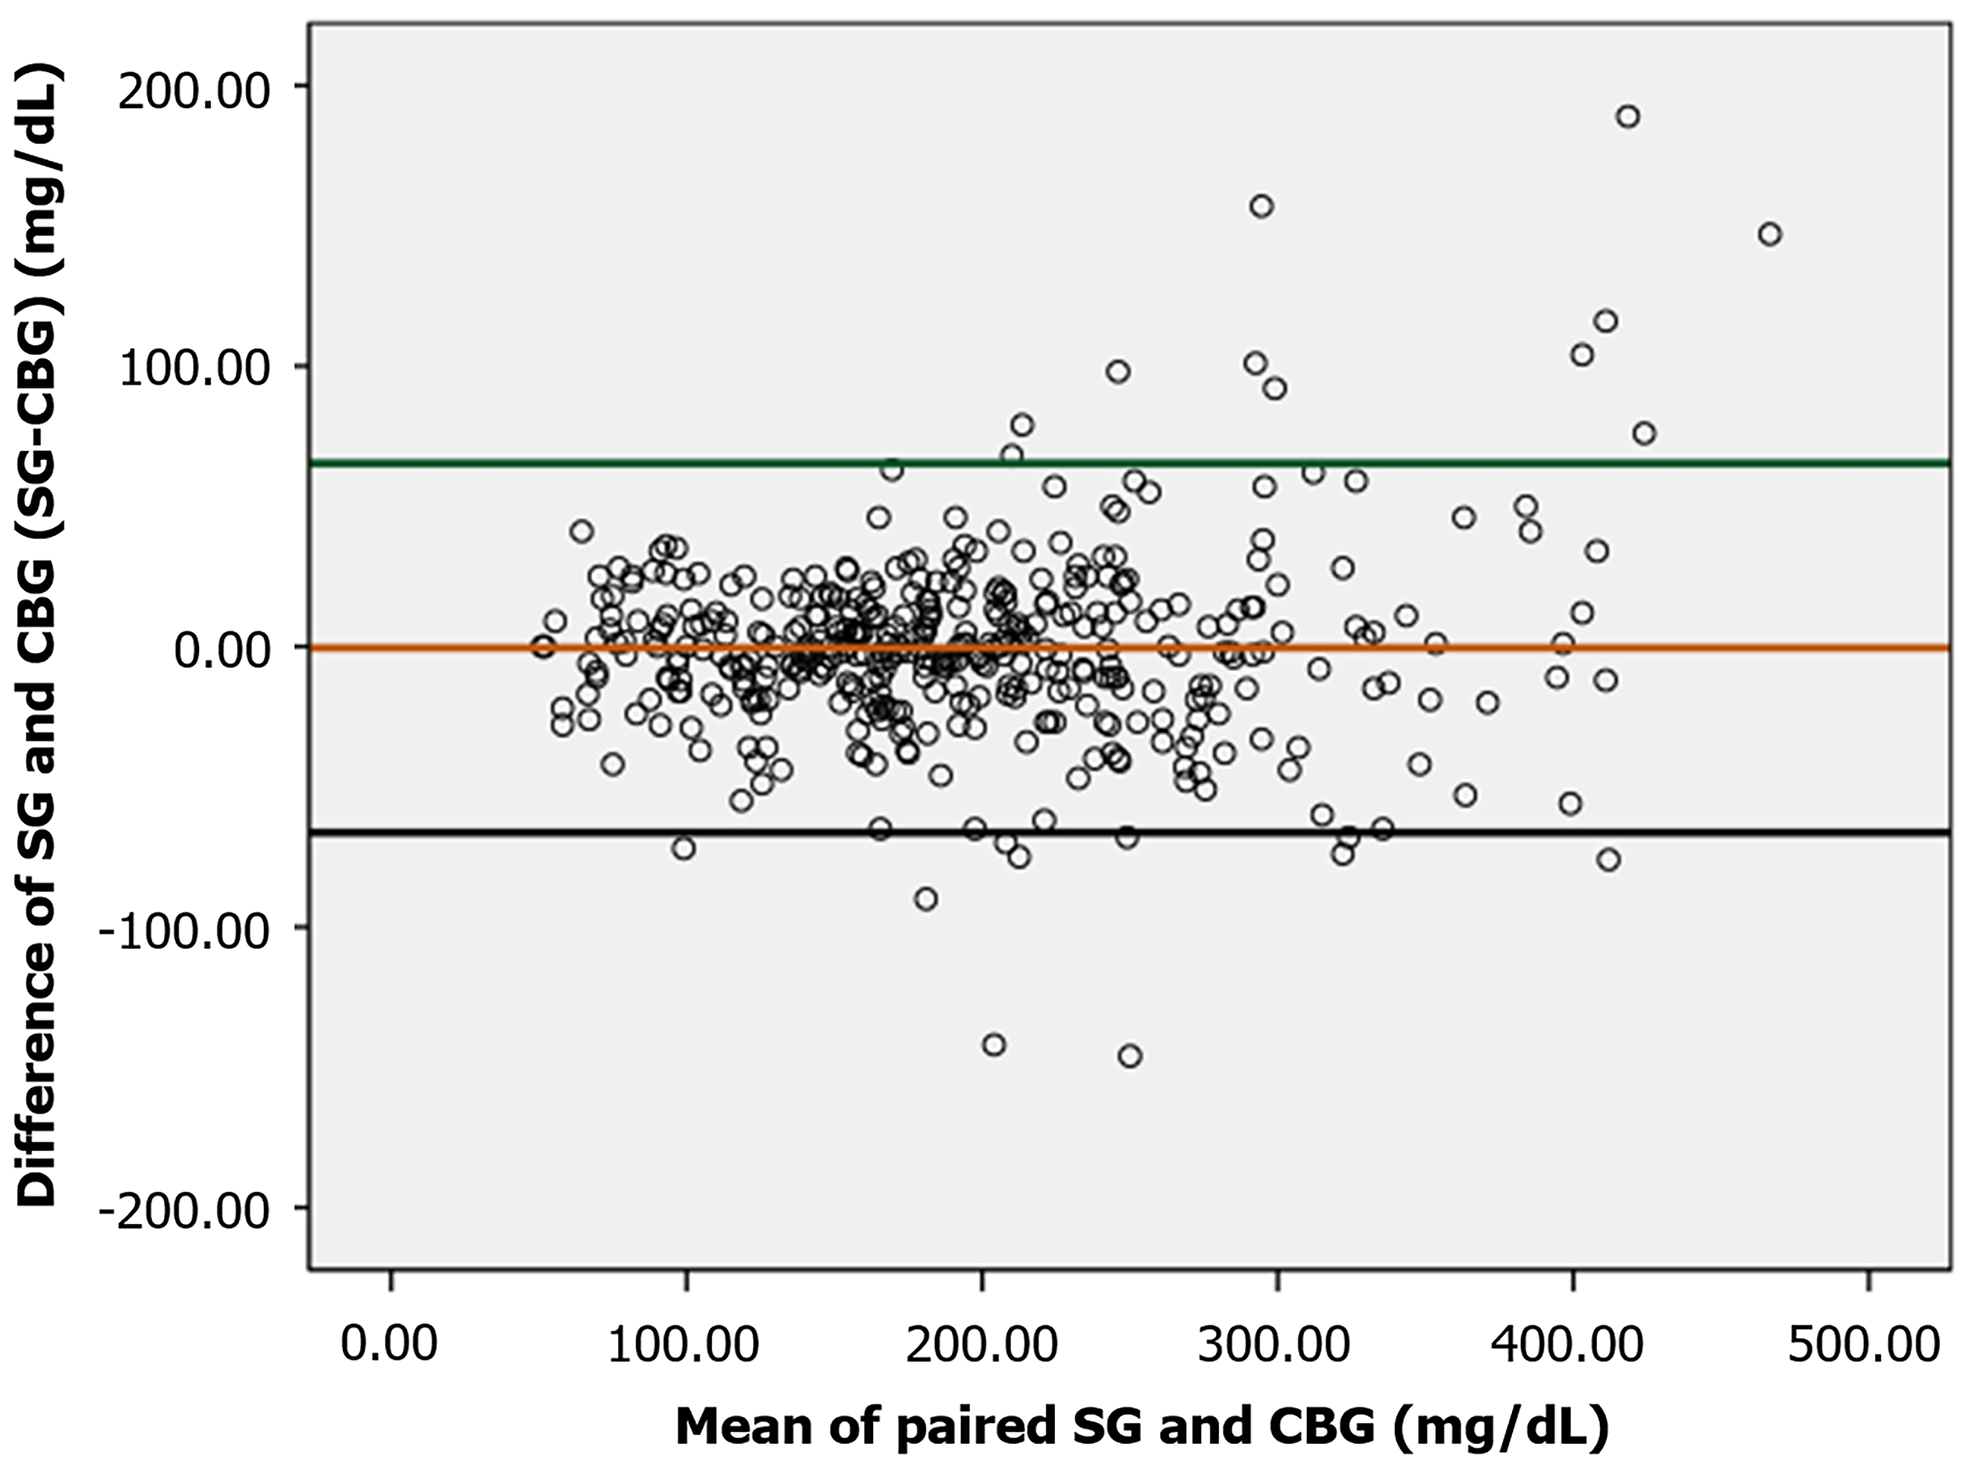
Figure 3 Bland-Altman plot of paired sensor glucose and capillary blood glucose measurements.
Each point represents one paired measurement. The horizontal axis shows the mean of sensor glucose (SG) and capillary blood glucose (CBG), and the vertical axis shows their difference (SG-CBG), both in mg/dL. The mean difference was -0.5 mg/dL, and the 95% limits of agreement were -66.3 mg/dL and 65.3 mg/dL. CBG: Capillary blood glucose; SG: Sensor glucose.
- Citation: Sirinvaravong S, Sakjirapapong C, Preechasuk L, Thongtang N. Accuracy and feasibility of initiating real-time continuous glucose monitoring in noncritically ill hospitalized patients with type 2 diabetes. World J Diabetes 2026; 17(11): 124291
- URL: https://www.wjgnet.com/1948-9358/full/v17/i11/124291.htm
- DOI: https://dx.doi.org/10.4239/wjd.124291