Copyright
©The Author(s) 2025.
World J Diabetes. Jul 15, 2025; 16(7): 107256
Published online Jul 15, 2025. doi: 10.4239/wjd.v16.i7.107256
Published online Jul 15, 2025. doi: 10.4239/wjd.v16.i7.107256
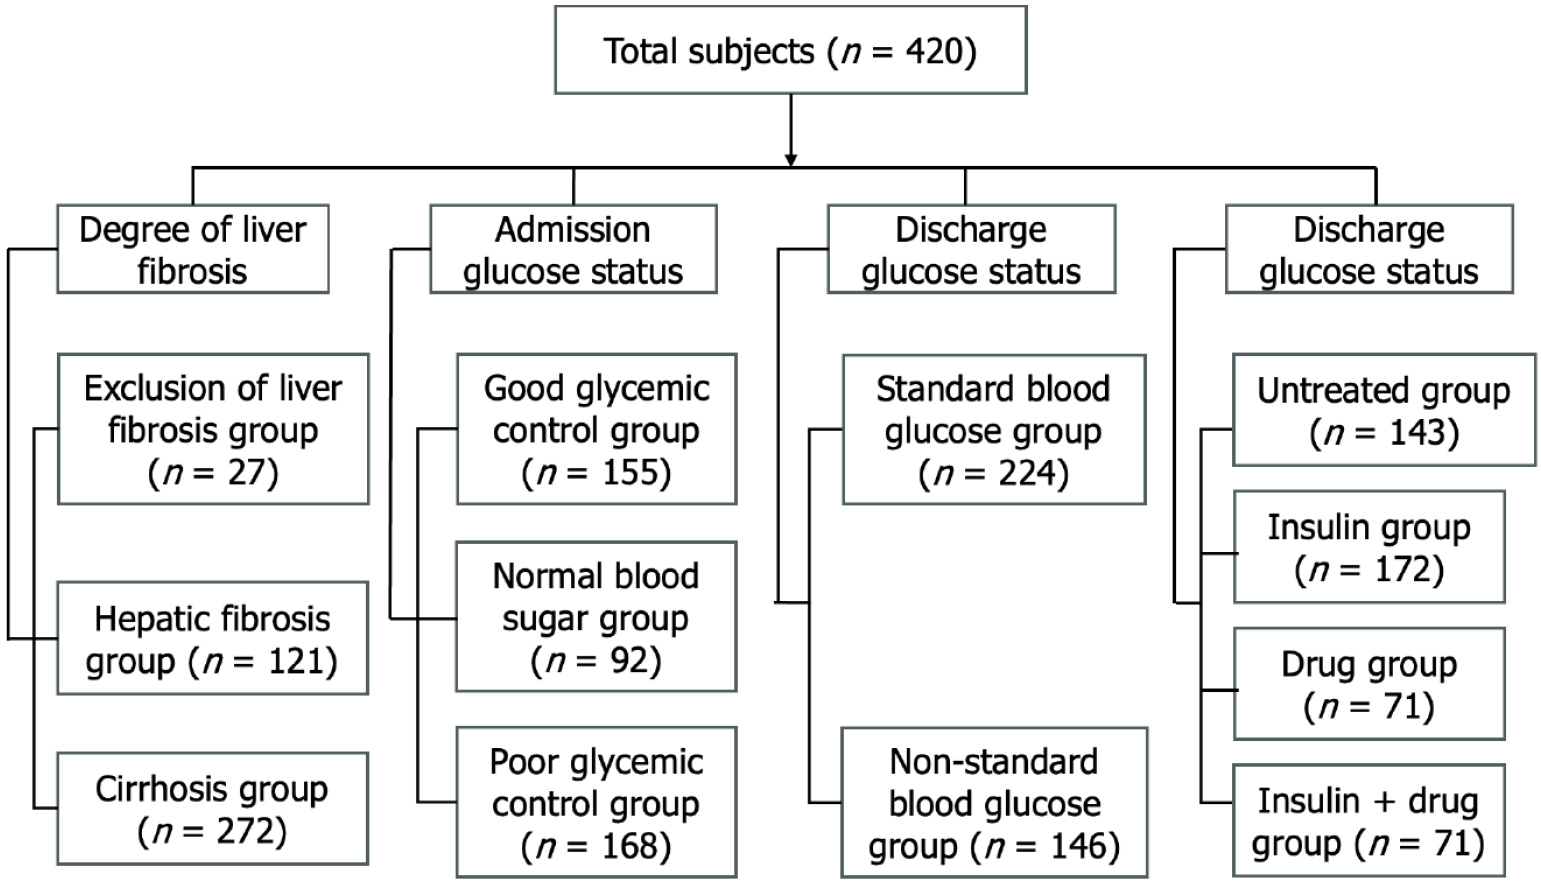
Figure 1 Patient categorization according to liver stiffness measurement and glycemic control.
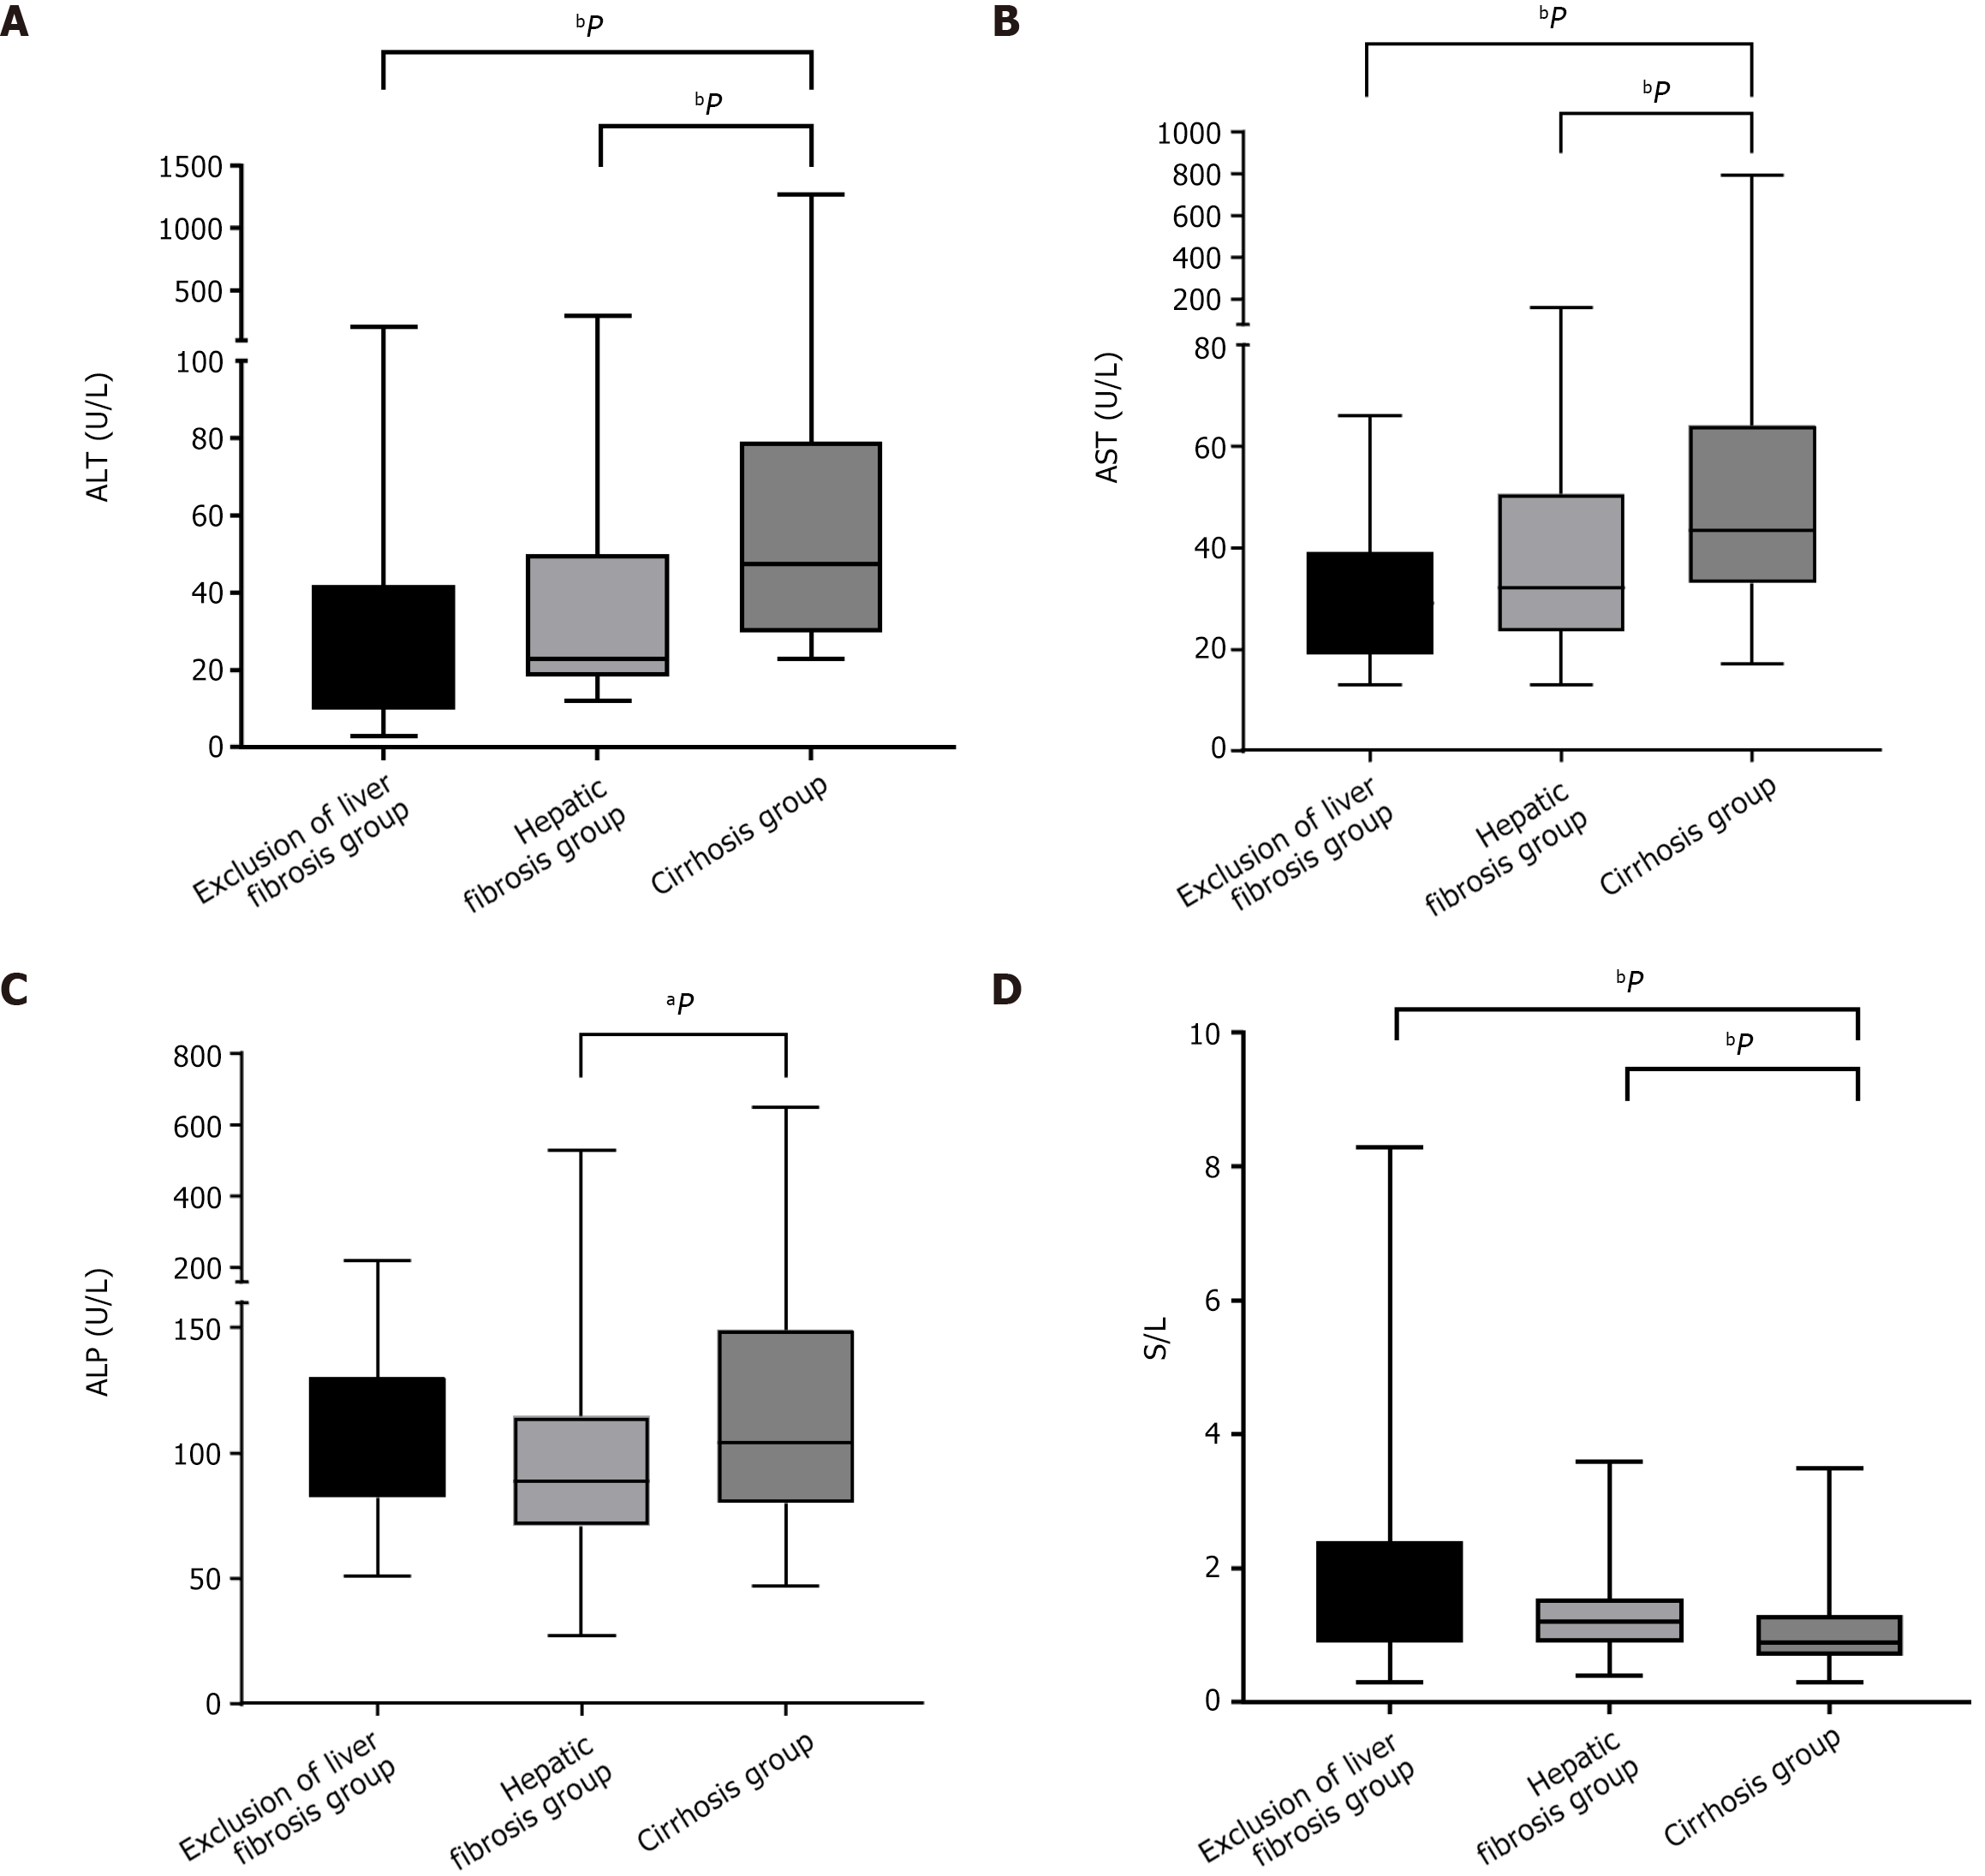
Figure 2 Pair-wise comparisons among groups with differing fibrosis status (total n = 420, no fibrosis group n = 27, liver fibrosis group n = 121, and cirrhosis group n = 272).
A: Alanine aminotransferase; B: Aspartate aminotransferase; C: Alkaline phosphatase; D: Aspartate aminotran
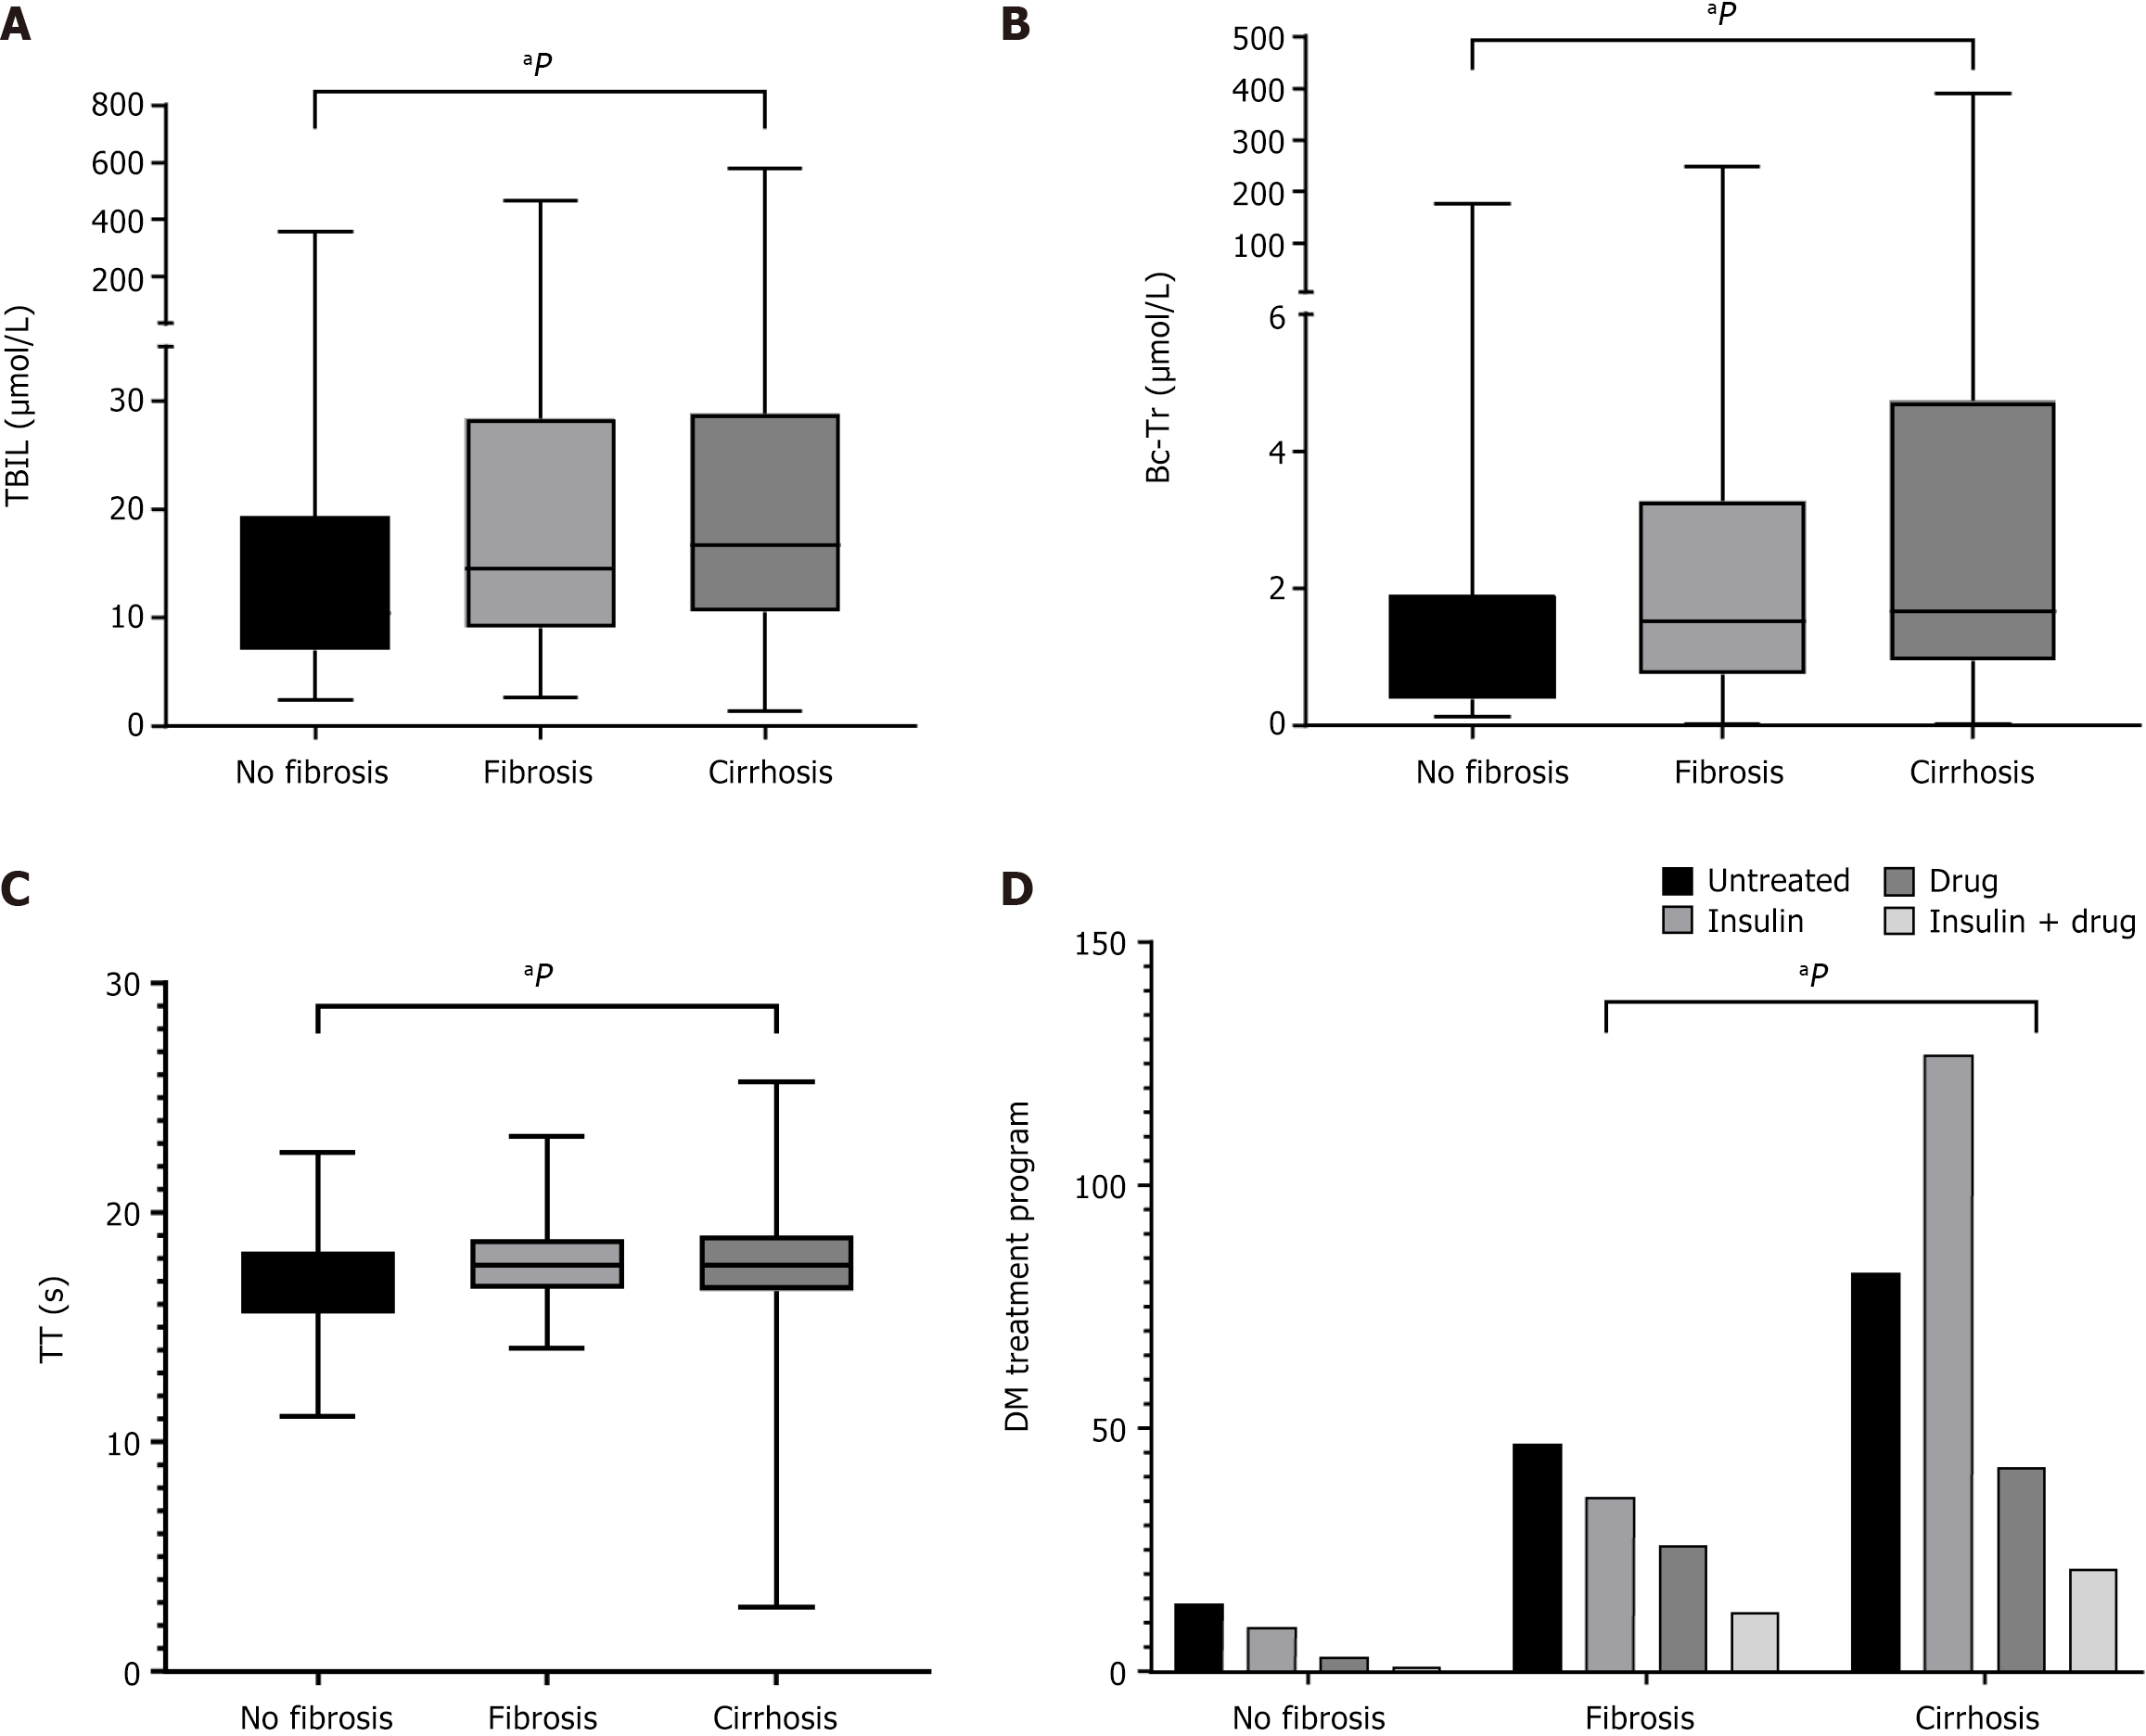
Figure 3 Pairwise comparisons among those with differing fibrosis status (total n = 420, no fibrosis group n = 27, liver fibrosis group n = 121, and cirrhosis group n = 272).
A: Total bilirubin; B: True conjugated bilirubin; C: Thrombin time; D: Diabetes mellitus treatment program. The Wilcoxon rank-sum test was used for intergroup comparisons of total bilirubin, true conjugated bilirubin and thrombin time, and the χ2 test was used for intergroup comparisons of the diabetes mellitus regimens. TBIL: Total bilirubin; Bc-Tr: True conjugated bilirubin; TT: Thrombin time; DM: Diabetes mellitus. aP < 0.05.
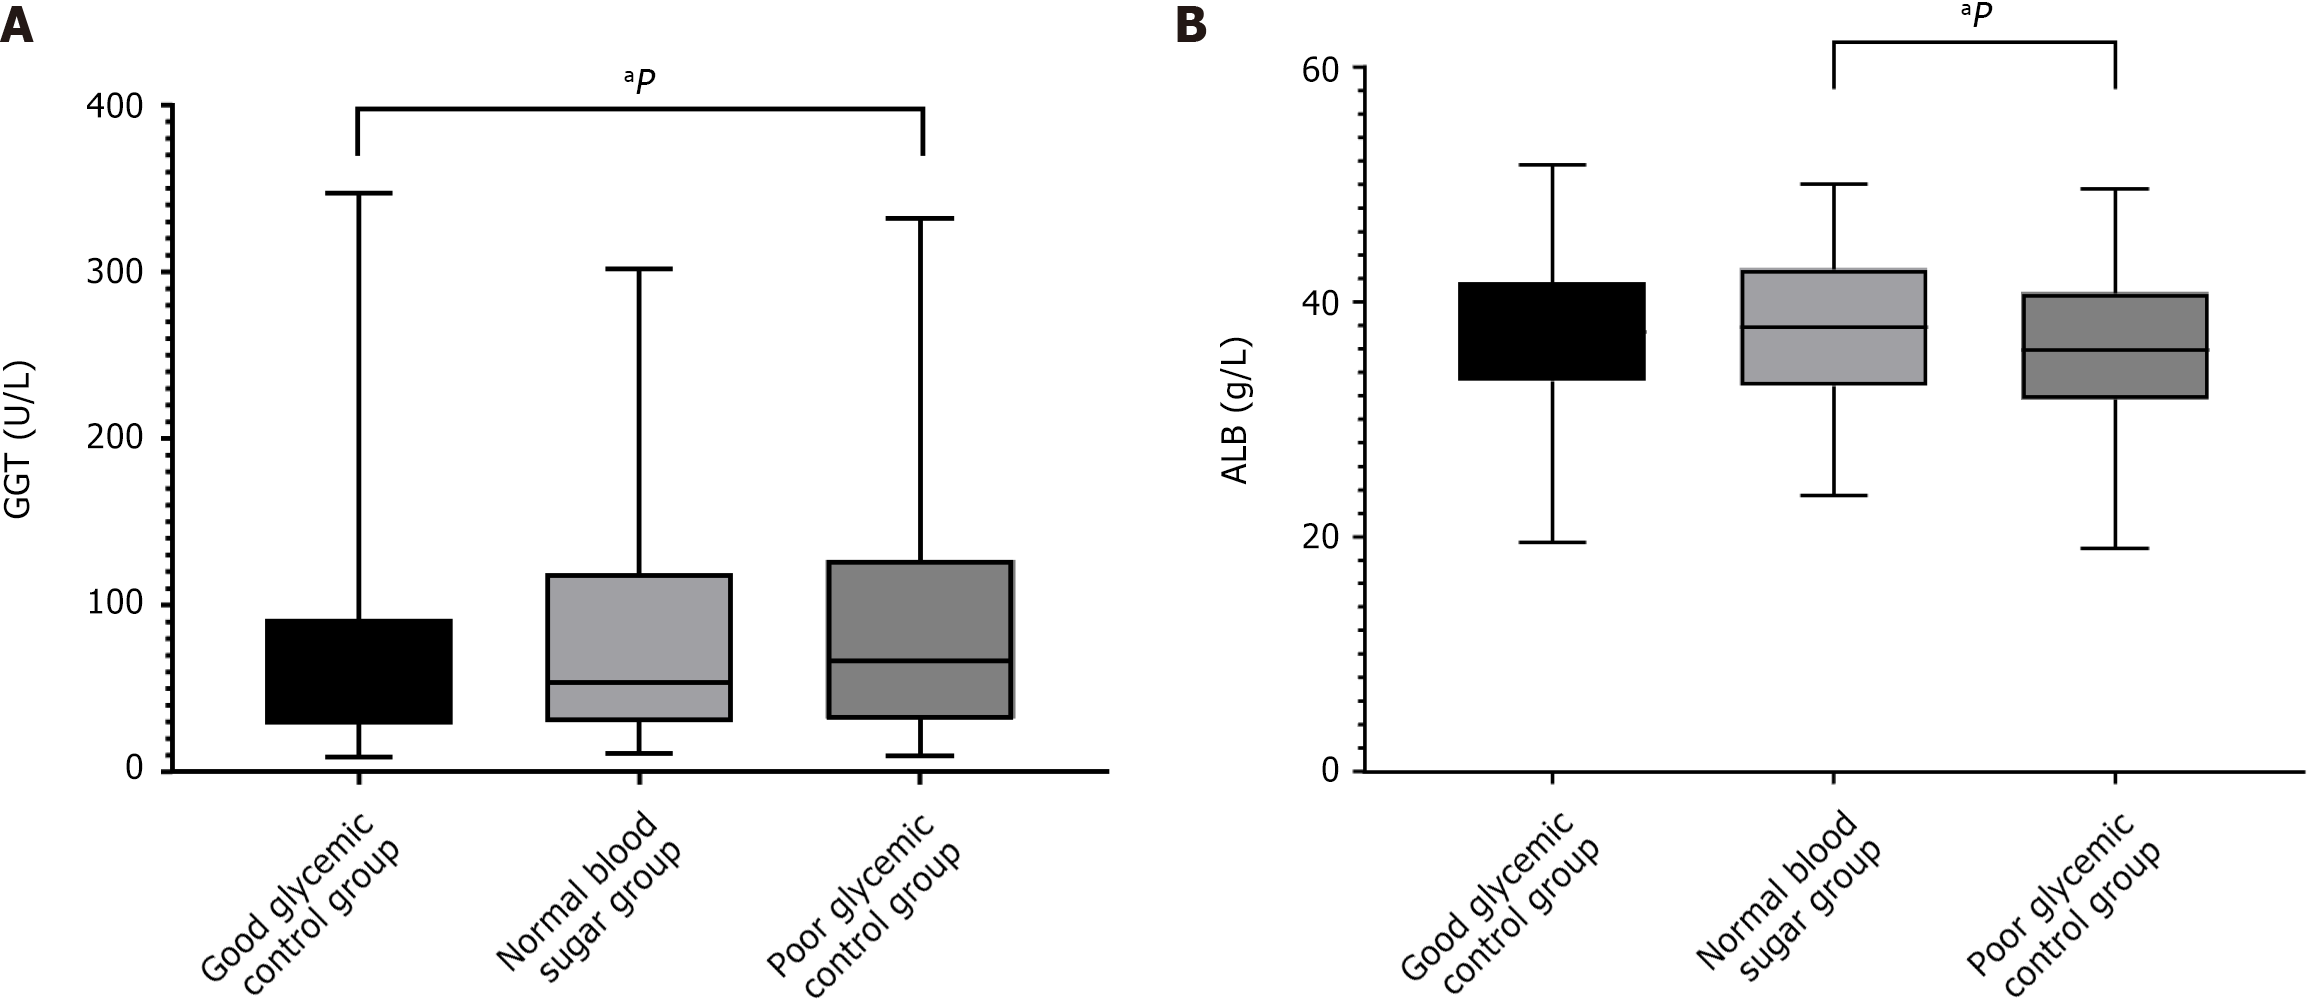
Figure 4 Pair-wise comparisons among groups with differing glycemic control status at admission (total n = 415, good glycemic control n = 155, moderate glycemic control n = 92, and poor glycemic control n = 168).
A: Gamma-glutamyl transferase; B: Albumin. The least significant difference method was used for intergroup comparisons of gamma-glutamyl transferase, and the Wilcoxon rank-sum test was used for intergroup comparisons of albumin. GGT: Gamma-glutamyl transferase; ALB: Albumin. aP < 0.05.
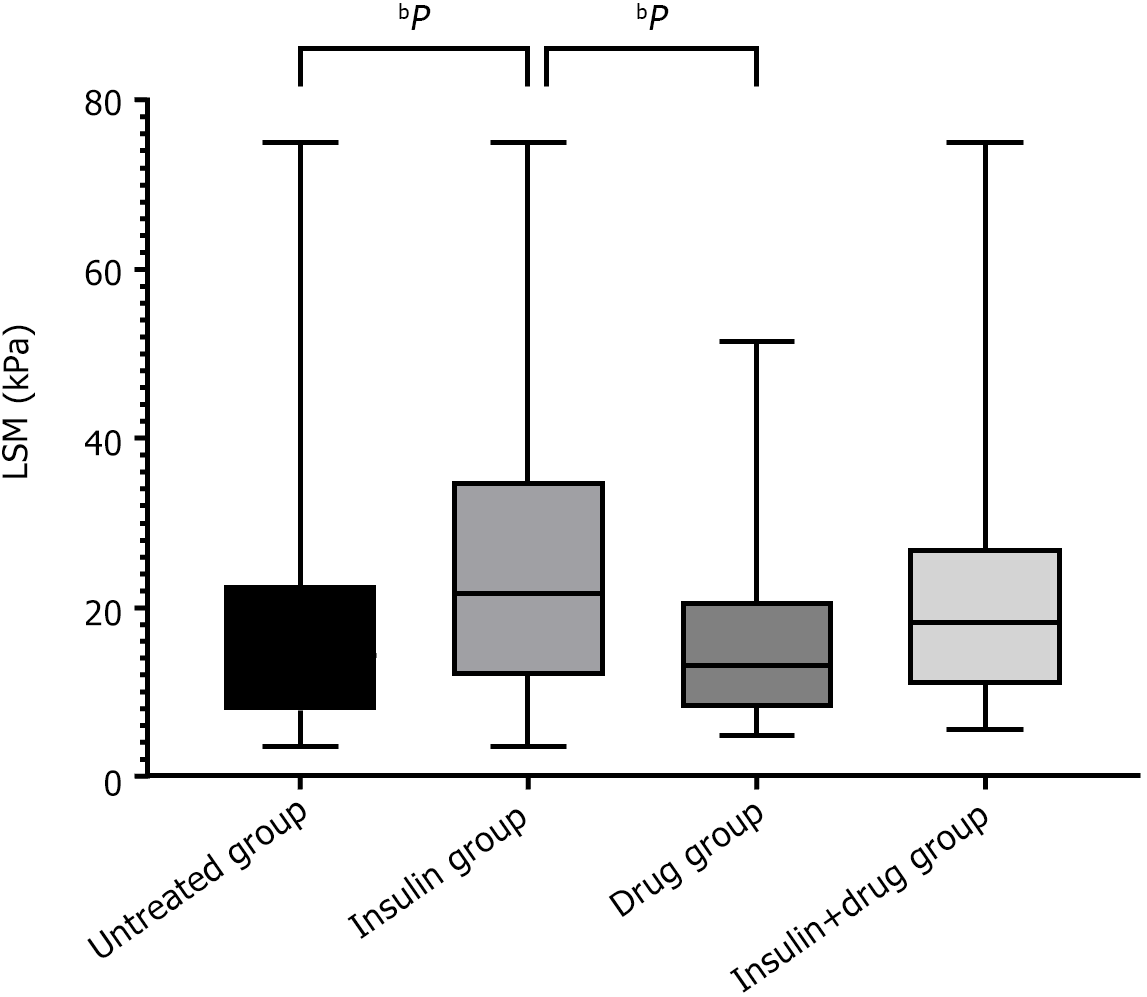
Figure 5 Pair-wise comparisons of groups receiving different diabetes mellitus treatment regimens (total n = 420, untreated group n = 143, insulin group n = 172, drug group n = 71, and insulin + drug group n = 34).
The Wilcoxon rank sum test was used. LSM: Liver stiffness measurement. bP < 0.001.
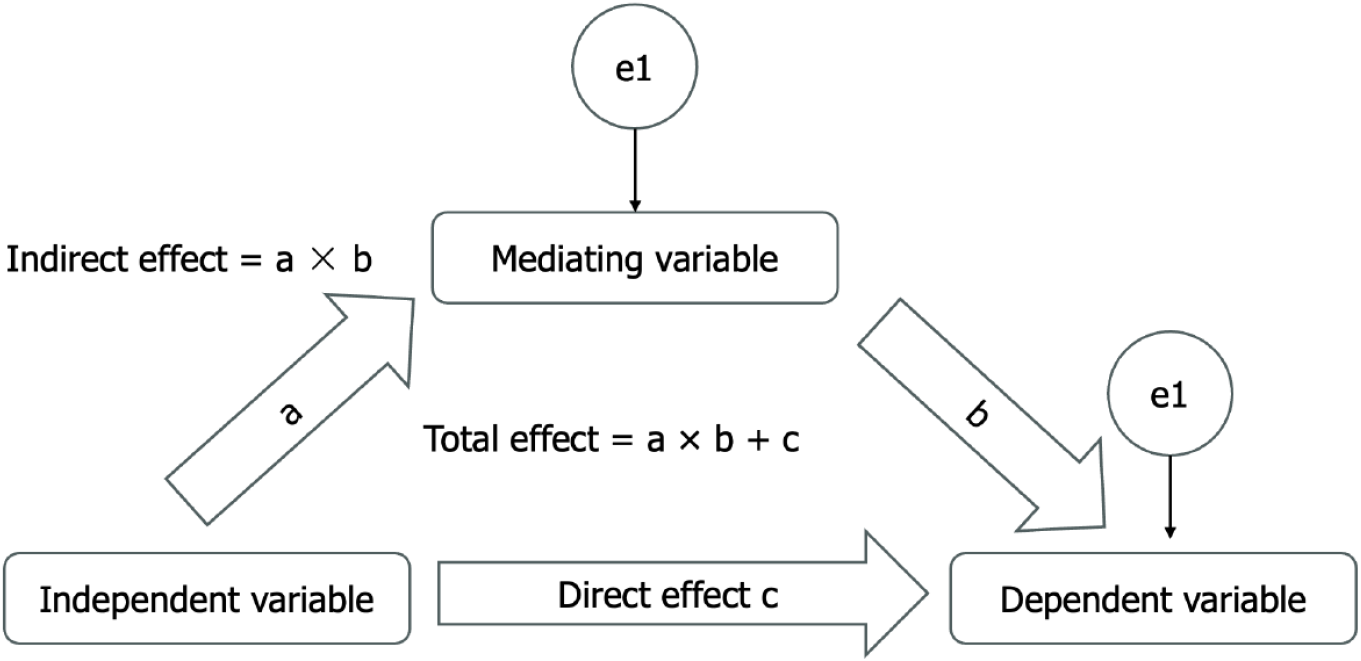
Figure 6 Schematic of the analysis of the mediating effects of independent, mediating, and dependent variables.
a: Regression coefficients for the effect of independent variables on the mediating variables; b: Regression coefficient for the effect of the mediating variable on the dependent variable; c: Total effect of the independent variable on the dependent variable without considering the mediating variable; e1: Residual.
- Citation: Luo Y, Li R, Kang J, Zhao BN, Lan LJ, Gao FJ, Ren XX, Zhu YF, Liu DF. Chronic hepatitis B with type 2 diabetes mellitus: Association between glycemic control and liver fibrosis. World J Diabetes 2025; 16(7): 107256
- URL: https://www.wjgnet.com/1948-9358/full/v16/i7/107256.htm
- DOI: https://dx.doi.org/10.4239/wjd.v16.i7.107256


