Copyright
©The Author(s) 2025.
World J Diabetes. Jul 15, 2025; 16(7): 107256
Published online Jul 15, 2025. doi: 10.4239/wjd.v16.i7.107256
Published online Jul 15, 2025. doi: 10.4239/wjd.v16.i7.107256
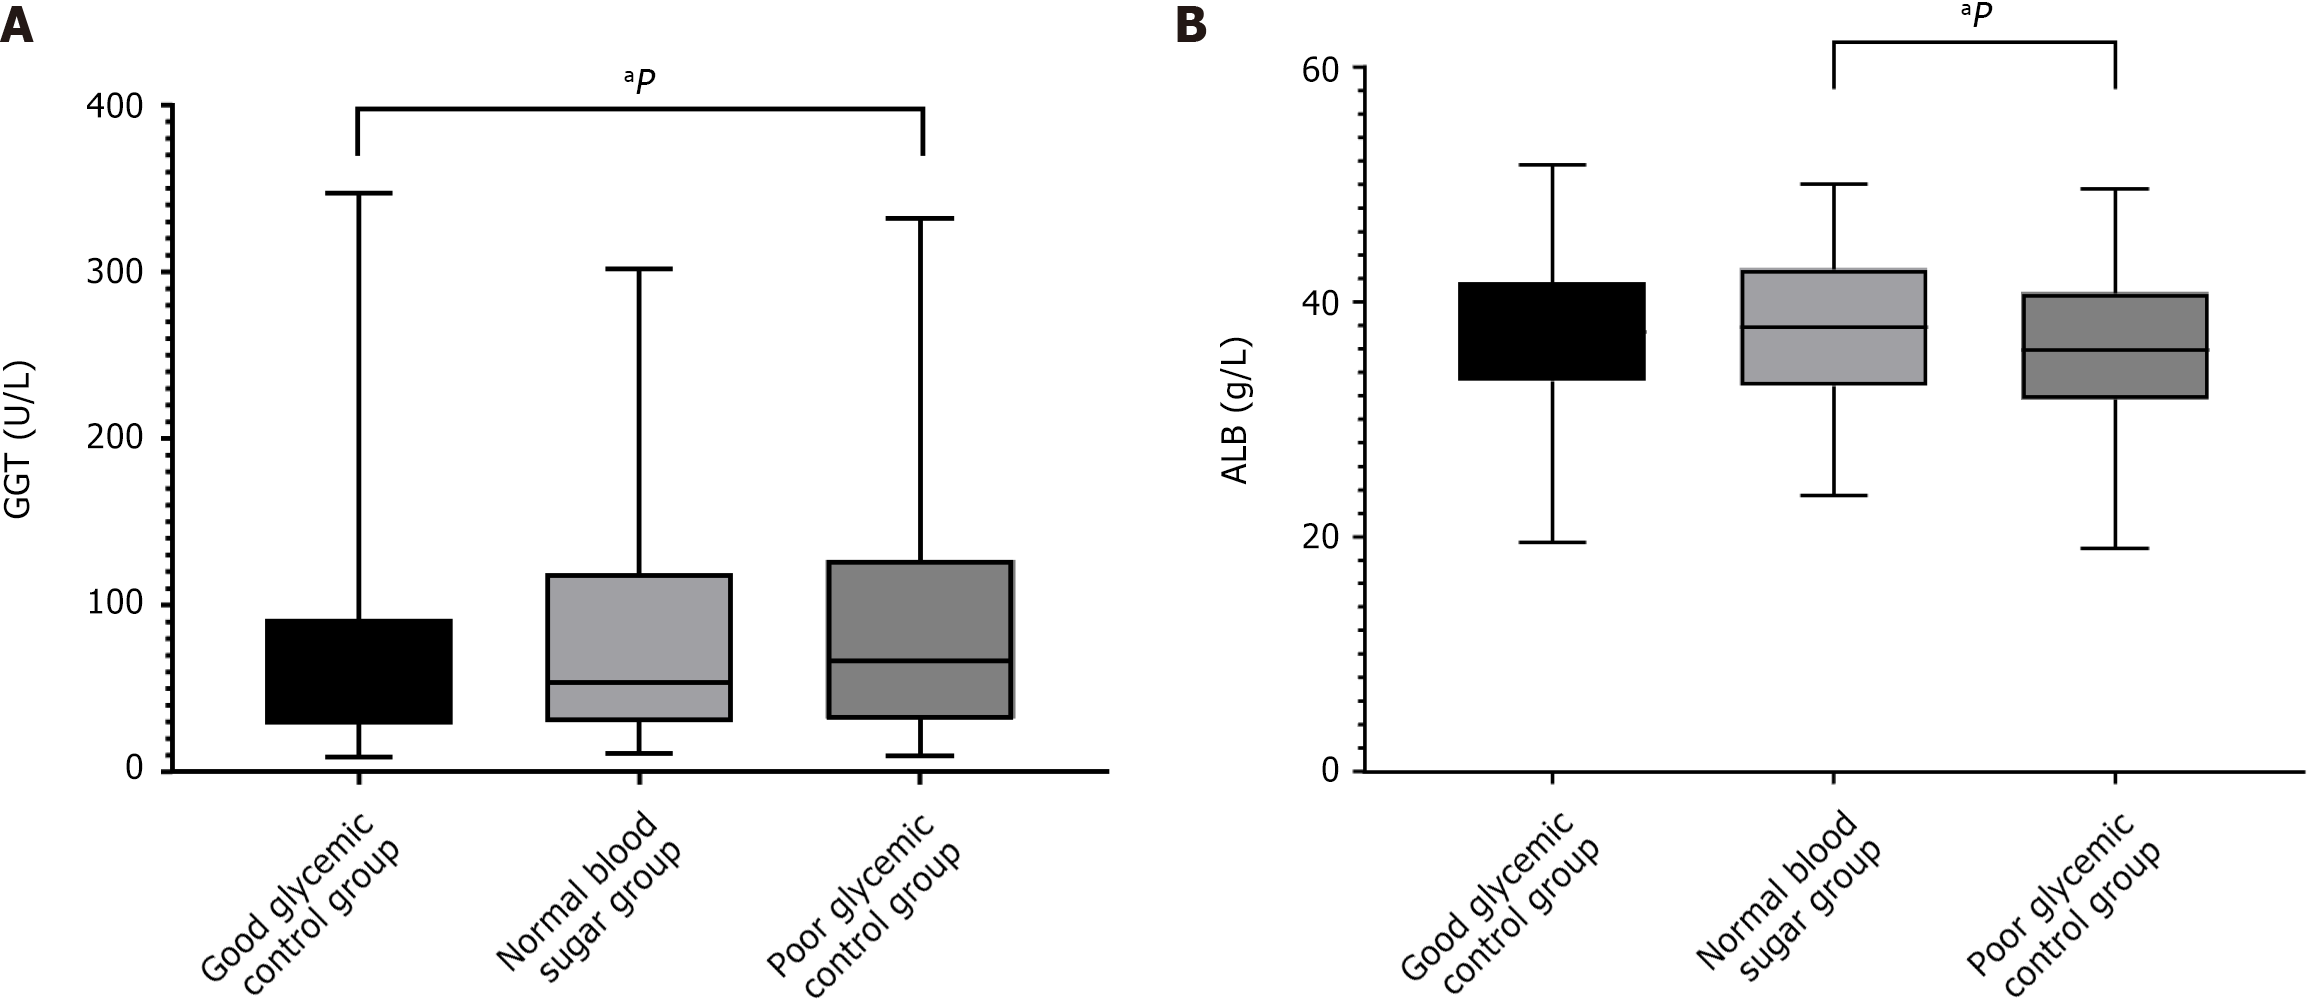
Figure 4 Pair-wise comparisons among groups with differing glycemic control status at admission (total n = 415, good glycemic control n = 155, moderate glycemic control n = 92, and poor glycemic control n = 168).
A: Gamma-glutamyl transferase; B: Albumin. The least significant difference method was used for intergroup comparisons of gamma-glutamyl transferase, and the Wilcoxon rank-sum test was used for intergroup comparisons of albumin. GGT: Gamma-glutamyl transferase; ALB: Albumin. aP < 0.05.
- Citation: Luo Y, Li R, Kang J, Zhao BN, Lan LJ, Gao FJ, Ren XX, Zhu YF, Liu DF. Chronic hepatitis B with type 2 diabetes mellitus: Association between glycemic control and liver fibrosis. World J Diabetes 2025; 16(7): 107256
- URL: https://www.wjgnet.com/1948-9358/full/v16/i7/107256.htm
- DOI: https://dx.doi.org/10.4239/wjd.v16.i7.107256


