Copyright
©The Author(s) 2025.
World J Diabetes. Jul 15, 2025; 16(7): 104306
Published online Jul 15, 2025. doi: 10.4239/wjd.v16.i7.104306
Published online Jul 15, 2025. doi: 10.4239/wjd.v16.i7.104306
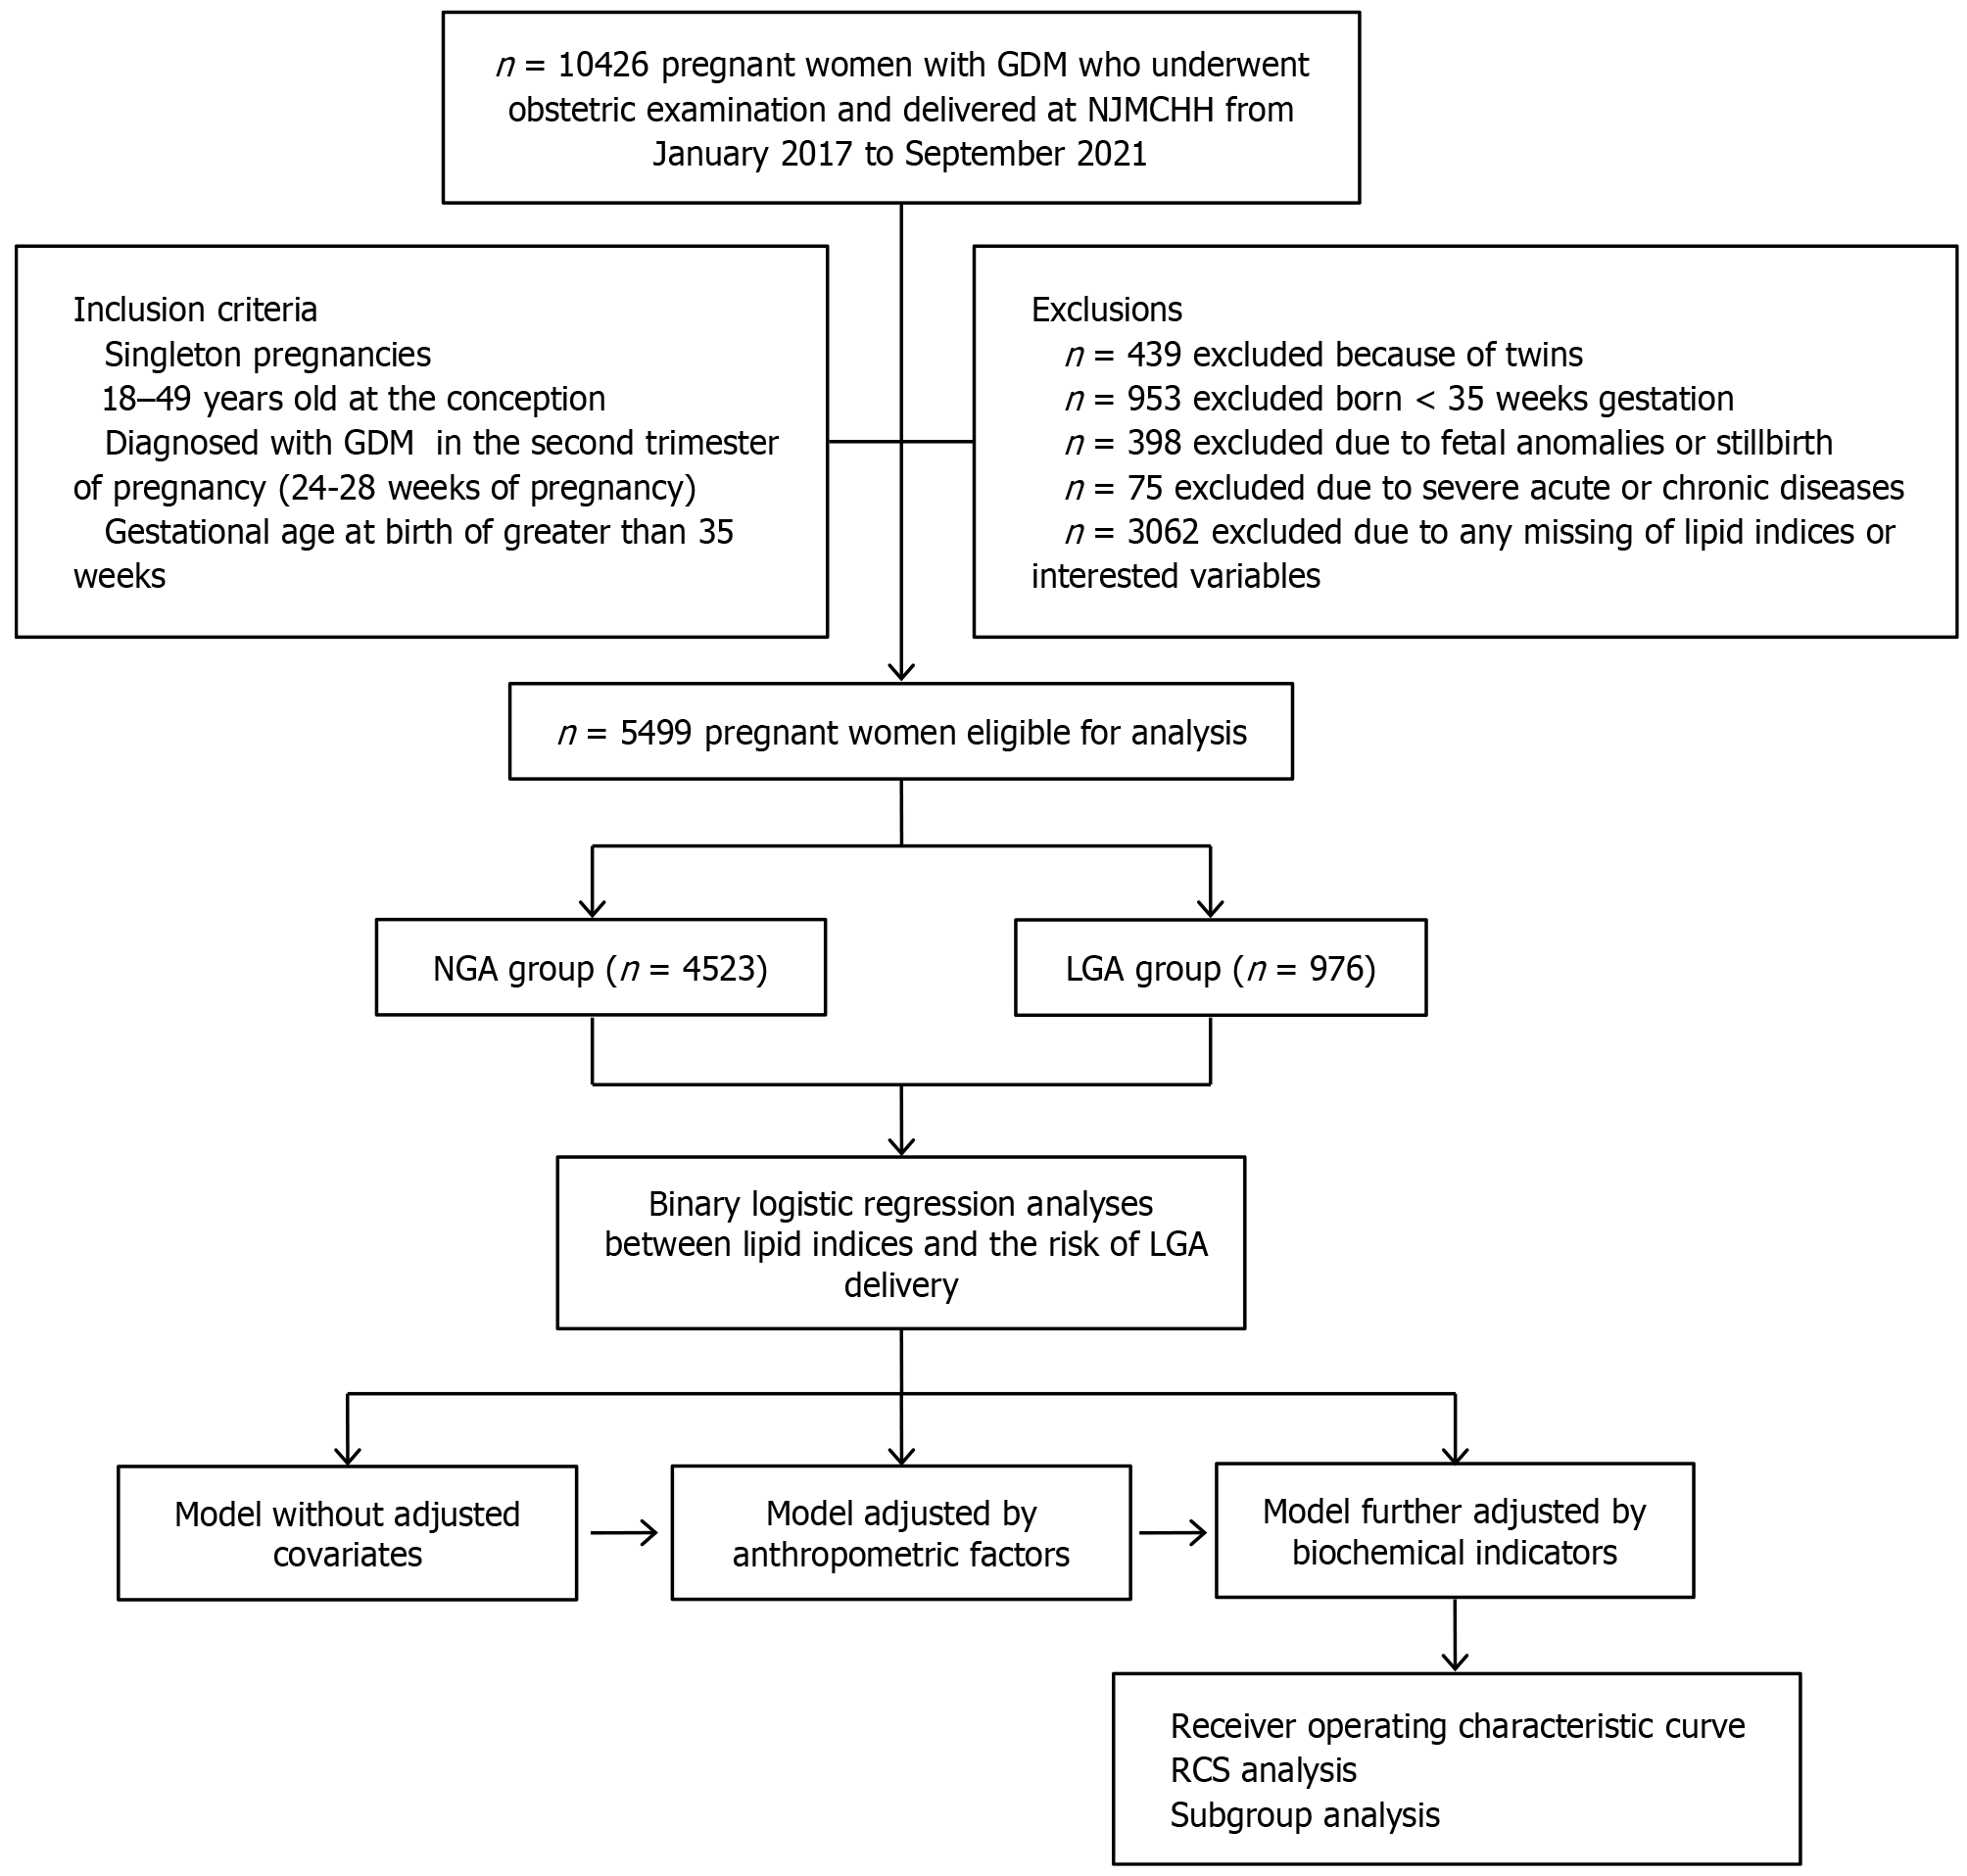
Figure 1 Study population selection and data analysis flowchart.
GDM: Gestational diabetes mellitus; NGA: Normal for gestational age; LGA: Large for gestational age; RCS: Restricted cubic spline; NJMCHH: Nanjing Maternal and Child Health Hospital.
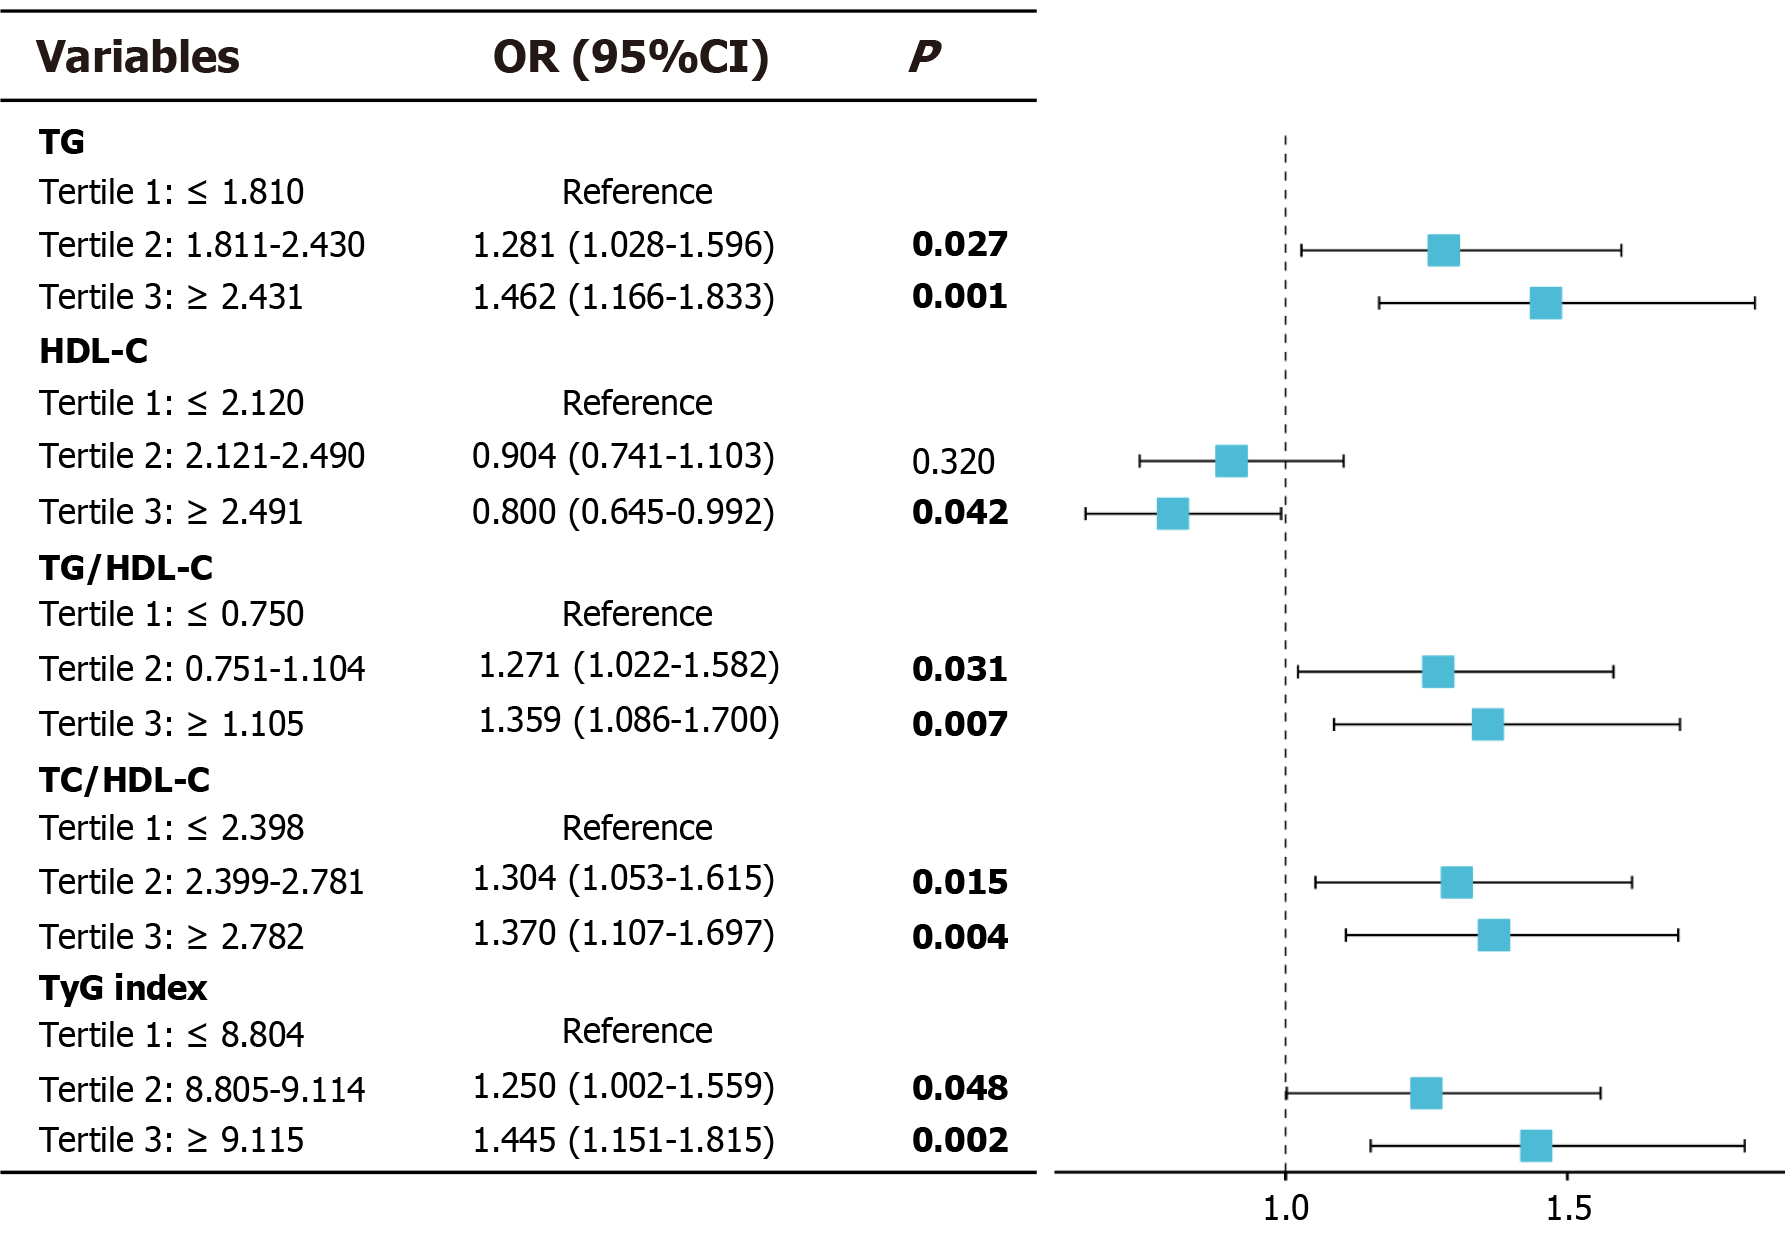
Figure 2 Odds ratios and 95% confidence intervals for association of lipid indices with the risk of delivering large-for-gestational-age infants in pregnant females with gestational diabetes mellitus.
OR: Odds ratios; CI: Confidence interval; TG: Triglyceride; HDL-C: High-density lipoprotein cholesterol; TC: Total cholesterol; TyG: Triglyceride-glucose index.
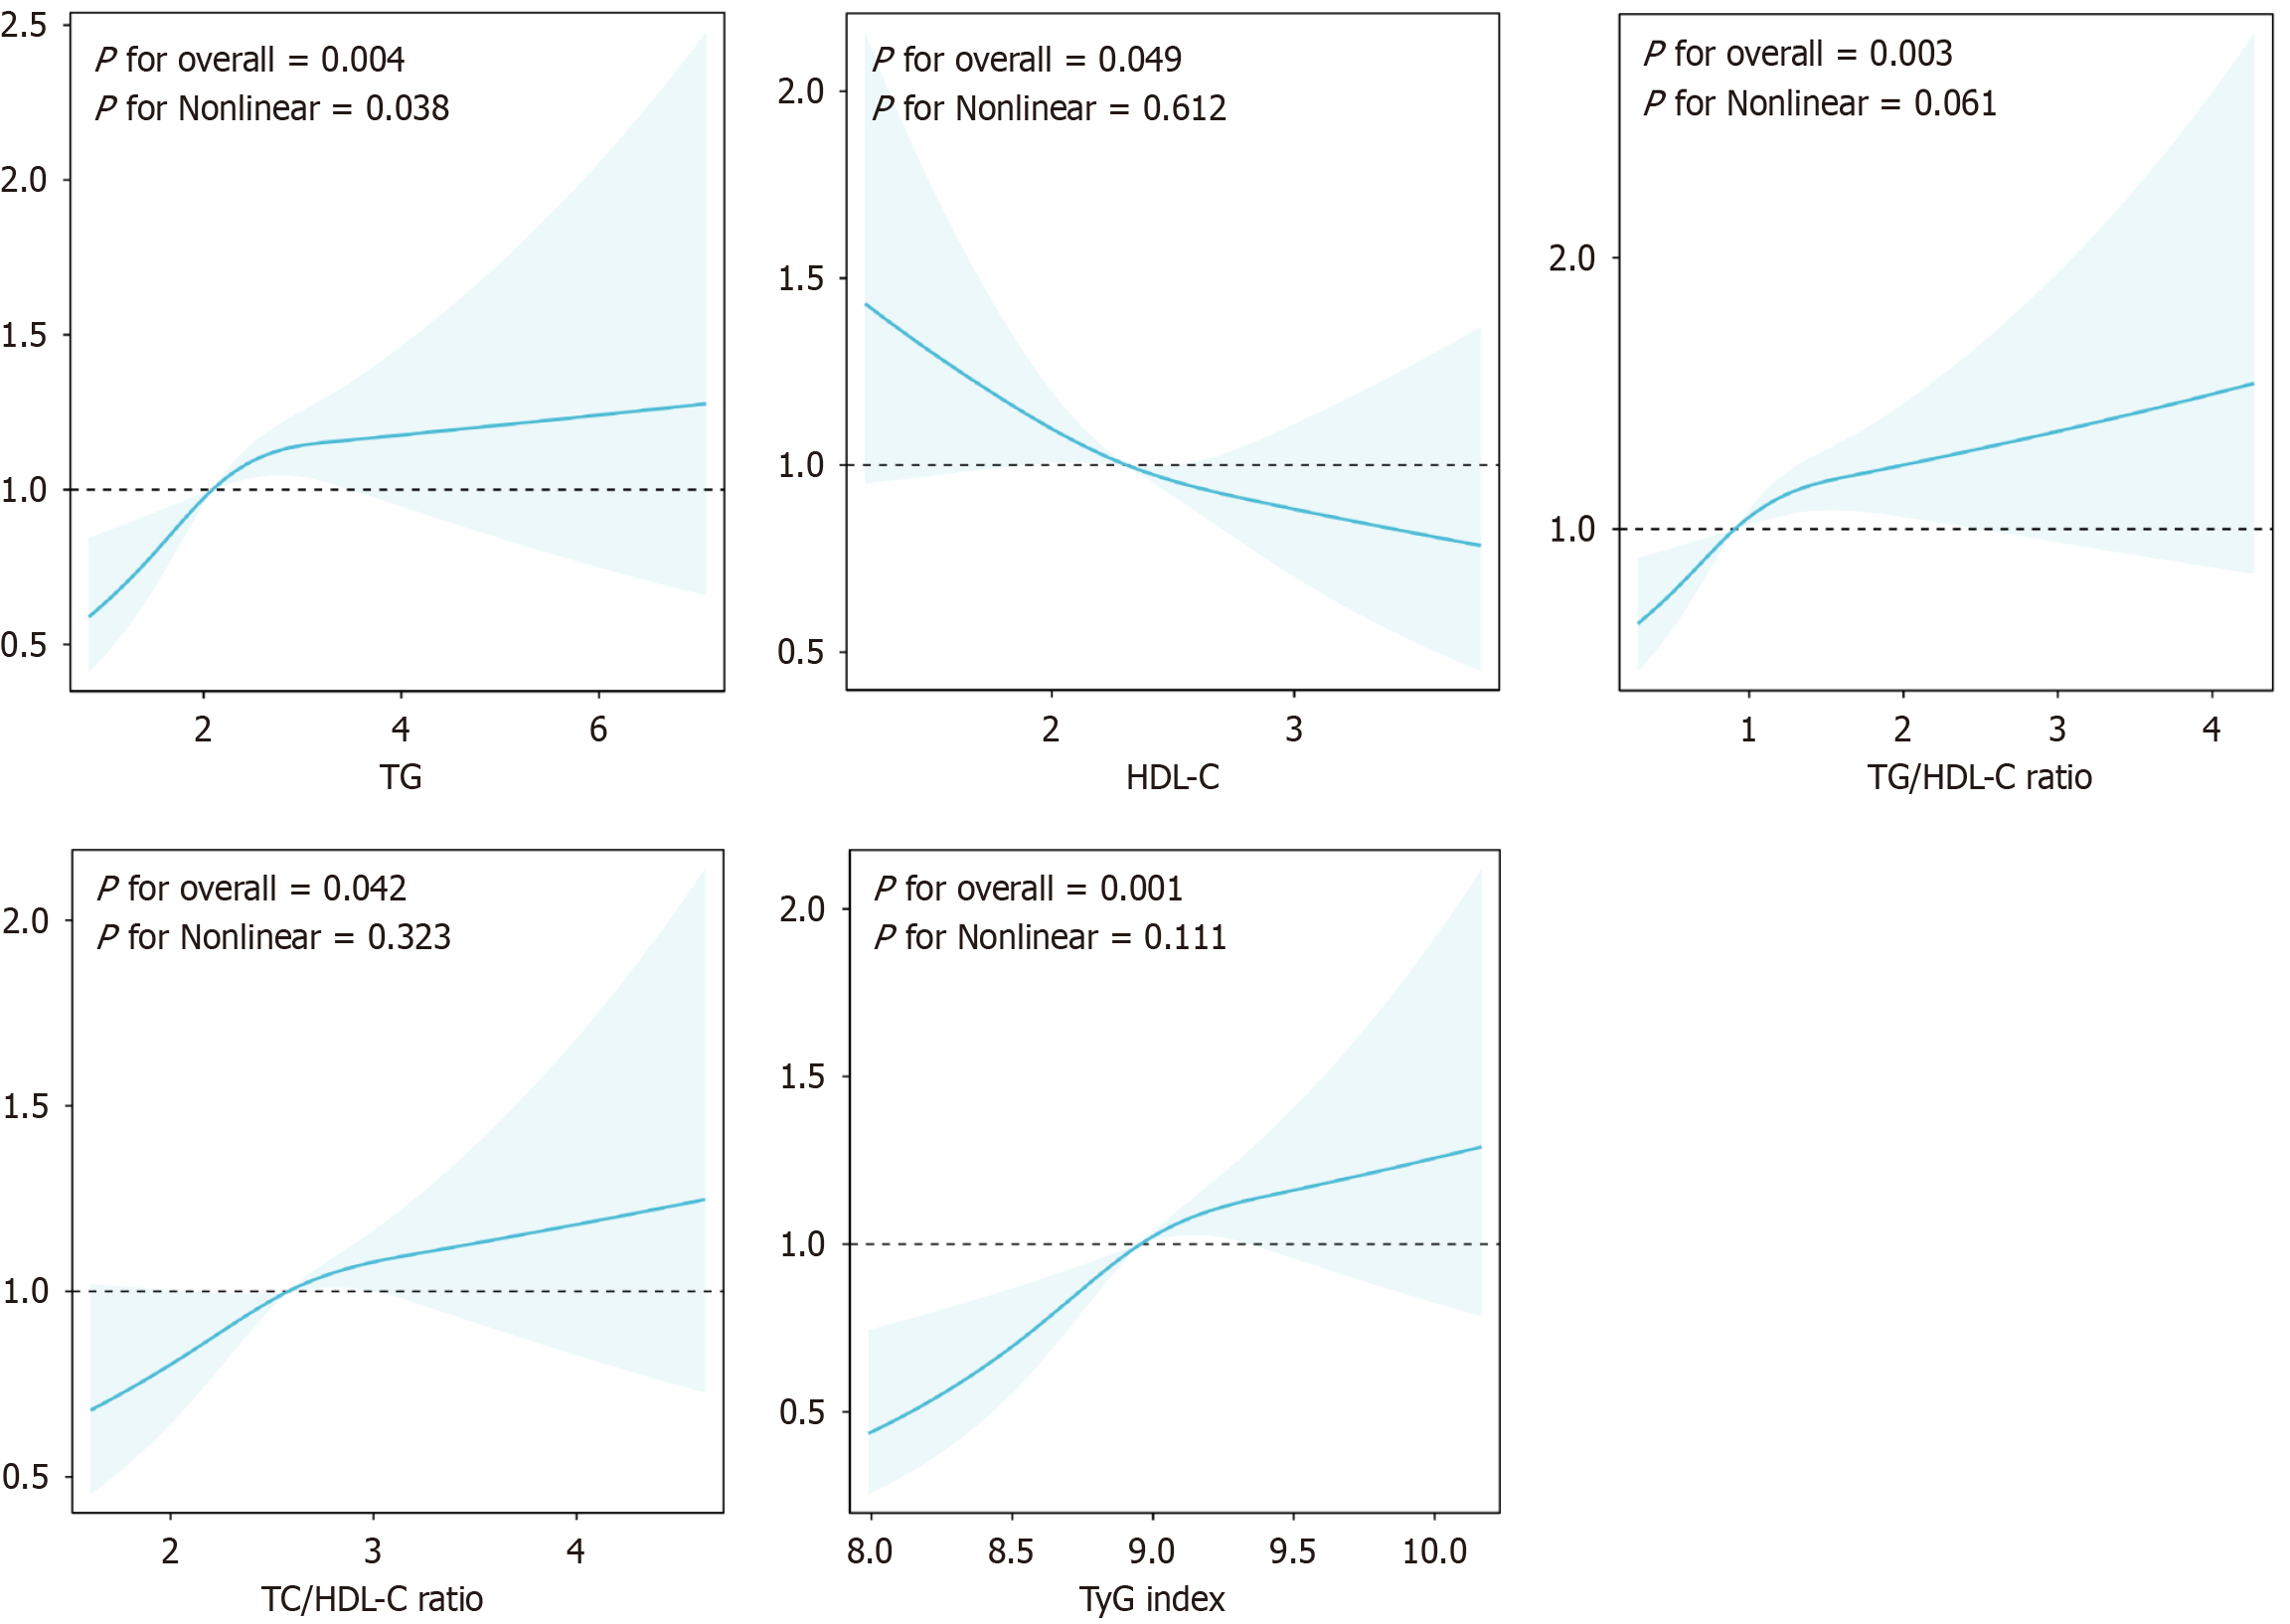
Figure 3 Dose-response relationships between lipid indices and the risk of delivering large-for-gestational-age infants in pregnant women with gestational diabetes mellitus.
TG: Triglyceride; HDL-C: High-density lipoprotein cholesterol; TC: Total cholesterol; TyG: Triglyceride-glucose index.
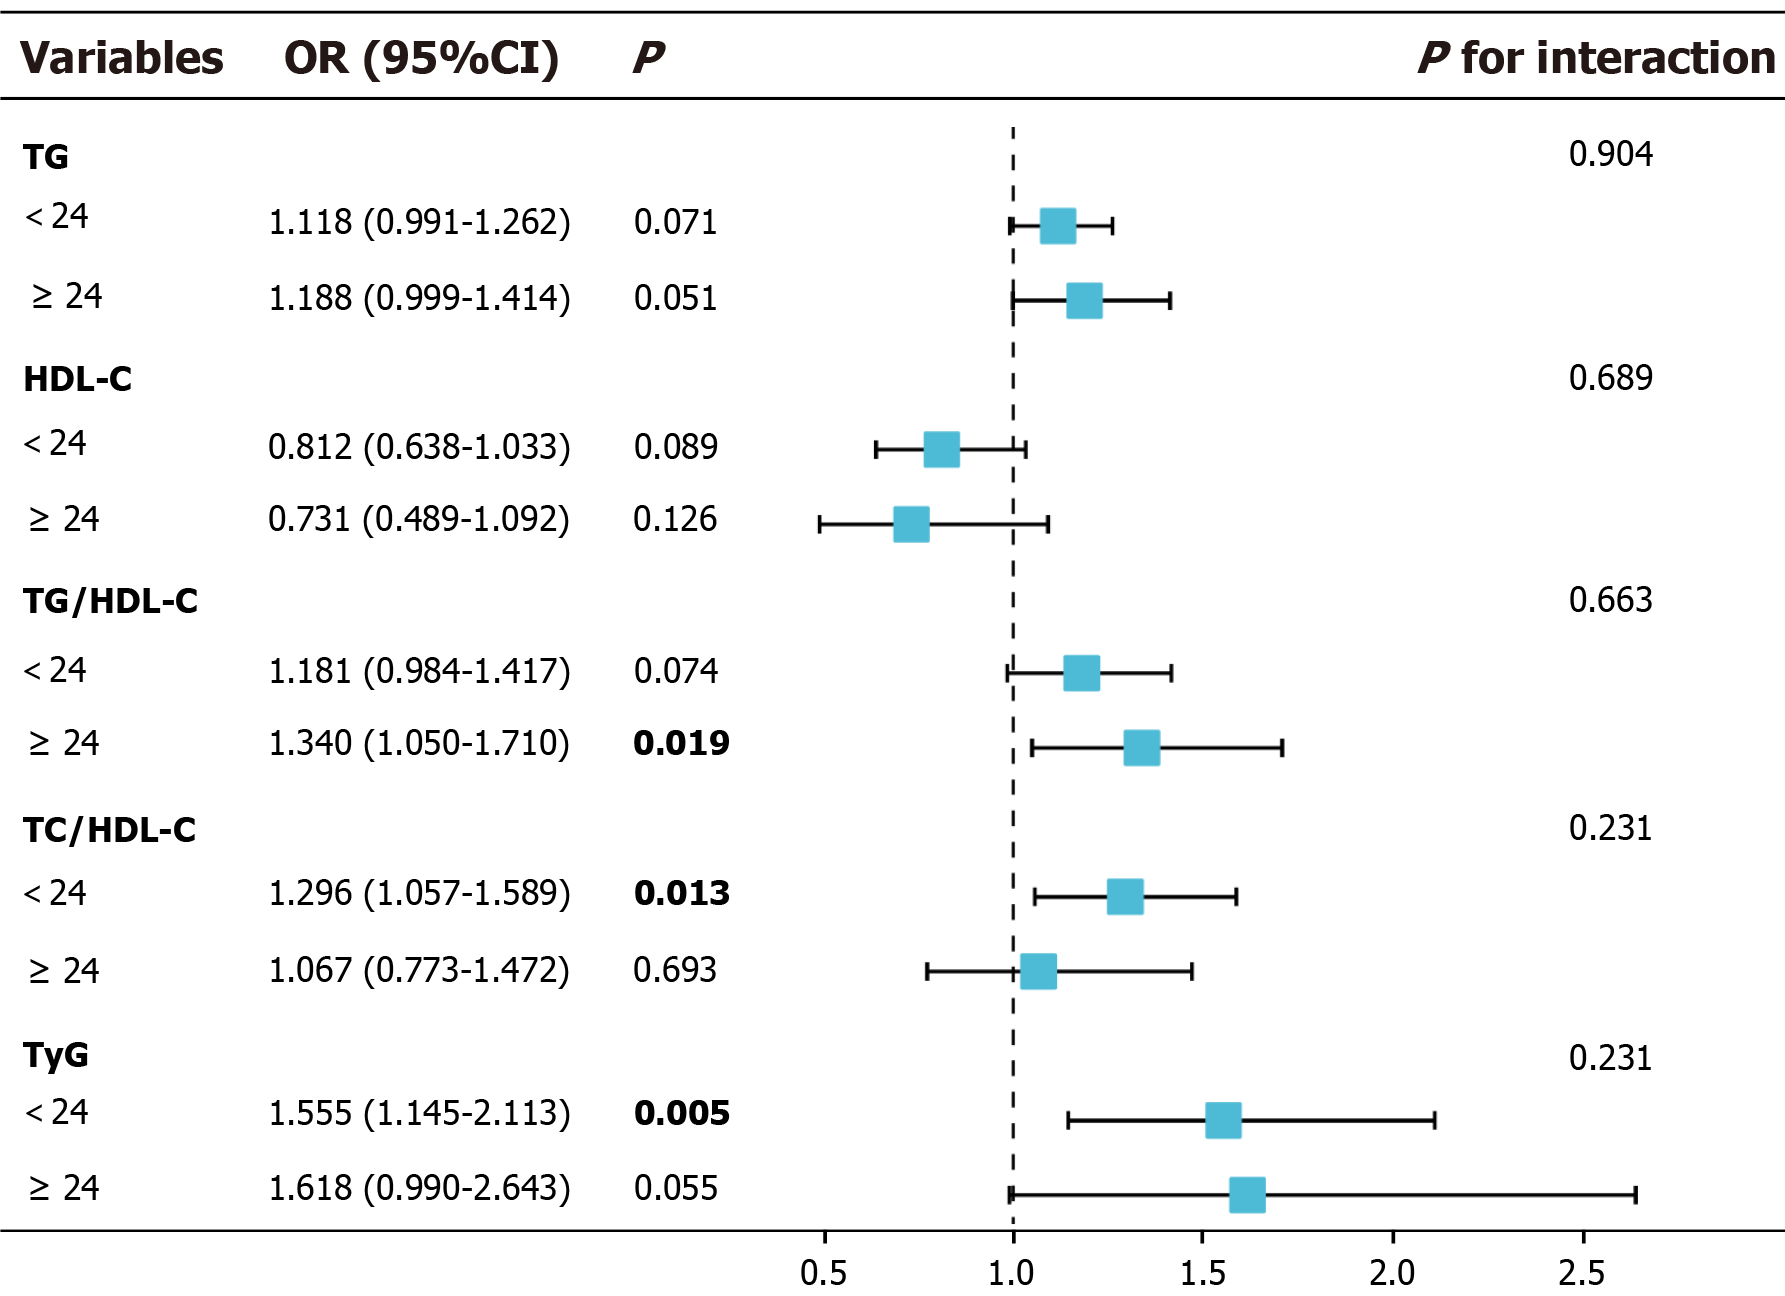
Figure 4 Subgroup analysis of lipid indices with respect to large-for-gestational-age infants risk stratified by pre-pregnancy body mass index.
OR: Odds ratios; CI: Confidence interval; TG: Triglyceride; HDL-C: High-density lipoprotein cholesterol; TC: Total cholesterol; TyG: Triglyceride-glucose index.
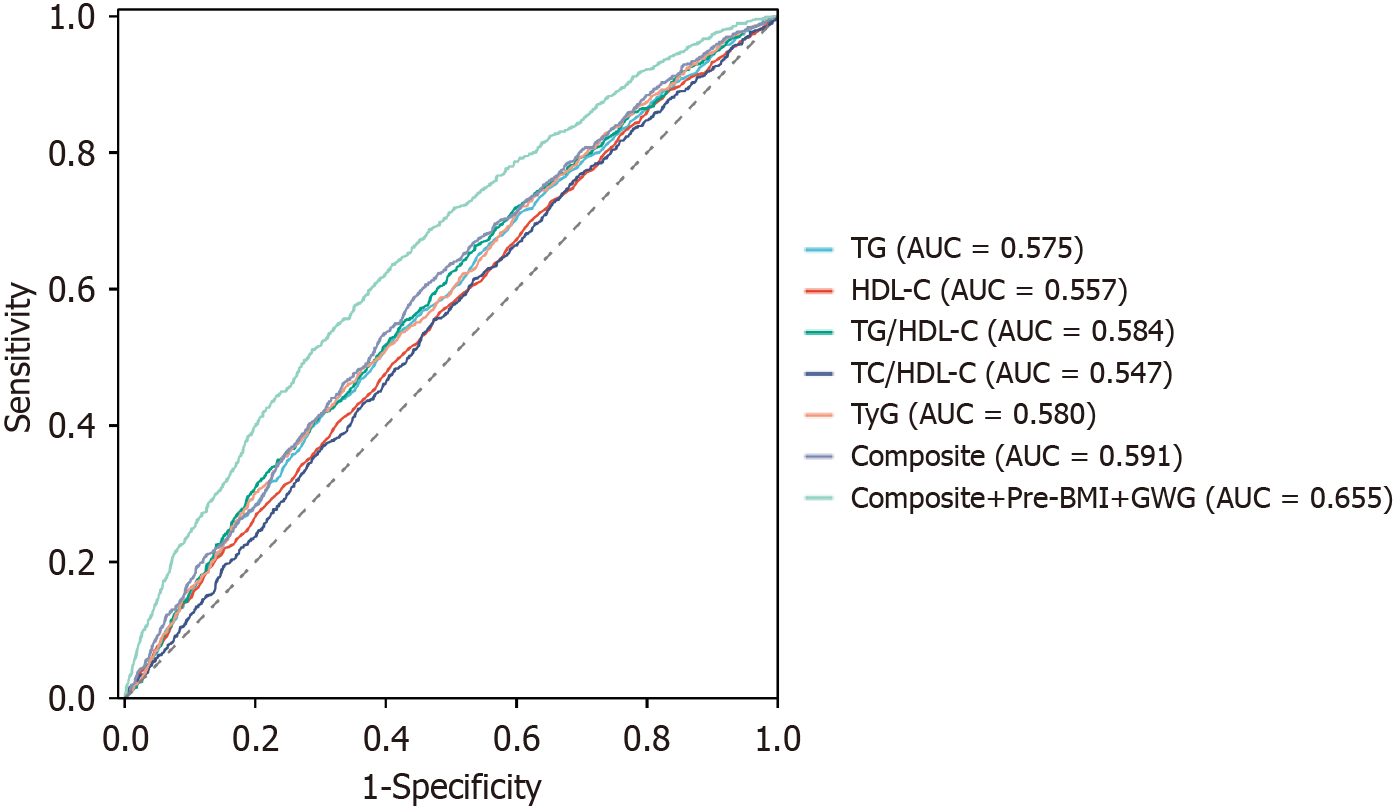
Figure 5 Receiver operating characteristic curves of lipid indices were used to assess the risk of delivering large-for-gestational-age infants in females with gestational diabetes mellitus.
TG: Triglyceride; HDL-C: High-density lipoprotein cholesterol; TC: Total cholesterol; TyG: Triglyceride-glucose index; BMI: Body mass index; GWG: Gestational weight gain; AUC: Area under the curve.
- Citation: Xiang LL, Feng J, Li SY, Zhu YT, Chen YJ, Zhong TY, Zhu YF, Zeng Y. Predictive ability of lipid indices for large-for-gestational-age infants in pregnant females with gestational diabetes mellitus. World J Diabetes 2025; 16(7): 104306
- URL: https://www.wjgnet.com/1948-9358/full/v16/i7/104306.htm
- DOI: https://dx.doi.org/10.4239/wjd.v16.i7.104306


