Copyright
©The Author(s) 2025.
World J Diabetes. Jun 15, 2025; 16(6): 103685
Published online Jun 15, 2025. doi: 10.4239/wjd.v16.i6.103685
Published online Jun 15, 2025. doi: 10.4239/wjd.v16.i6.103685
Figure 1 Effect of erianin on body weight and fasting blood glucose in type 2 diabetes mellitus mice.
A: Body weight; B: Fasting blood glucose. Three independent biological repetitions were used. L: Low; M: Middle; H: High.
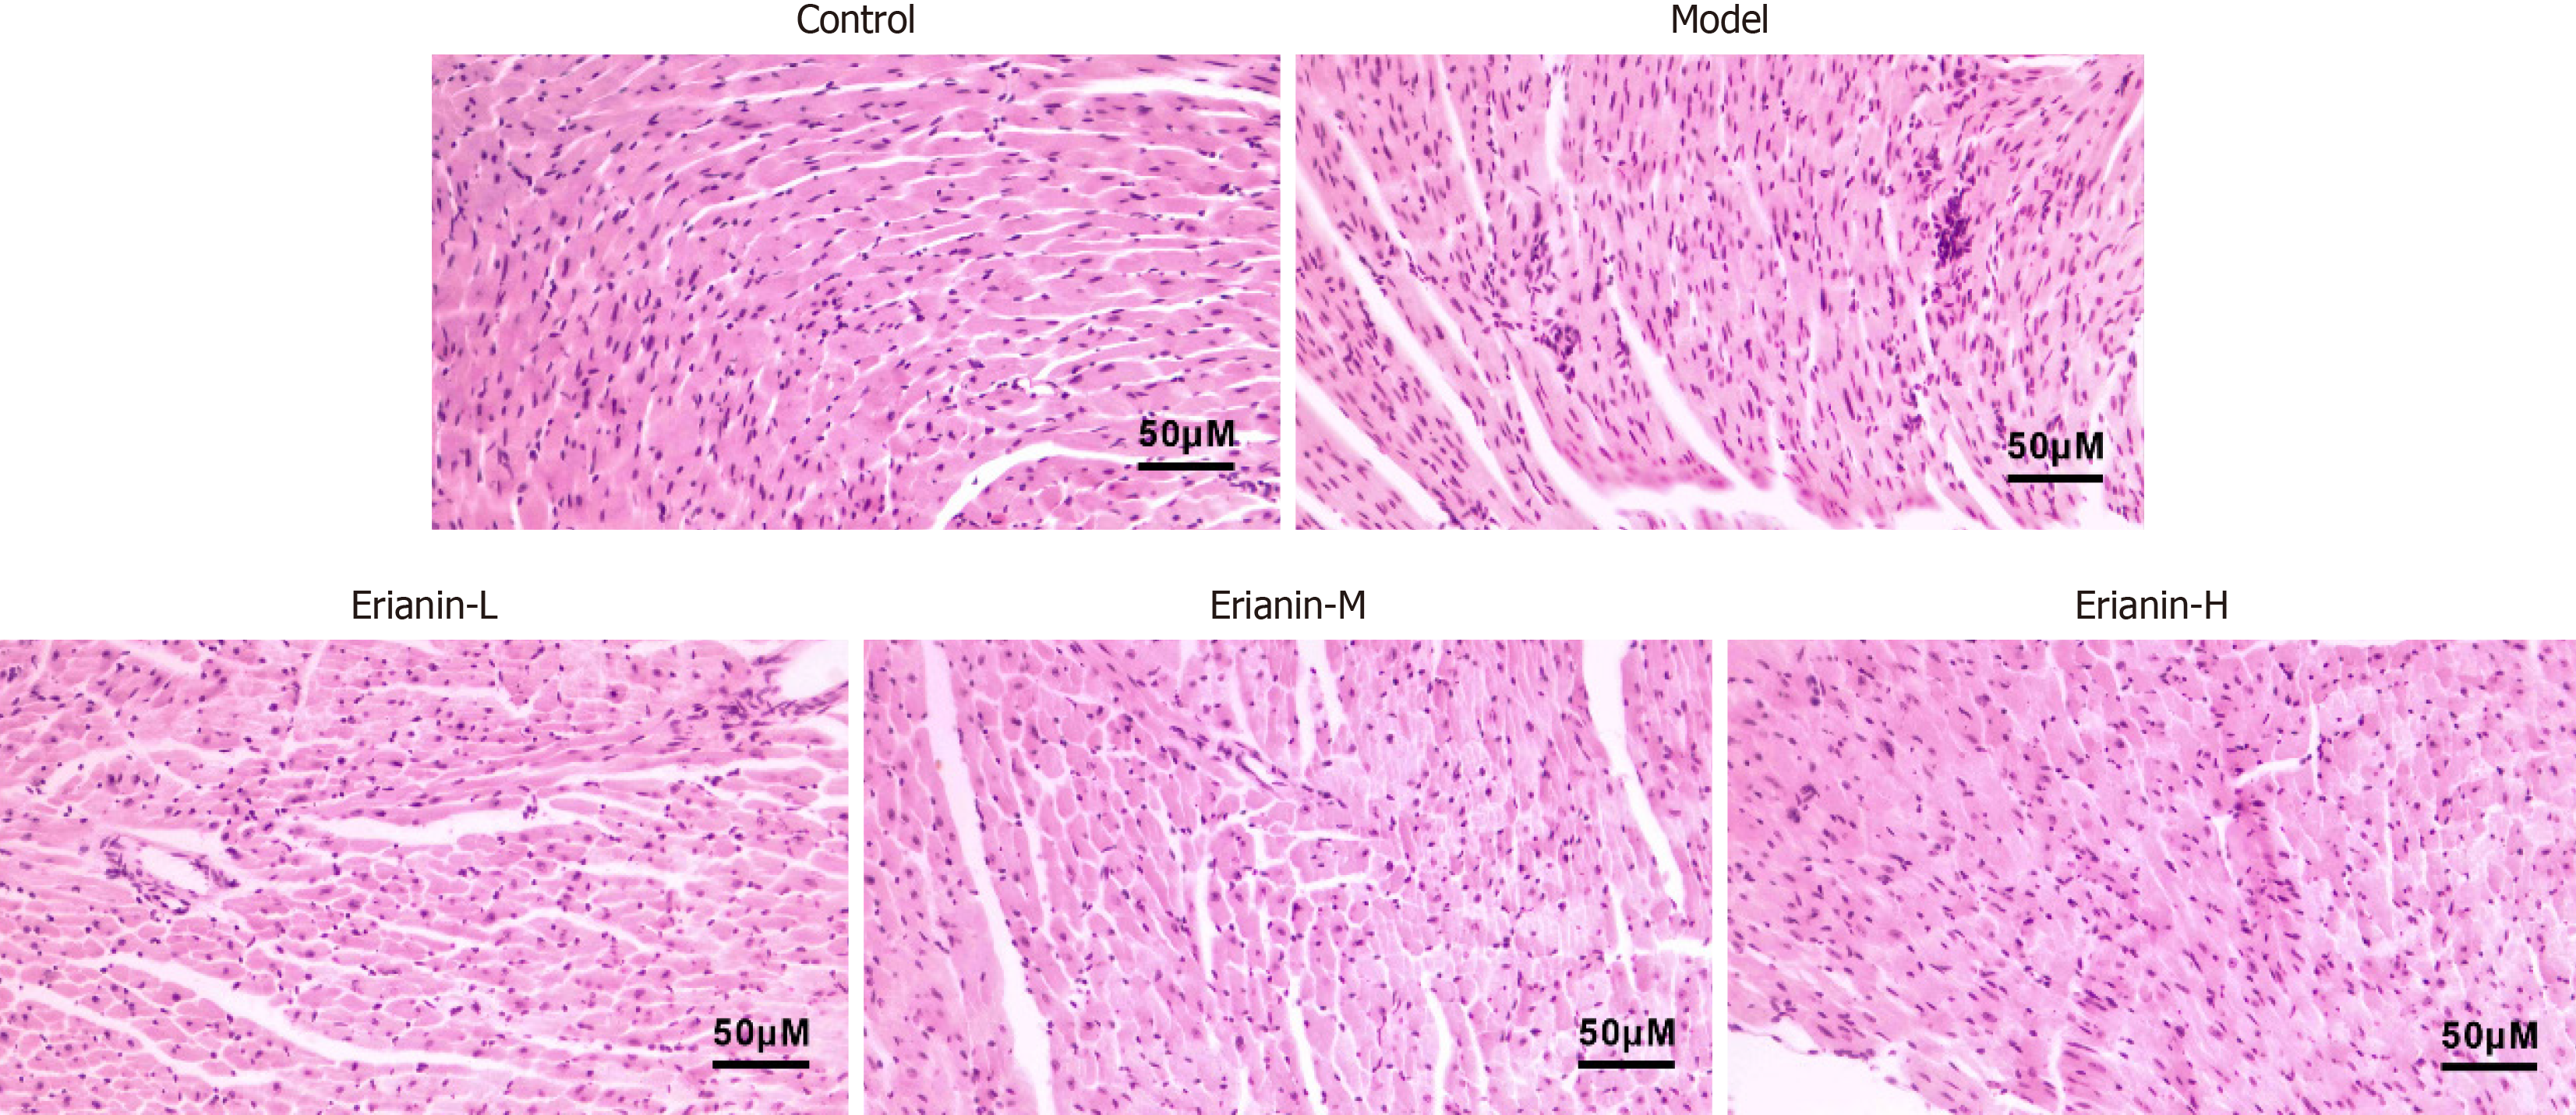
Figure 2 Hematoxylin-eosin staining of myocardial tissue in type 2 diabetes mellitus mice (× 200).
L: Low; M: Middle; H: High.
Figure 3 Indices of myocardial damage in type 2 diabetes mellitus mice.
A: Creatine kinase (CK) (U/L); B: CK-isoenzymes (U/L); C: Cardiac troponin I (mg/mL). Bar charts represent the mean ± SEM, n = 8. cP < 0.001 vs control group; dP < 0.05 vs model group; eP < 0.01 vs model group; fP < 0.001 vs model group; CK: Creatine kinase; CK-MB: Creatine kinase-isoenzymes; cTnI: Cardiac troponin I.
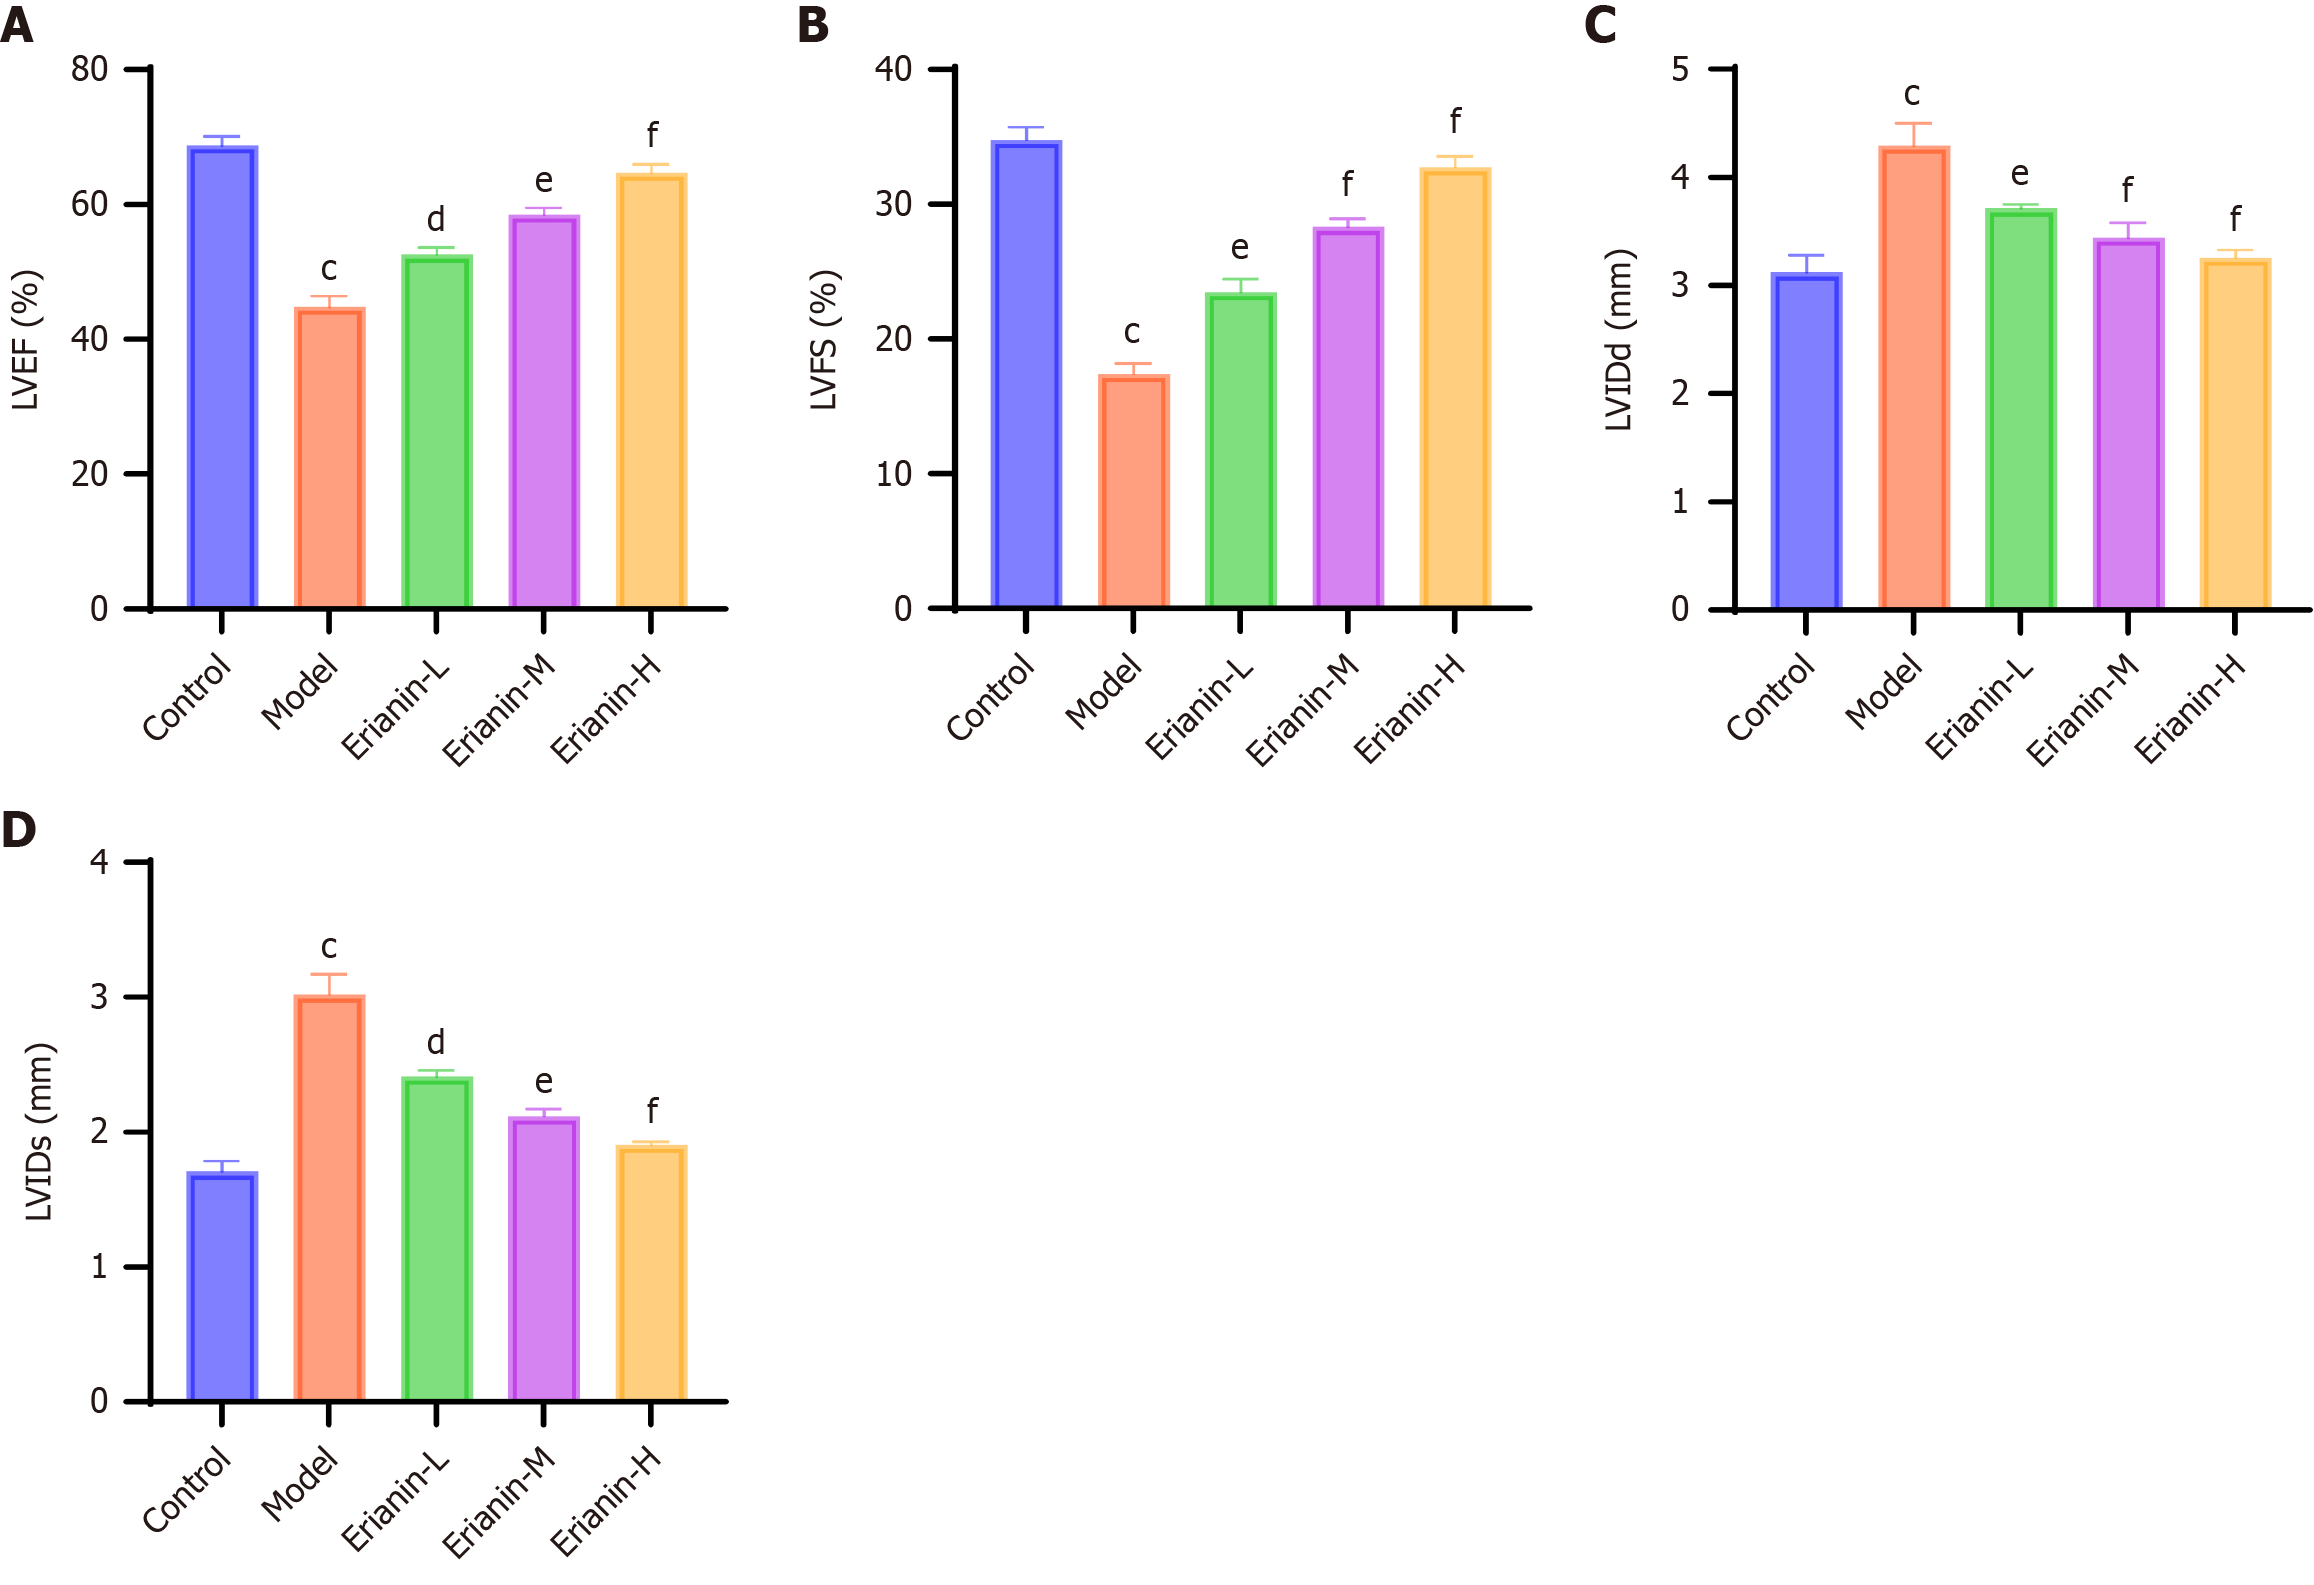
Figure 4 Echocardiographic parameters in type 2 diabetic mice.
A: Left ventricular ejection fraction (LVEF) (%); B: Left ventricular fractional shortening (LVFS) (%); C: Left ventricular internal dimension at diastole (LVIDd) (mm); D: Left ventricular internal dimension at systole (LVIDs) (mm). Bar charts represent the mean ± SEM, n = 8. cP < 0.001 vs control group; dP < 0.05 vs model group; eP < 0.01 vs model group; fP < 0.001 vs model group.
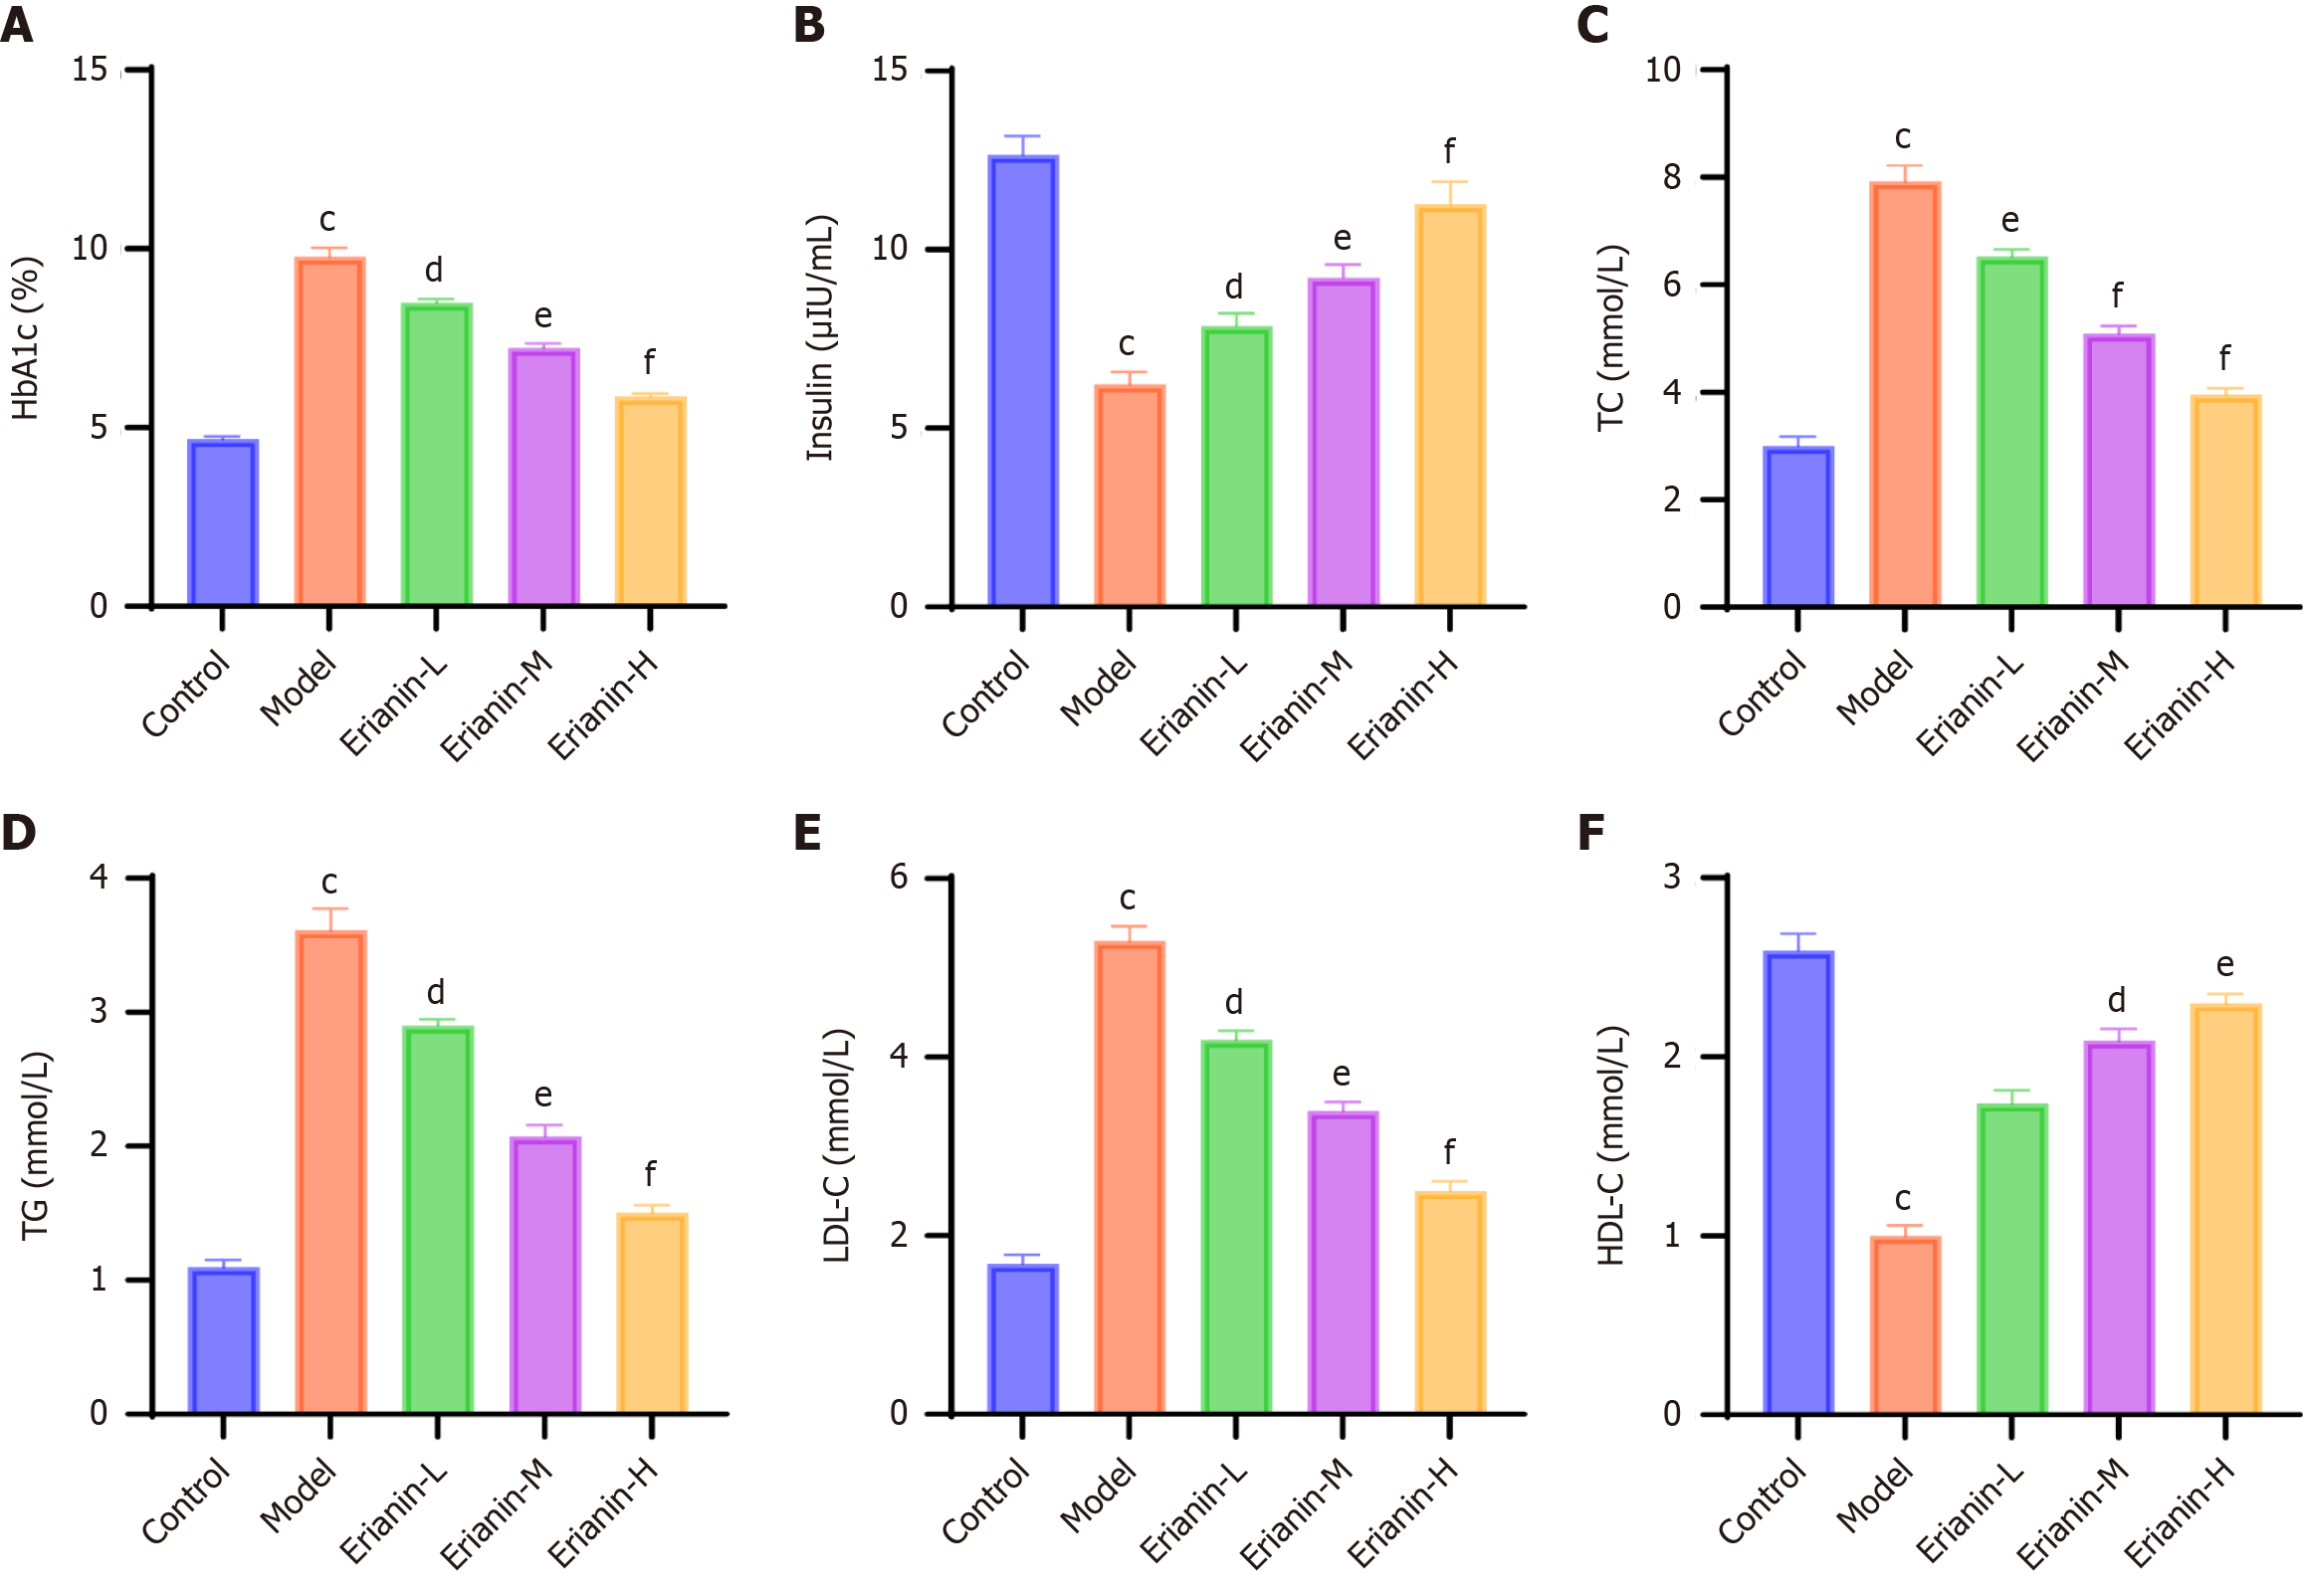
Figure 5 Metabolic parameters in type 2 diabetic mice.
A: Glycated hemoglobin (%); B: Plasma insulin concentration (μIU/mL); C: Total cholesterol (mmol/L); D: Triglyceride (mmol/L); E: Low-density lipoprotein cholesterol (mmol/L); F: High-density lipoprotein cholesterol (mmol/L). Bar charts represent the mean ± SEM, n = 8. cP < 0.001 vs control group; dP < 0.05 vs model group; eP < 0.01 vs model group; fP < 0.001 vs model group; HbA1c: Glycated hemoglobin; TC: Total cholesterol; TG: Triglyceride; LDL-C: Low-density lipoprotein cholesterol; HDL-C: High-density lipoprotein cholesterol.
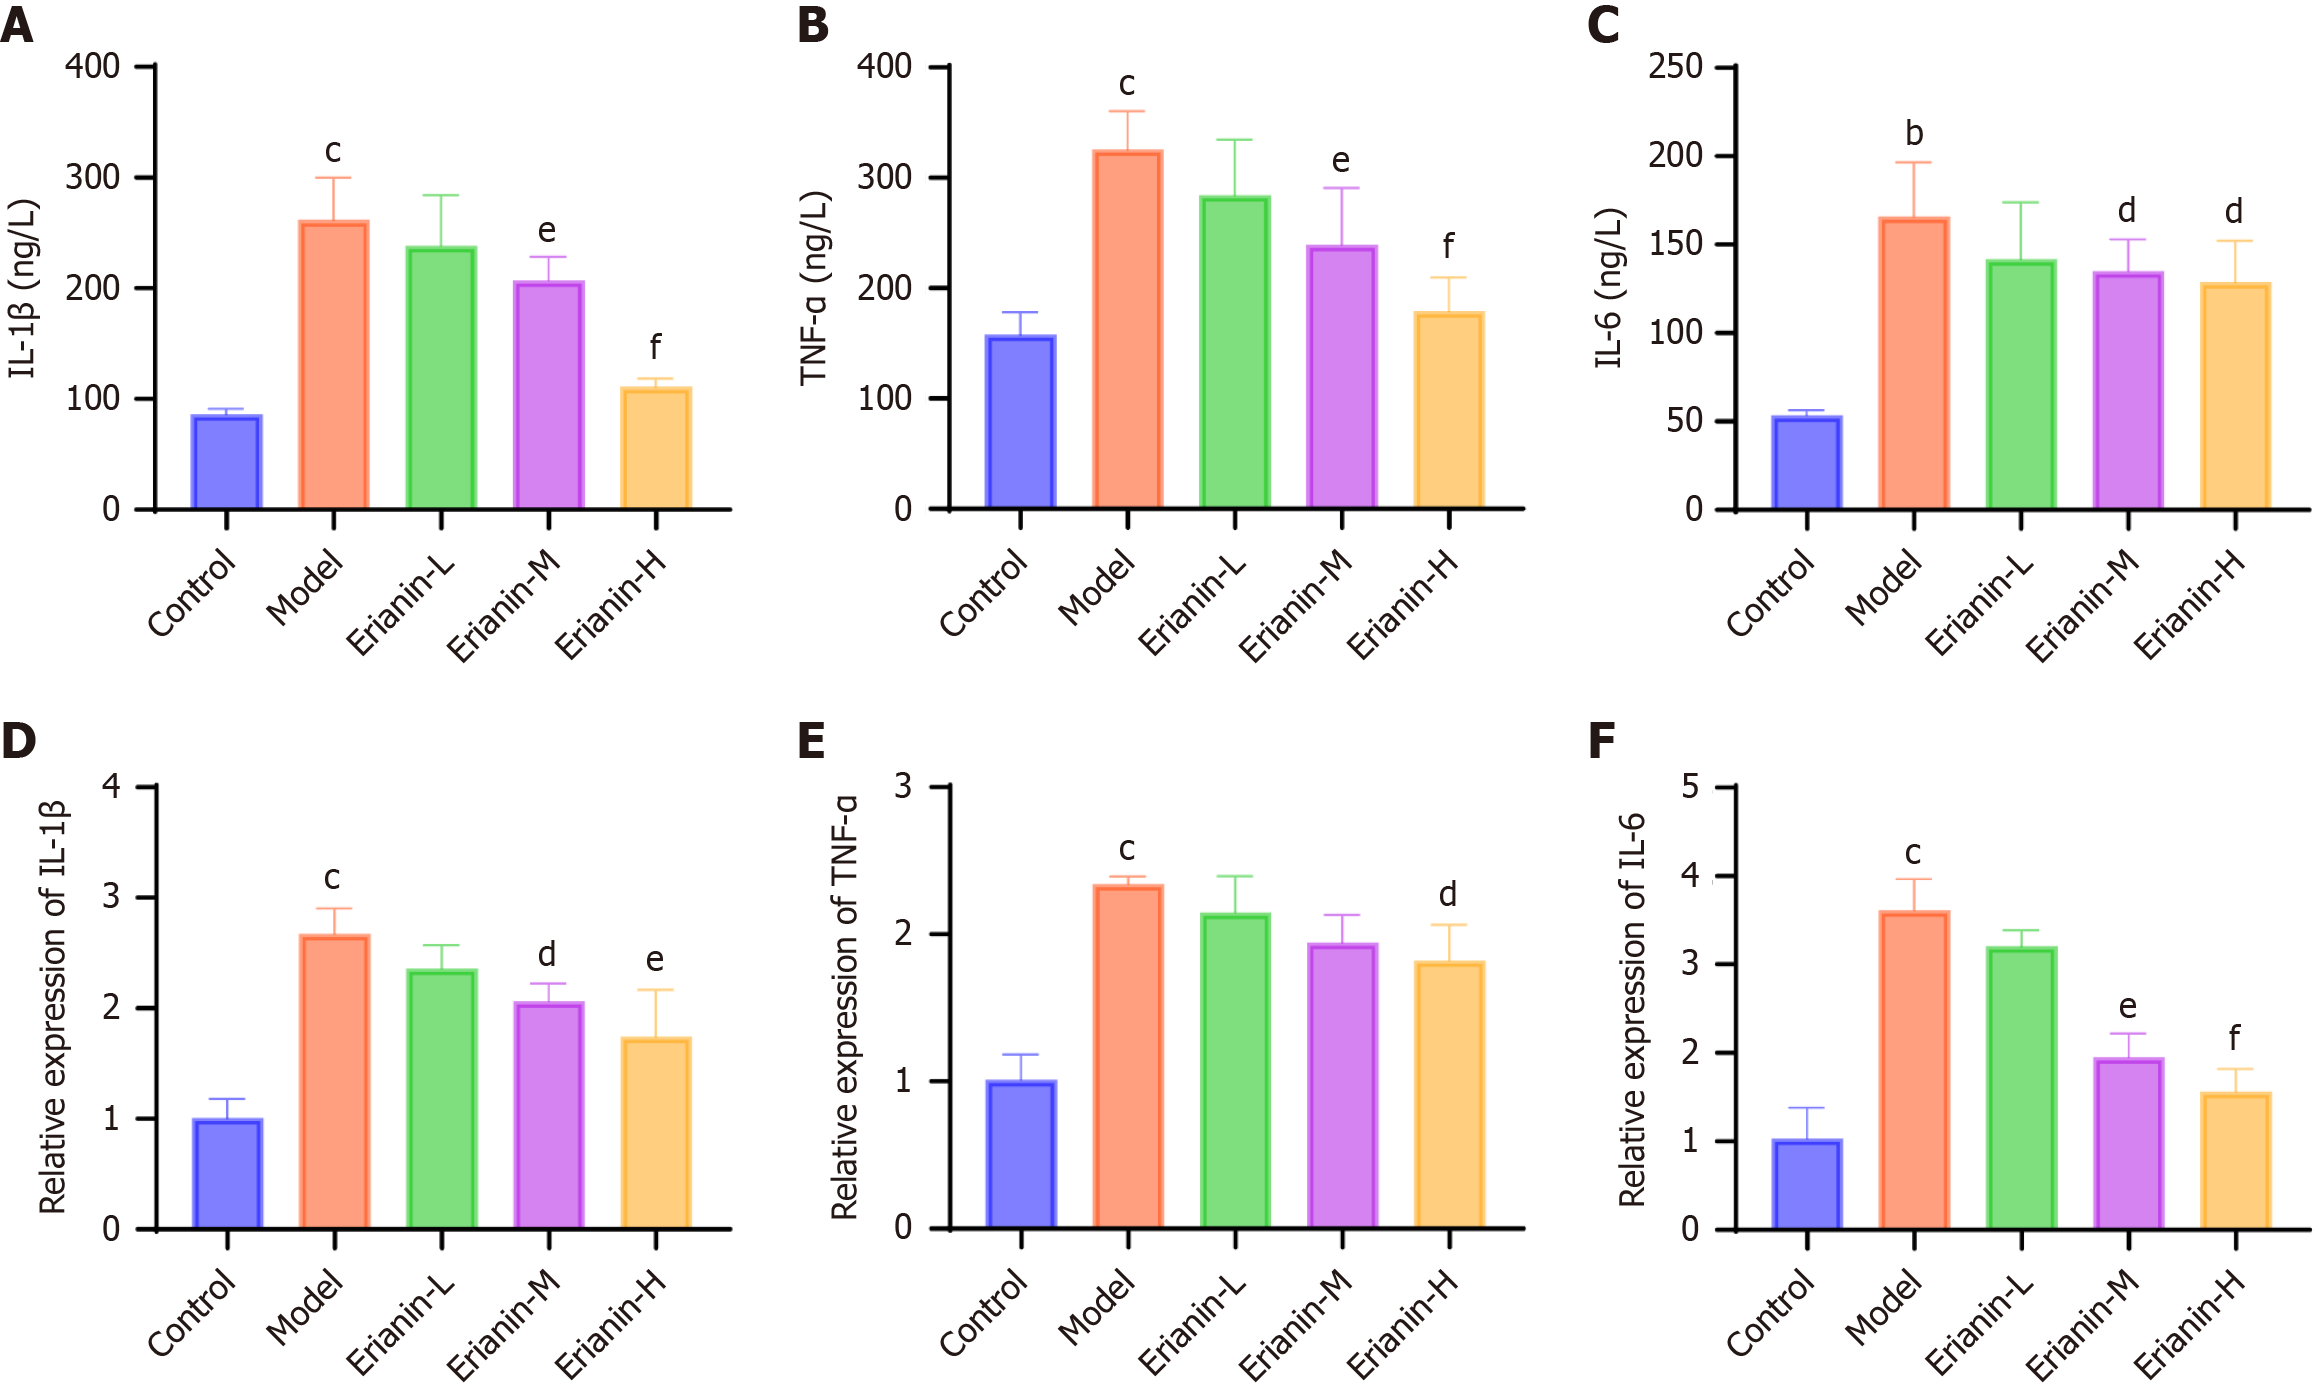
Figure 6 Comparison of proinflammatory factor expression in type 2 diabetes mellitus mice.
A: Level of tumor necrosis factor-α (TNF-α) in serum; B: Level of interleukin (IL)-1β in serum; C: Level of IL-6 in serum; D: mRNA level of TNF-α in heart tissues; E: mRNA level of IL-1β in heart tissues; F: mRNA level of IL-6 in heart tissues. Bar charts represent the mean ± SEM, n = 8. bP < 0.01 vs control group; cP < 0.001 vs control group; dP < 0.05 vs model group; eP < 0.01 vs model group; fP < 0.001 vs model group; TNF-α: Tumor necrosis factor-α; IL: Interleukin.
Figure 7 Comparison of malondialdehyde contents and superoxide dismutase and catalase activities in mice with type 2 diabetes mellitus.
A: Malondialdehyde; B: Superoxide dismutase; C: Catalase. Bar charts represent the mean ± SEM, n = 8. cP < 0.001 vs control group; dP < 0.05 vs model group; eP < 0.01 vs model group; fP < 0.001 vs model group; MDA: Malondialdehyde; SOD: Superoxide dismutase; CAT: Catalase.
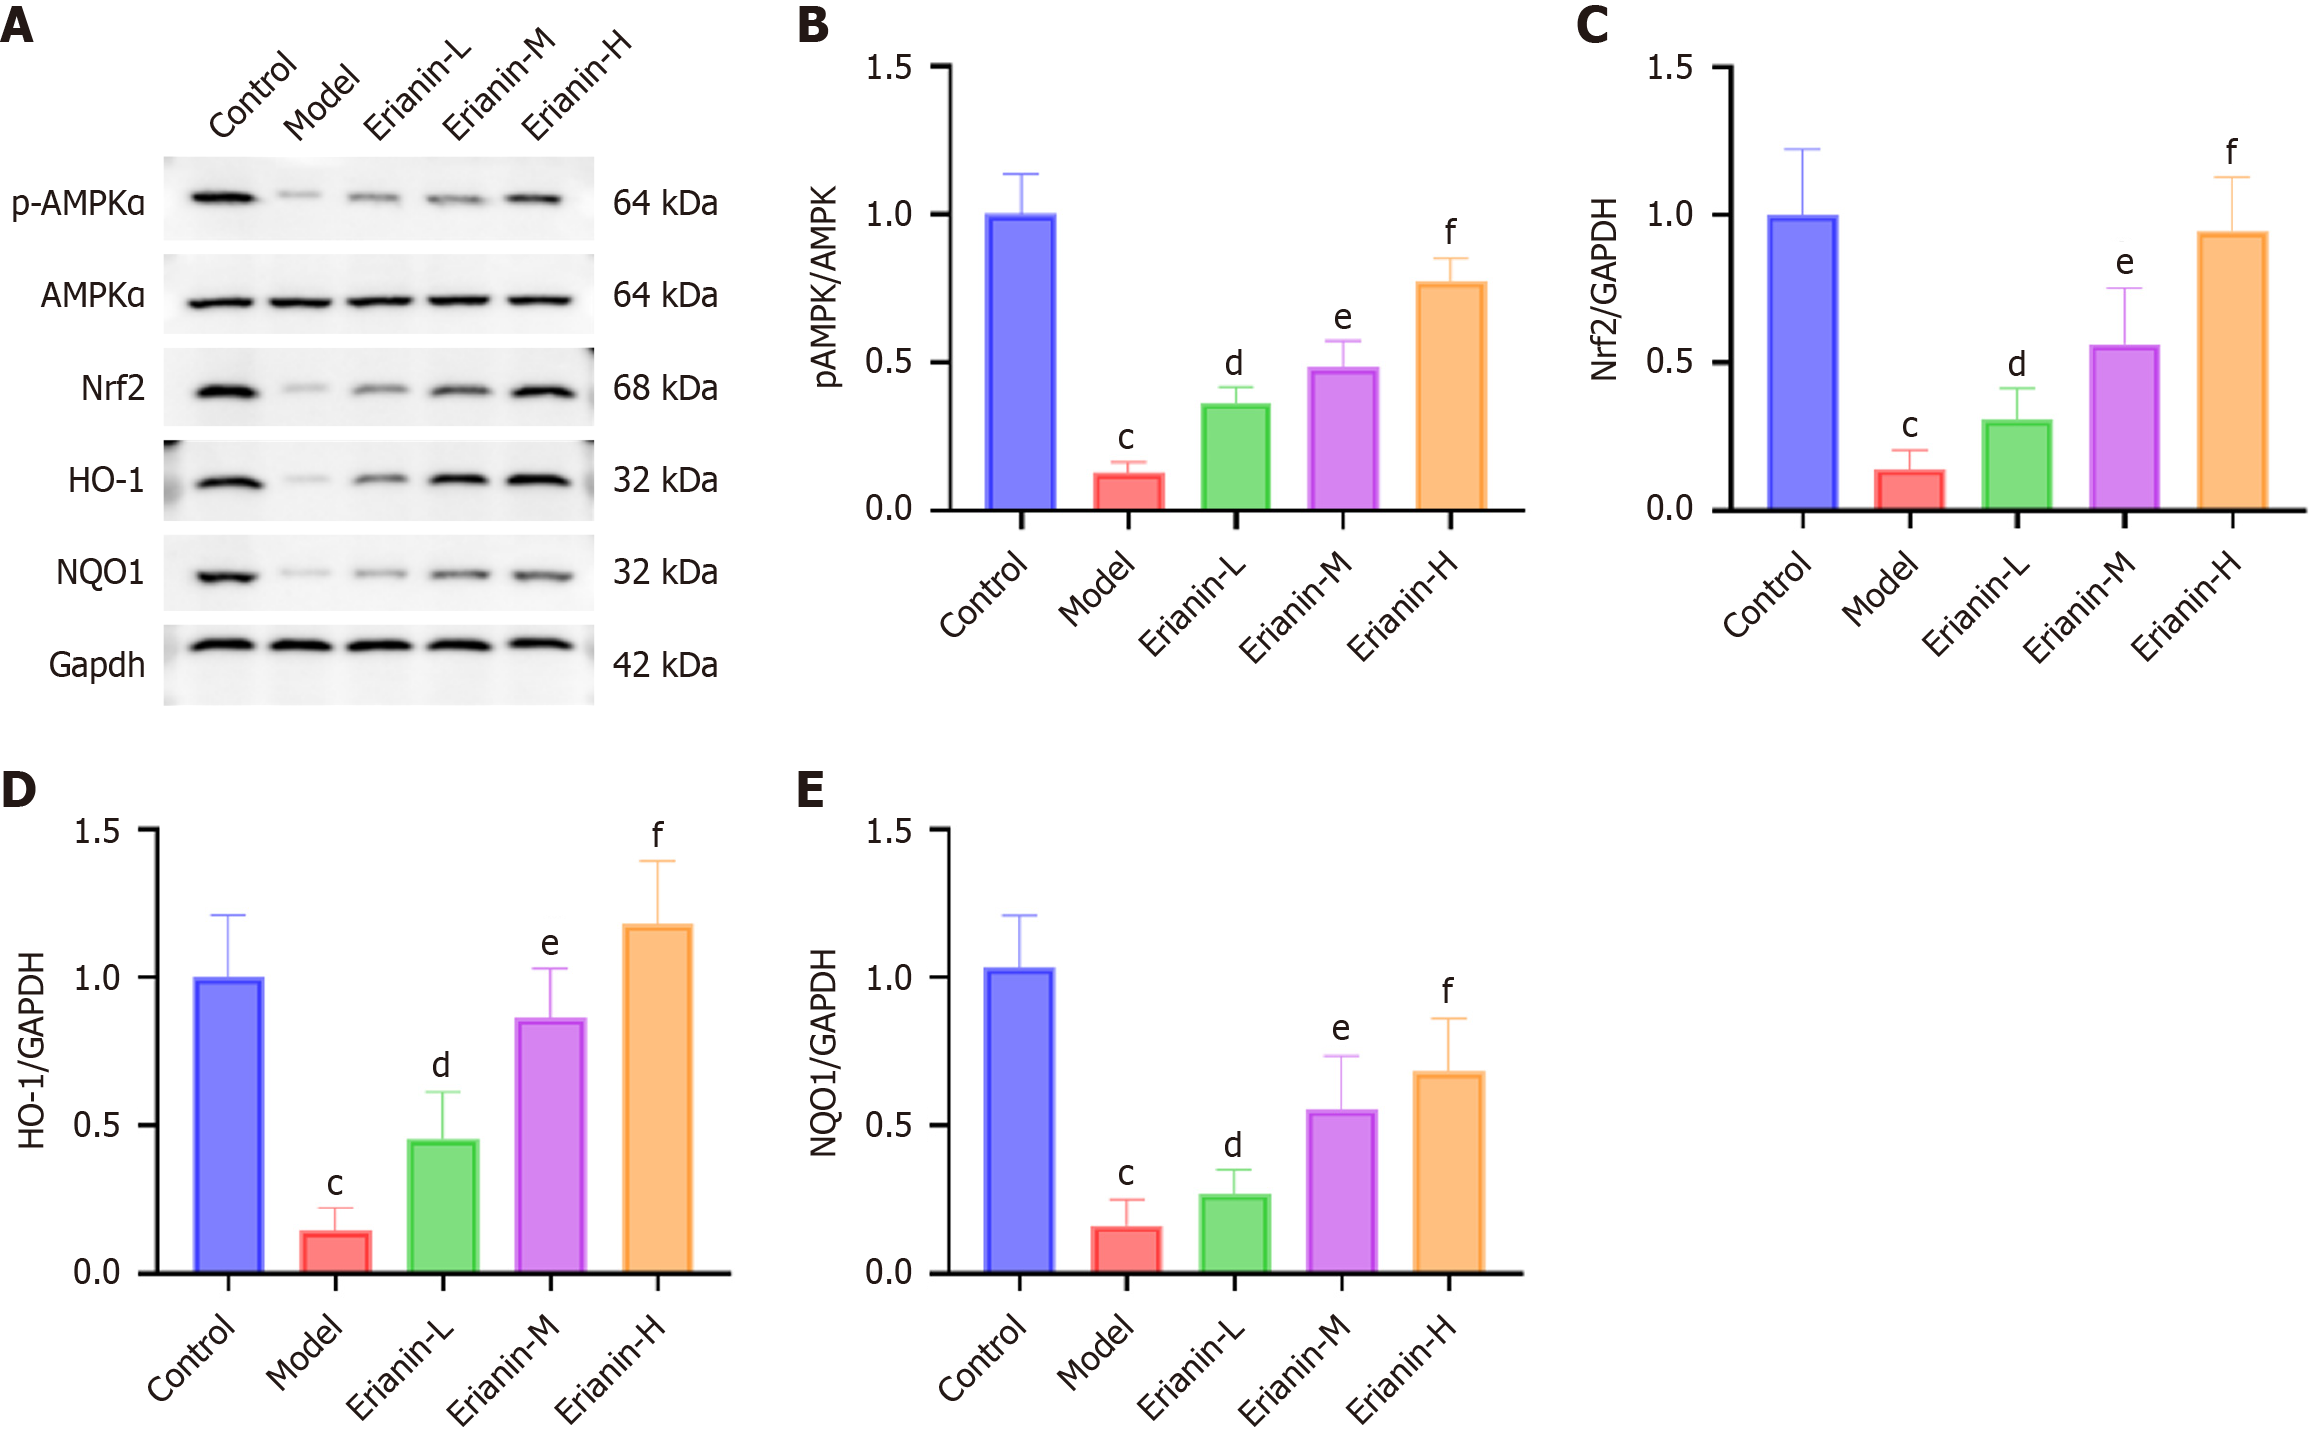
Figure 8 Expression of the nuclear factor erythroid 2-related factor 2 signaling pathway in myocardial tissue of mice with type 2 diabetes mellitus.
A: Western blot analysis of phosphorylated adenosine monophosphate-activated protein kinase (pAMPK), adenosine monophosphate-activated protein kinase, nuclear factor erythroid 2-related factor 2 (Nrf2), heme oxygenase-1 (HO-1), and NAD(P)H:quinone oxidoreductase 1 (NQO1); B: pAMPK protein levels; C: Nrf2 protein levels; D: HO-1 protein levels; E: NQO1 protein levels. Bar charts represent the mean ± SEM, n = 8. cP < 0.001 vs control group; dP < 0.05 vs model group; eP < 0.01 vs model group; fP < 0.001 vs model group; AMPK: Adenosine monophosphate-activated protein kinase; pAMPK: Phosphorylated adenosine monophosphate-activated protein kinase; Nrf2: Nuclear factor erythroid 2-related factor 2; HO-1: Heme oxygenase-1; NQO1: NAD(P)H:quinone oxidoreductase 1; GAPDH: Glyceraldehyde 3-phosphate dehydrogenase.
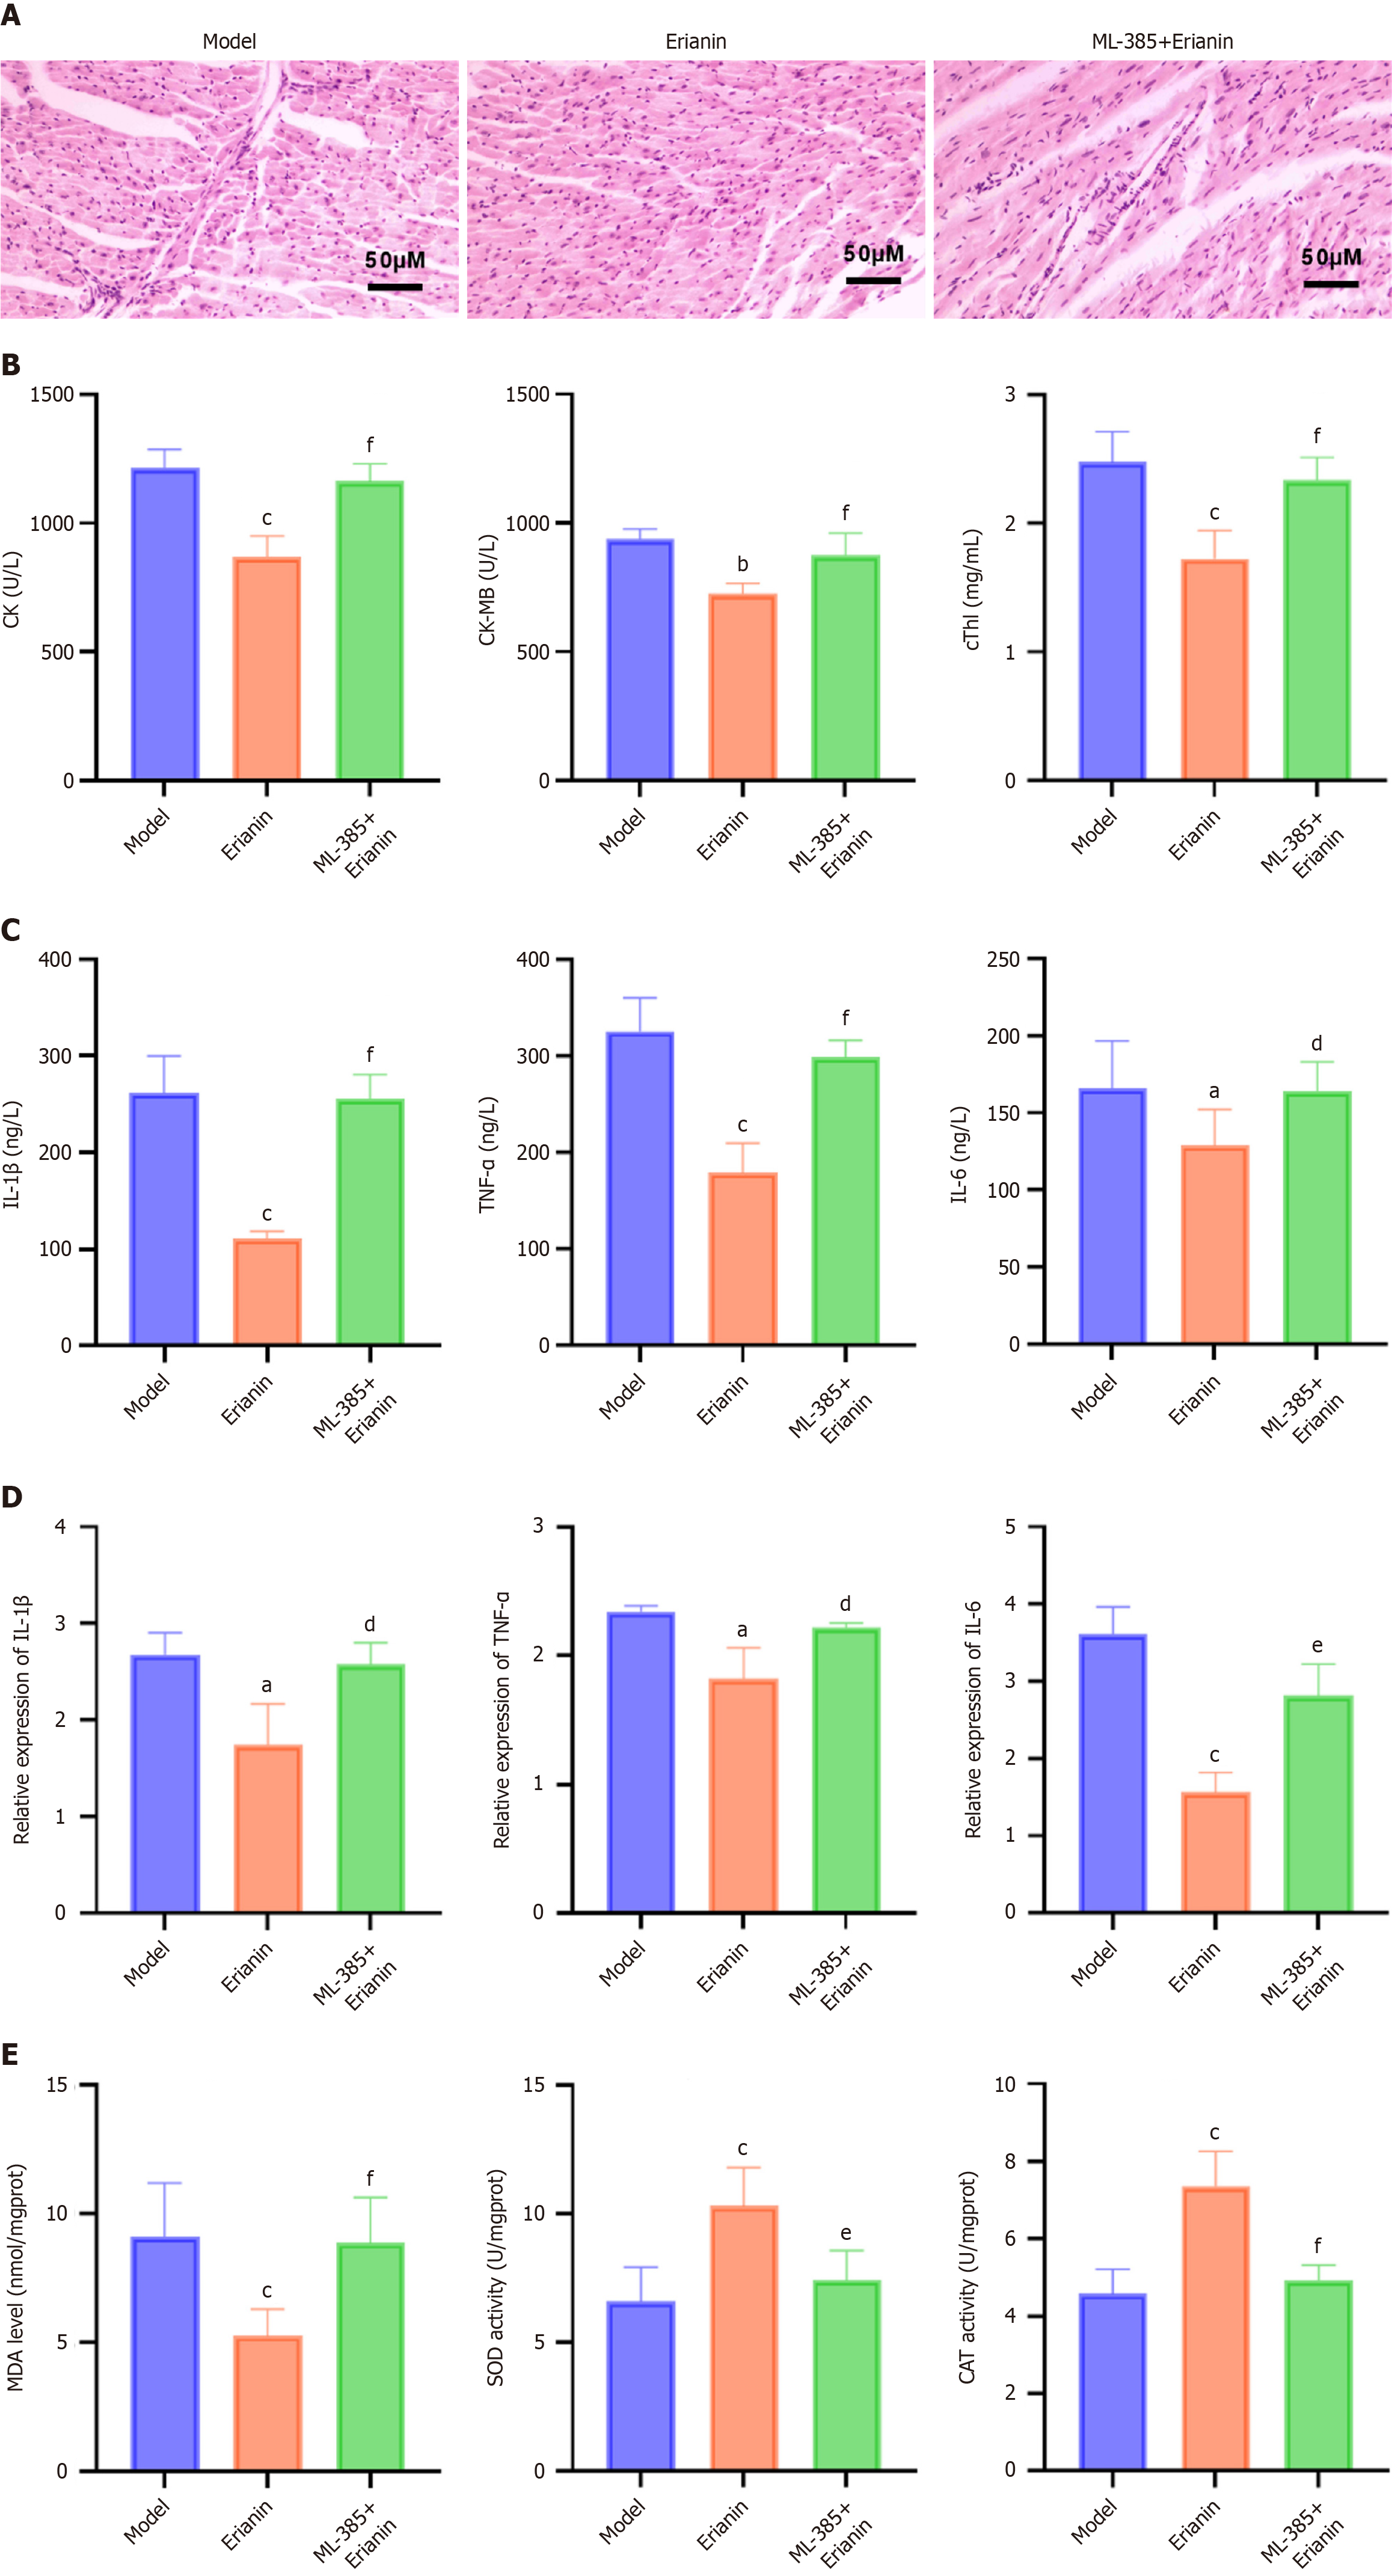
Figure 9 Inhibition of nuclear factor erythroid 2-related factor 2 reverses the effect of erianin on type 2 diabetes mellitus mice.
A: Hematoxylin-eosin-stained myocardial section; B: Markers of myocardial damage; C: Serum proinflammatory factors; D: mRNA levels of proinflammatory factors; E: Oxidative stress. Bar charts represent the mean ± SEM, n = 8. aP < 0.05 vs control group; bP < 0.01 vs control group; cP < 0.001 vs control group; dP < 0.05 vs model group; eP < 0.01 vs model group; fP < 0.001 vs model group; CK: Creatine kinase; CK-MB: Creatine kinase-isoenzymes; cThI: Cardiac troponin I; TNF-α: Tumor necrosis factor-α; IL: Interleukin; MDA: Malondialdehyde; SOD: Superoxide dismutase; CAT: Catalase.
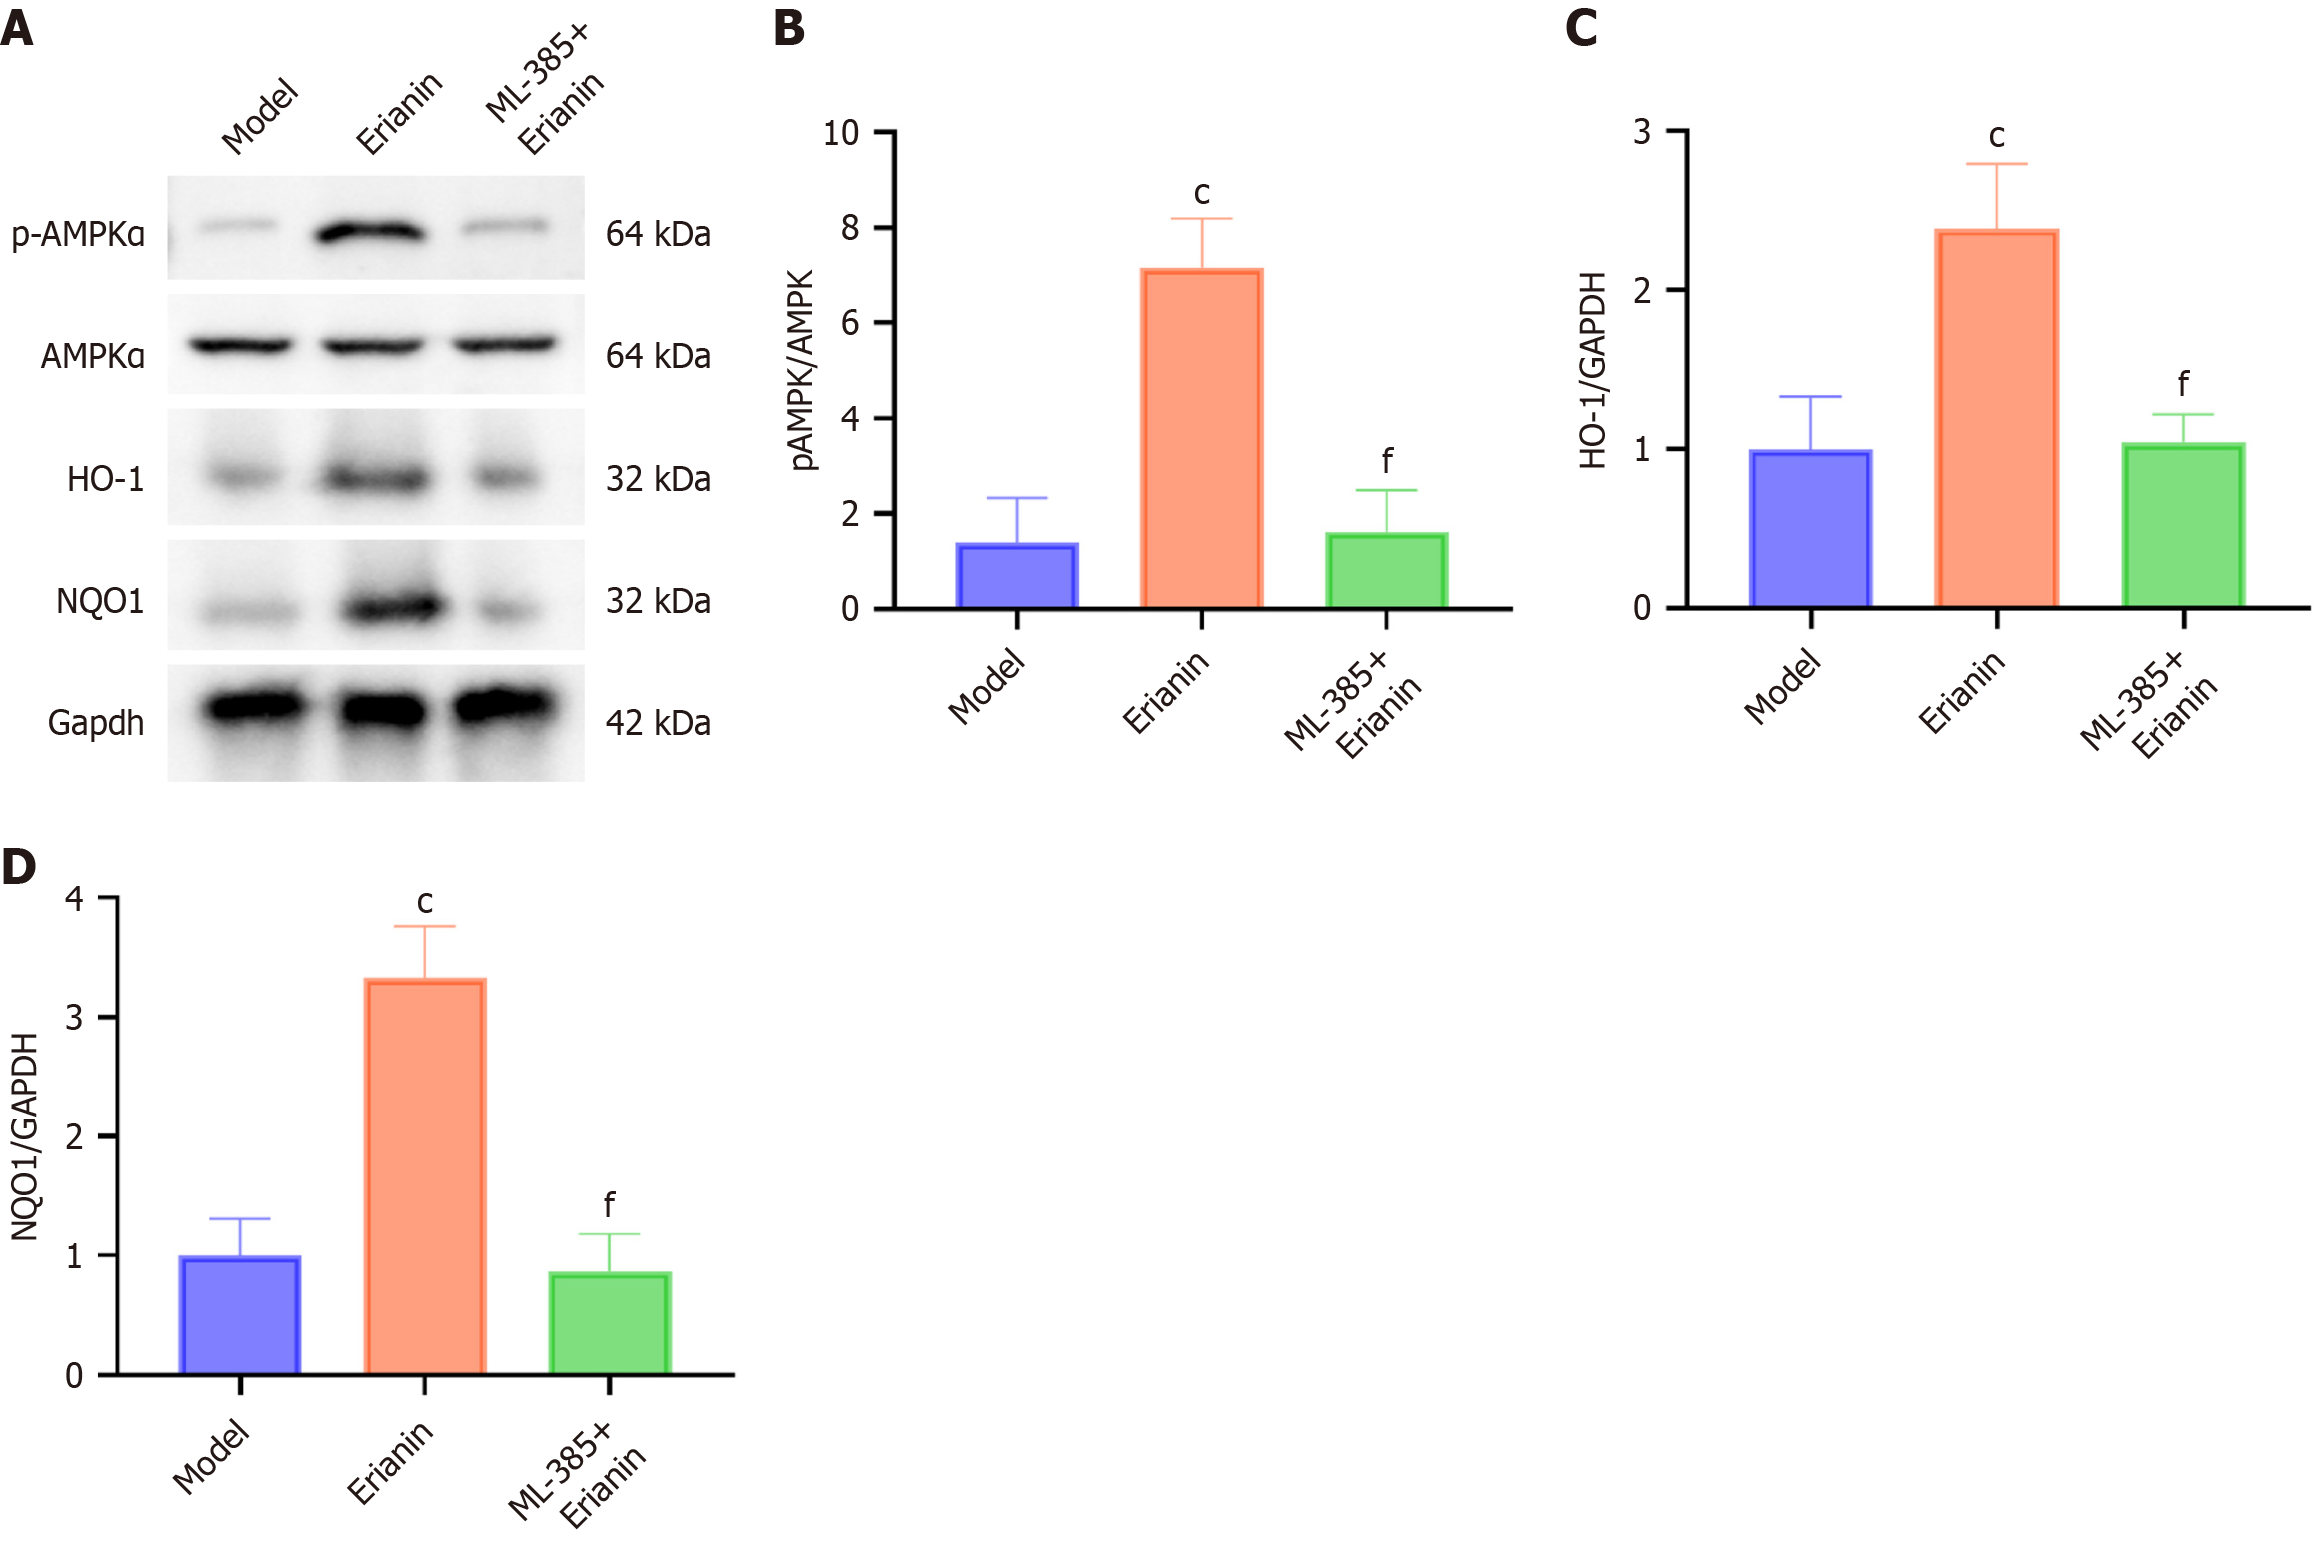
Figure 10 Inhibition of nuclear factor erythroid 2-related factor 2 reverses the effect of erianin on the expression of the nuclear factor erythroid 2-related factor 2 signaling pathway in myocardial tissue of mice with type 2 diabetes mellitus.
A: Western blot analysis of phosphorylated adenosine monophosphate-activated protein kinase (pAMPK), adenosine monophosphate-activated protein kinase, heme oxygenase-1 (HO-1), and NAD(P)H:quinone oxidoreductase 1 (NQO1) in type 2 diabetes mellitus mice; B: pAMPK protein levels; C: HO-1 protein levels; D: NQO1 protein levels. Bar charts represent the mean ± SEM, n = 8. cP < 0.001 vs control group; fP < 0.001 vs model group; AMPK: Adenosine monophosphate-activated protein kinase; pAMPK: Phosphorylated adenosine monophosphate-activated protein kinase; Nrf2: Nuclear factor erythroid 2-related factor 2; HO-1: Heme oxygenase-1; NQO1: NAD(P)H:quinone oxidoreductase 1; GAPDH: Glyceraldehyde 3-phosphate dehydrogenase.
- Citation: Chen JH, Dai XC, Quan ZJ, Liu XY. Erianin mitigates diabetic cardiomyopathy via adenosine monophosphate-activated protein kinase-nuclear factor erythroid 2-related factor 2-heme oxygenase-1 pathway activation. World J Diabetes 2025; 16(6): 103685
- URL: https://www.wjgnet.com/1948-9358/full/v16/i6/103685.htm
- DOI: https://dx.doi.org/10.4239/wjd.v16.i6.103685


