Copyright
©The Author(s) 2025.
World J Diabetes. Jun 15, 2025; 16(6): 103685
Published online Jun 15, 2025. doi: 10.4239/wjd.v16.i6.103685
Published online Jun 15, 2025. doi: 10.4239/wjd.v16.i6.103685
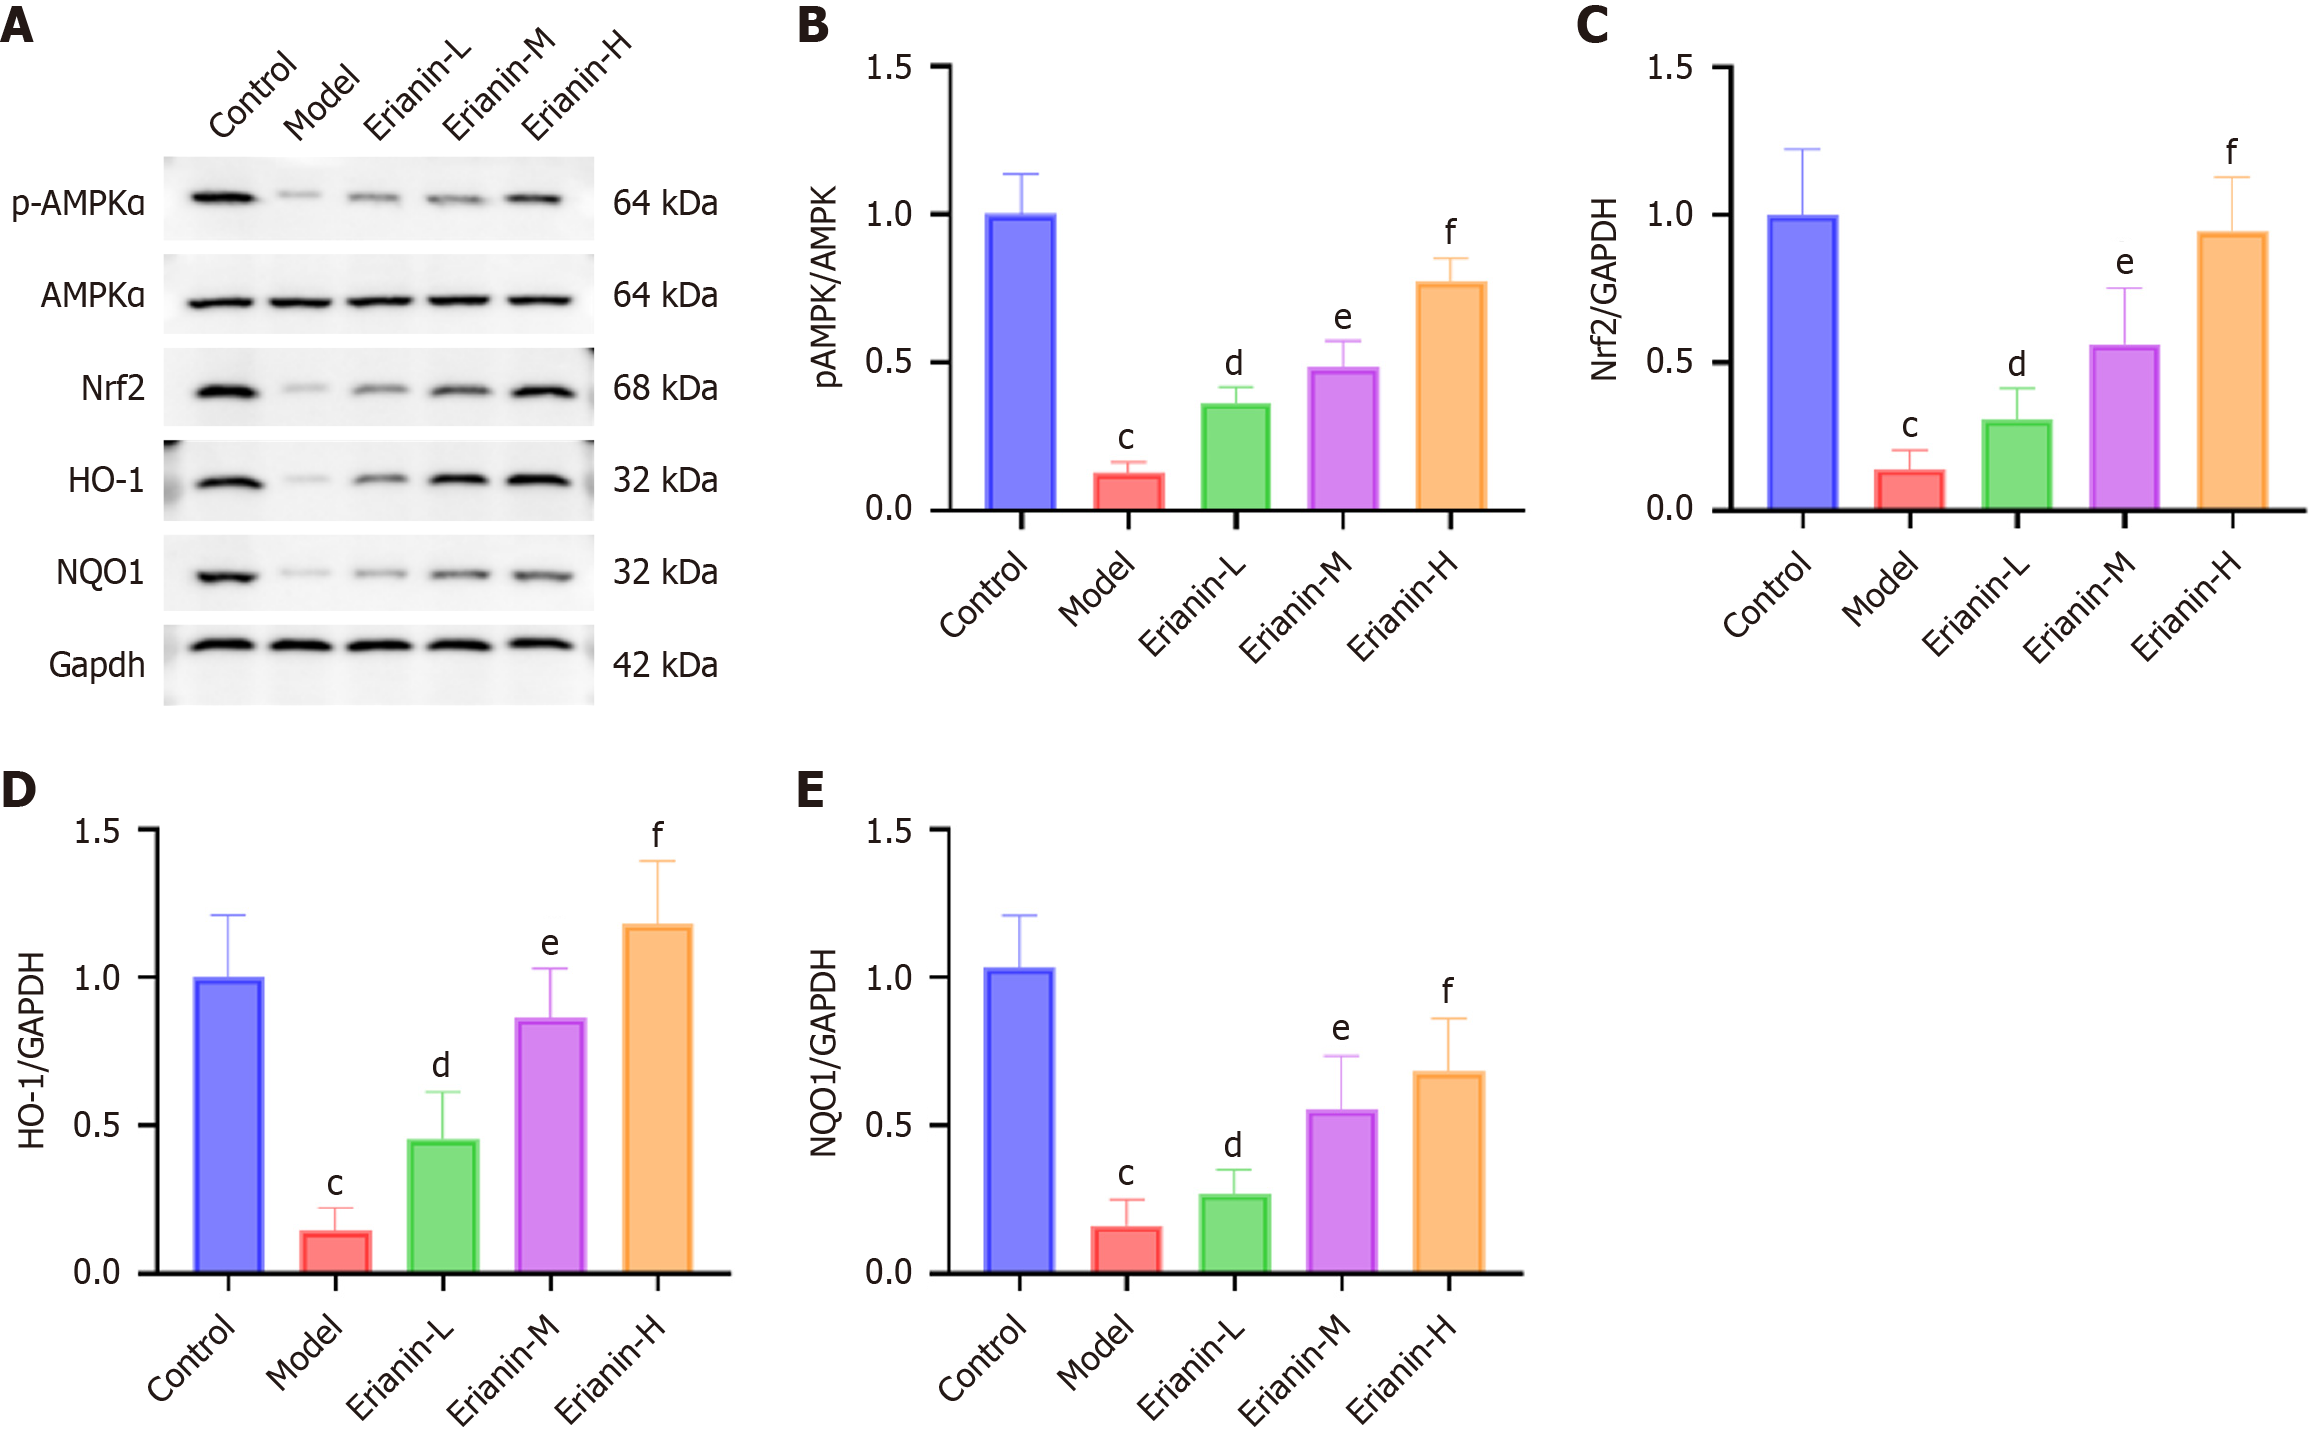
Figure 8 Expression of the nuclear factor erythroid 2-related factor 2 signaling pathway in myocardial tissue of mice with type 2 diabetes mellitus.
A: Western blot analysis of phosphorylated adenosine monophosphate-activated protein kinase (pAMPK), adenosine monophosphate-activated protein kinase, nuclear factor erythroid 2-related factor 2 (Nrf2), heme oxygenase-1 (HO-1), and NAD(P)H:quinone oxidoreductase 1 (NQO1); B: pAMPK protein levels; C: Nrf2 protein levels; D: HO-1 protein levels; E: NQO1 protein levels. Bar charts represent the mean ± SEM, n = 8. cP < 0.001 vs control group; dP < 0.05 vs model group; eP < 0.01 vs model group; fP < 0.001 vs model group; AMPK: Adenosine monophosphate-activated protein kinase; pAMPK: Phosphorylated adenosine monophosphate-activated protein kinase; Nrf2: Nuclear factor erythroid 2-related factor 2; HO-1: Heme oxygenase-1; NQO1: NAD(P)H:quinone oxidoreductase 1; GAPDH: Glyceraldehyde 3-phosphate dehydrogenase.
- Citation: Chen JH, Dai XC, Quan ZJ, Liu XY. Erianin mitigates diabetic cardiomyopathy via adenosine monophosphate-activated protein kinase-nuclear factor erythroid 2-related factor 2-heme oxygenase-1 pathway activation. World J Diabetes 2025; 16(6): 103685
- URL: https://www.wjgnet.com/1948-9358/full/v16/i6/103685.htm
- DOI: https://dx.doi.org/10.4239/wjd.v16.i6.103685


