Copyright
©The Author(s) 2022.
World J Diabetes. Sep 15, 2022; 13(9): 786-798
Published online Sep 15, 2022. doi: 10.4239/wjd.v13.i9.786
Published online Sep 15, 2022. doi: 10.4239/wjd.v13.i9.786
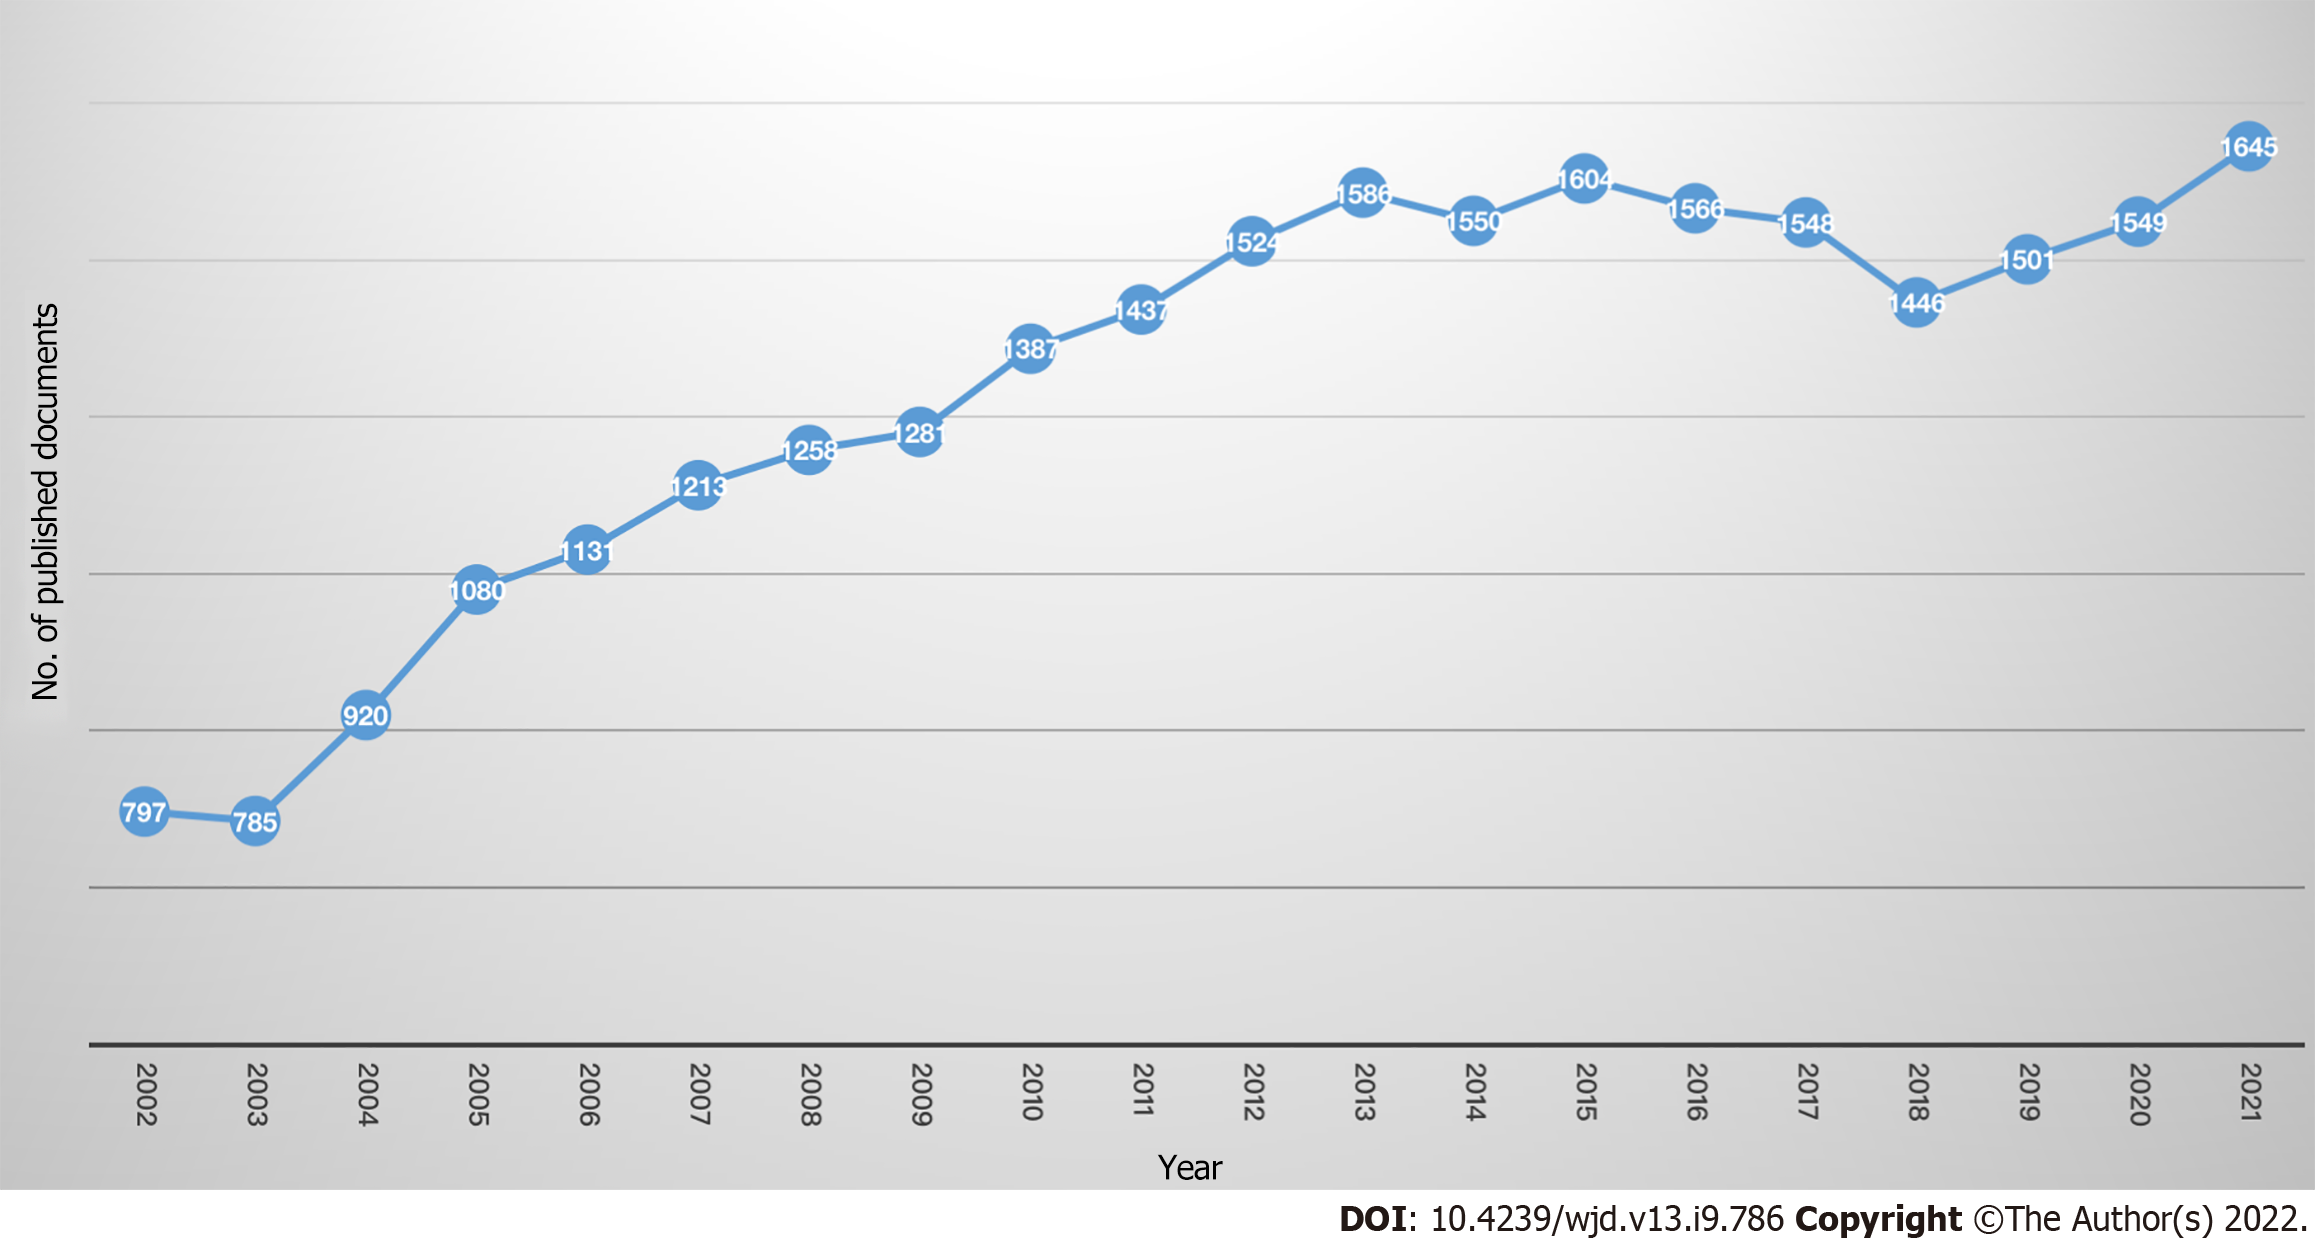
Figure 1 Annual growth of publications on insulin resistance research the last two decades (2002-2021).
Source: Own elaboration, based on Scopus; this figure created using EXCEL version 2013.
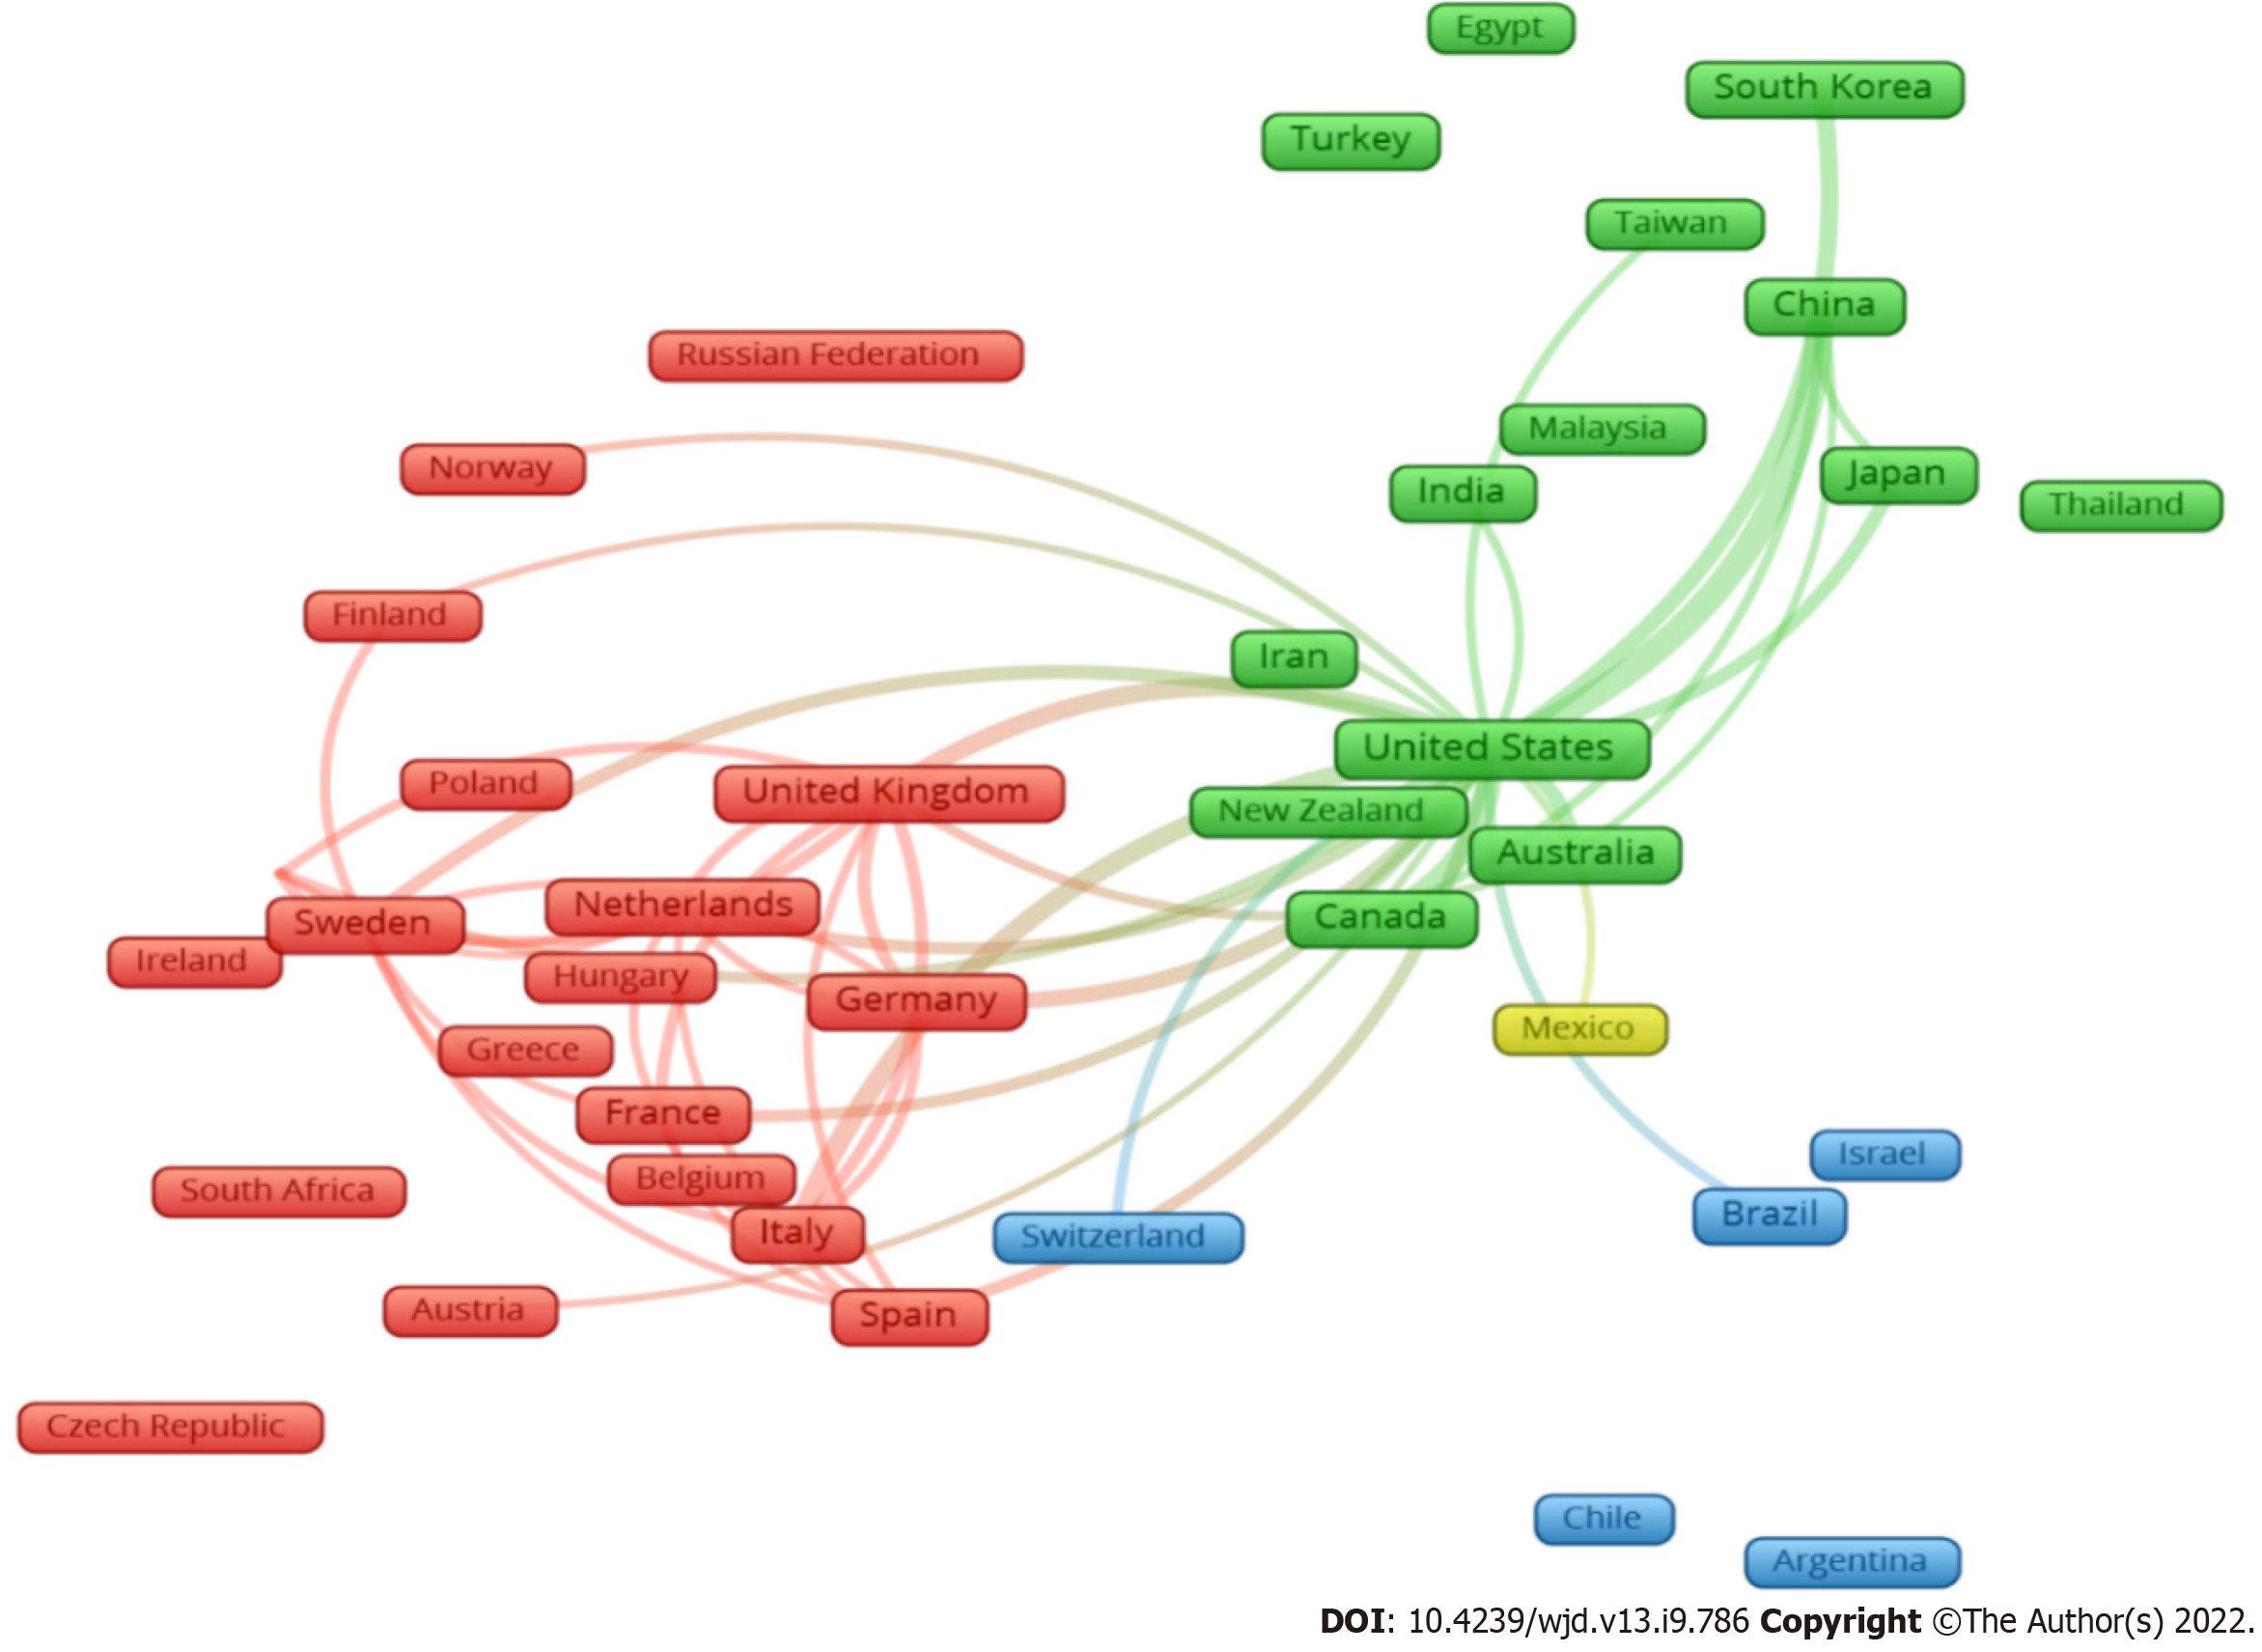
Figure 2 Map of visualization of worldwide research collaboration network.
Countries with short distances and extensive connecting lines had a significant research collaboration. This collaborative map was built when each country had at least 100 articles. Source: Own elaboration, based on Scopus database; figure created using VOSviewer Software.
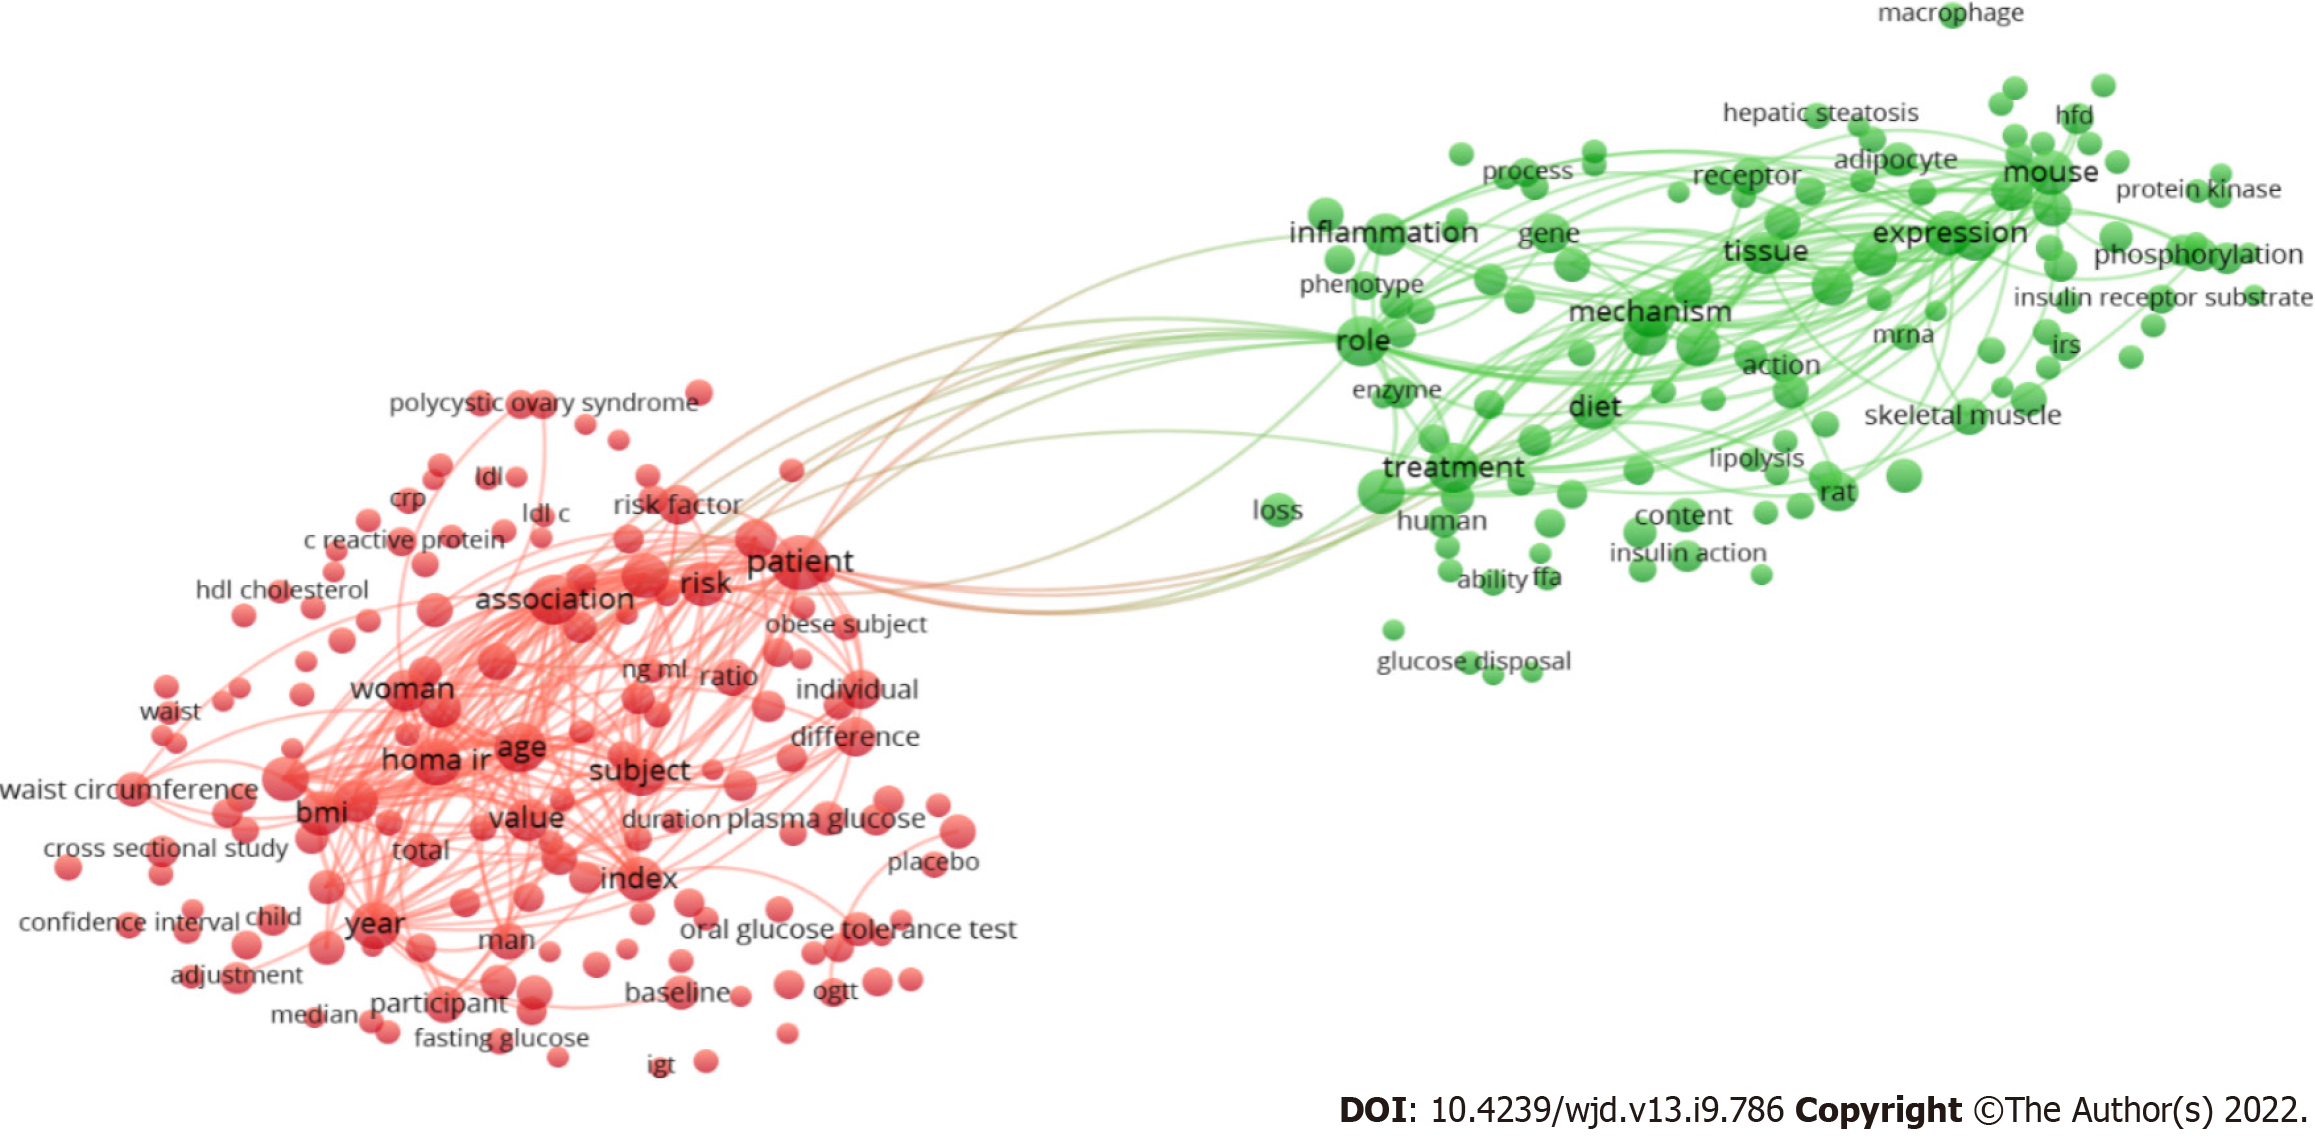
Figure 3 Network visualization map of terms in the titles/abstracts with a minimum occurrence of 300 or more.
Of the 250809 terms in this field, 456 achieved this threshold, were grouped into two clusters, and colored differently. Each cluster represents a general research theme present in the retrieved documents. Source: Own elaboration, based on Scopus database; figure created using VOSviewer Software. LDL-C: Low-density lipoprotein cholesterol; HDL: High-density lipoprotein; IGT: Impaired glucose tolerance; OGTT: Oral glucose tolerance test; BMI: Body mass index; HFD: High fat diet; IRS: Insulin receptor substrate; CRP: C-reactive protein; HOMA-IR: Homeostatic Model Assessment of Insulin Resistance.
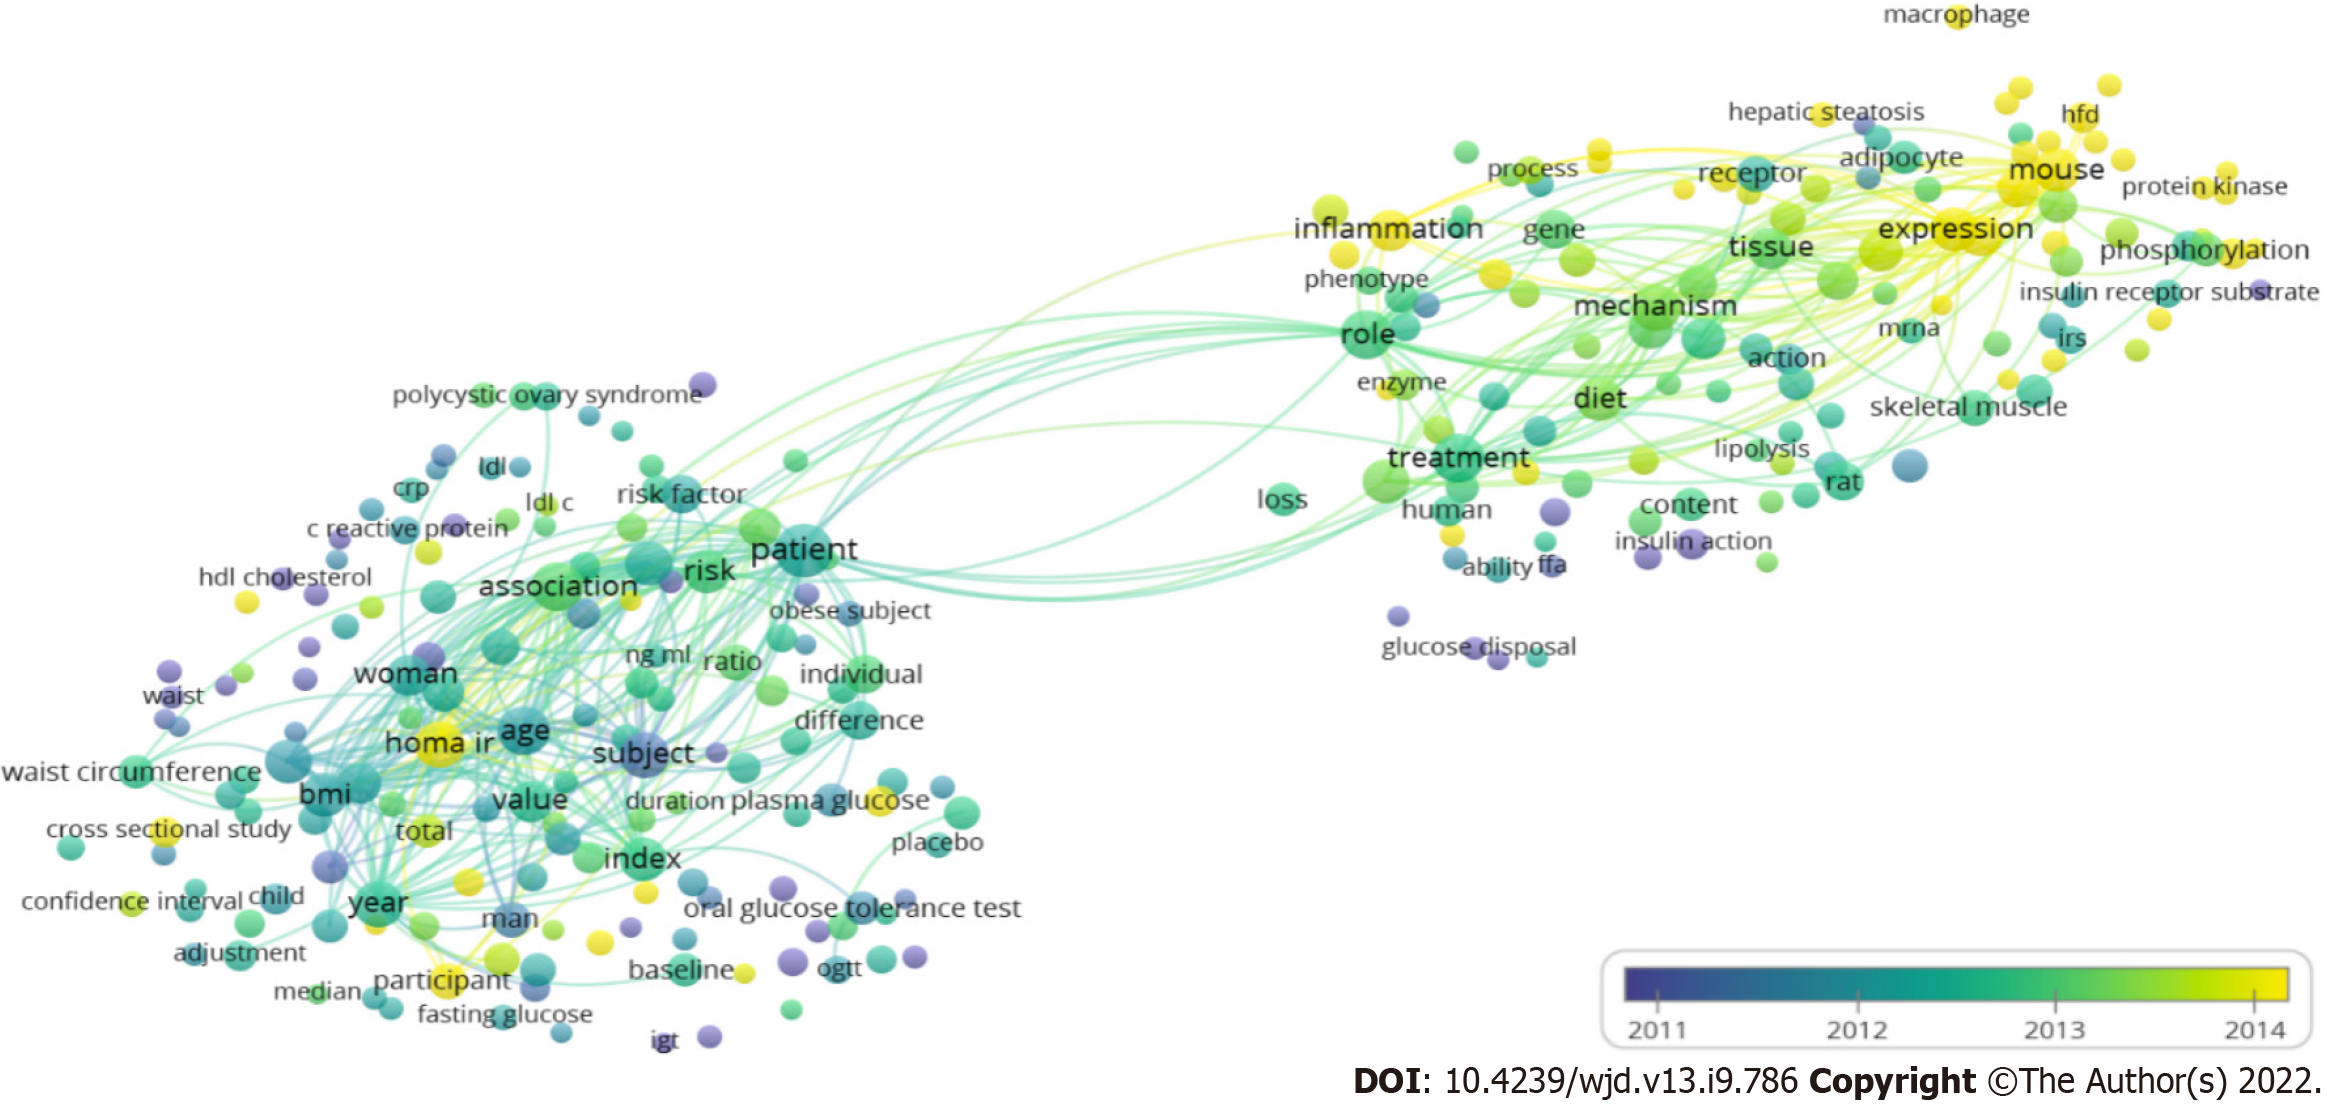
Figure 4 Network visualization map of terms in the title/abstract according to the average timing of their appearance.
Blue represents early appearance, and yellow represents late appearance. Source: Own elaboration, based on Scopus database; figure created using VOSviewer Software. LDL-C: Low-density lipoprotein cholesterol; HDL: High-density lipoprotein; IGT: Impaired glucose tolerance; OGTT: Oral glucose tolerance test; BMI: Body mass index; HFD: High fat diet; IRS: Insulin receptor substrate; CRP: C-reactive protein; HOMA-IR: Homeostatic Model Assessment of Insulin Resistance.
- Citation: Zyoud SH, Shakhshir M, Koni A, Abushanab AS, Shahwan M, Jairoun AA, Al Subu R, Abu Taha A, Al-Jabi SW. Mapping the global research landscape on insulin resistance: Visualization and bibliometric analysis. World J Diabetes 2022; 13(9): 786-798
- URL: https://www.wjgnet.com/1948-9358/full/v13/i9/786.htm
- DOI: https://dx.doi.org/10.4239/wjd.v13.i9.786


