Copyright
©The Author(s) 2022.
World J Diabetes. Aug 15, 2022; 13(8): 613-621
Published online Aug 15, 2022. doi: 10.4239/wjd.v13.i8.613
Published online Aug 15, 2022. doi: 10.4239/wjd.v13.i8.613
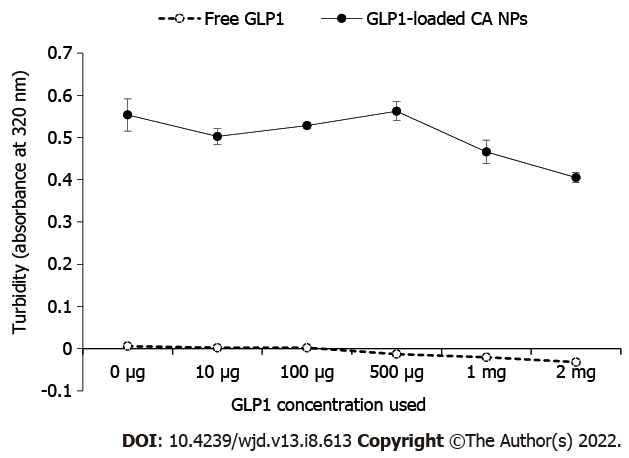
Figure 1 Turbidity measurement.
The turbidity of samples measured at absorbance 320 nm was an indicator of carbonate apatite nanoparticles (CA NPs) particles growth. The growth of glucagon-like peptide-1 (GLP1)-loaded CA NPs declined in inverse proportion as the concentration of GLP1 increased.
Figure 2 The field emission-scanning electron microscope images of the carbonate apatite nanoparticles.
Particles approximate 200 nm in size were formed when carbonate apatite nanoparticles (CA NPs) were fabricated without glucagon-like peptide-1 (GLP1) (A). When the CA NPs were fabricated with 1 μg GLP1 (B) and 10 μg GLP1 (C), various sizes of particles were observed with the latter preparation gave a greater size heterogeneity.
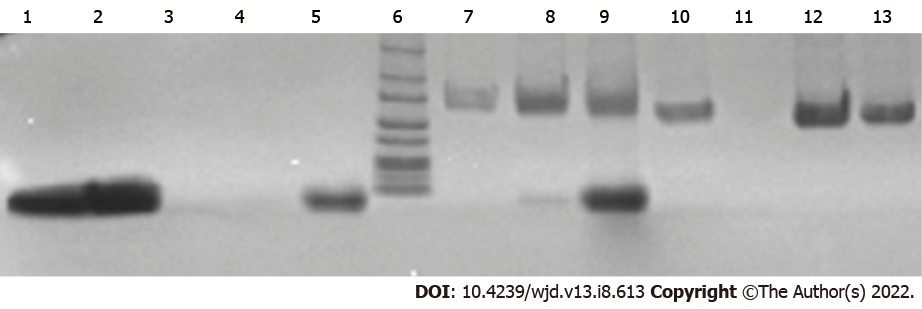
Figure 3 The binding affinity of glucagon-like peptide-1 towards carbonate apatite nanoparticles.
Lane 1. Free glucagon-like peptide-1 (GLP1) 50 μg; 2. Free GLP1 100 μg; 3. GLP1 500 μg + Ca2+; 4. GLP1 1 mg + Ca2+; 5. GLP1 2 mg + Ca2+; 6. protein ladder; 7. GLP1 500 μg + Ca2+ +1% fetal bovine serum (FBS); 8. GLP1 1 mg + Ca2+ + 1% FBS; 9. GLP1 2 mg + Ca2+ + 1% FBS; 10. Dulbecco’s Modified Eagle Medium (DMEM) + Ca2+ + 1% FBS; 11. Blank; 12. 1% FBS; 13. Ca2+ + 1% FBS. GLP1 band was observed from carbonate apatite nanoparticles prepared with 1 mg and 2 mg GLP1, as shown in Lanes 8 and 9, along with the FBS band.
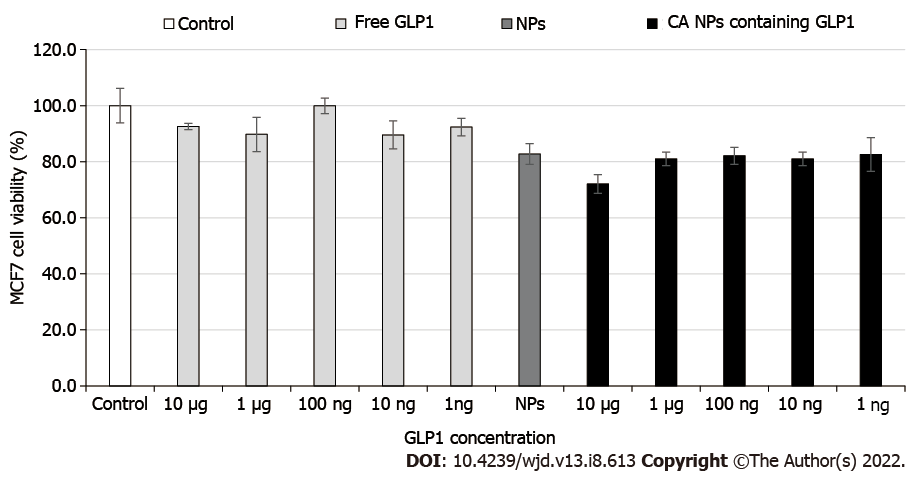
Figure 4 The effect of glucagon-like peptide-1 nanoparticles on the viability of Michigan Cancer Foundation-7 cells.
The carbonate apatite nanoparticles with increasing glucagon-like peptide-1 concentrations did not affect the viability of the cells.
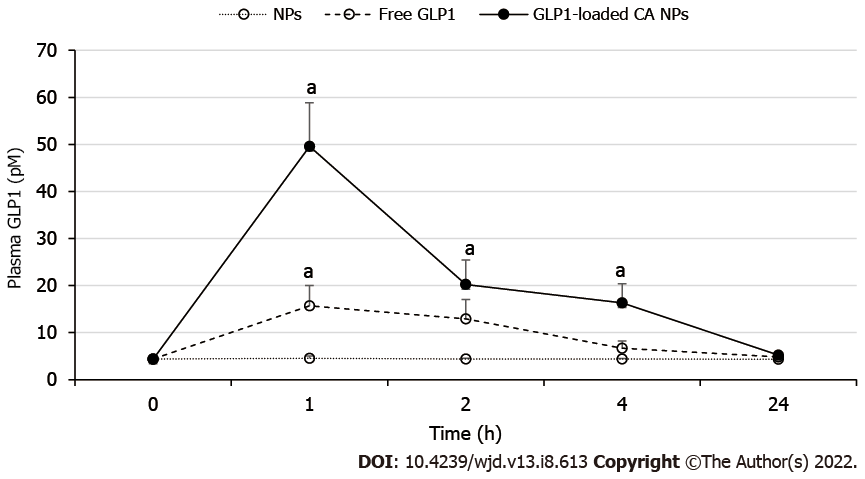
Figure 5 Plasma-time profile of glucagon-like peptide-1.
At 1 h post-treatment, Sprague Dawley rats (n = 6) administered with carbonate apatite nanoparticles containing 1 mg/kg of glucagon-like peptide-1 (GLP1) showed significantly higher plasma GLP1 level than the control rats and 1 mg/kg of free GLP1-treated rats (aP < 0.05). The increased plasma GLP1, which was continued to be seen at 4 h, showed that GLP1 was released from the particles in a controlled manner.
- Citation: Ibnat N, Zaman R, Uddin MB, Chowdhury E, Lee CY. Improved systemic half-life of glucagon-like peptide-1-loaded carbonate apatite nanoparticles in rats. World J Diabetes 2022; 13(8): 613-621
- URL: https://www.wjgnet.com/1948-9358/full/v13/i8/613.htm
- DOI: https://dx.doi.org/10.4239/wjd.v13.i8.613


