Copyright
©The Author(s) 2022.
World J Diabetes. Mar 15, 2022; 13(3): 240-250
Published online Mar 15, 2022. doi: 10.4239/wjd.v13.i3.240
Published online Mar 15, 2022. doi: 10.4239/wjd.v13.i3.240
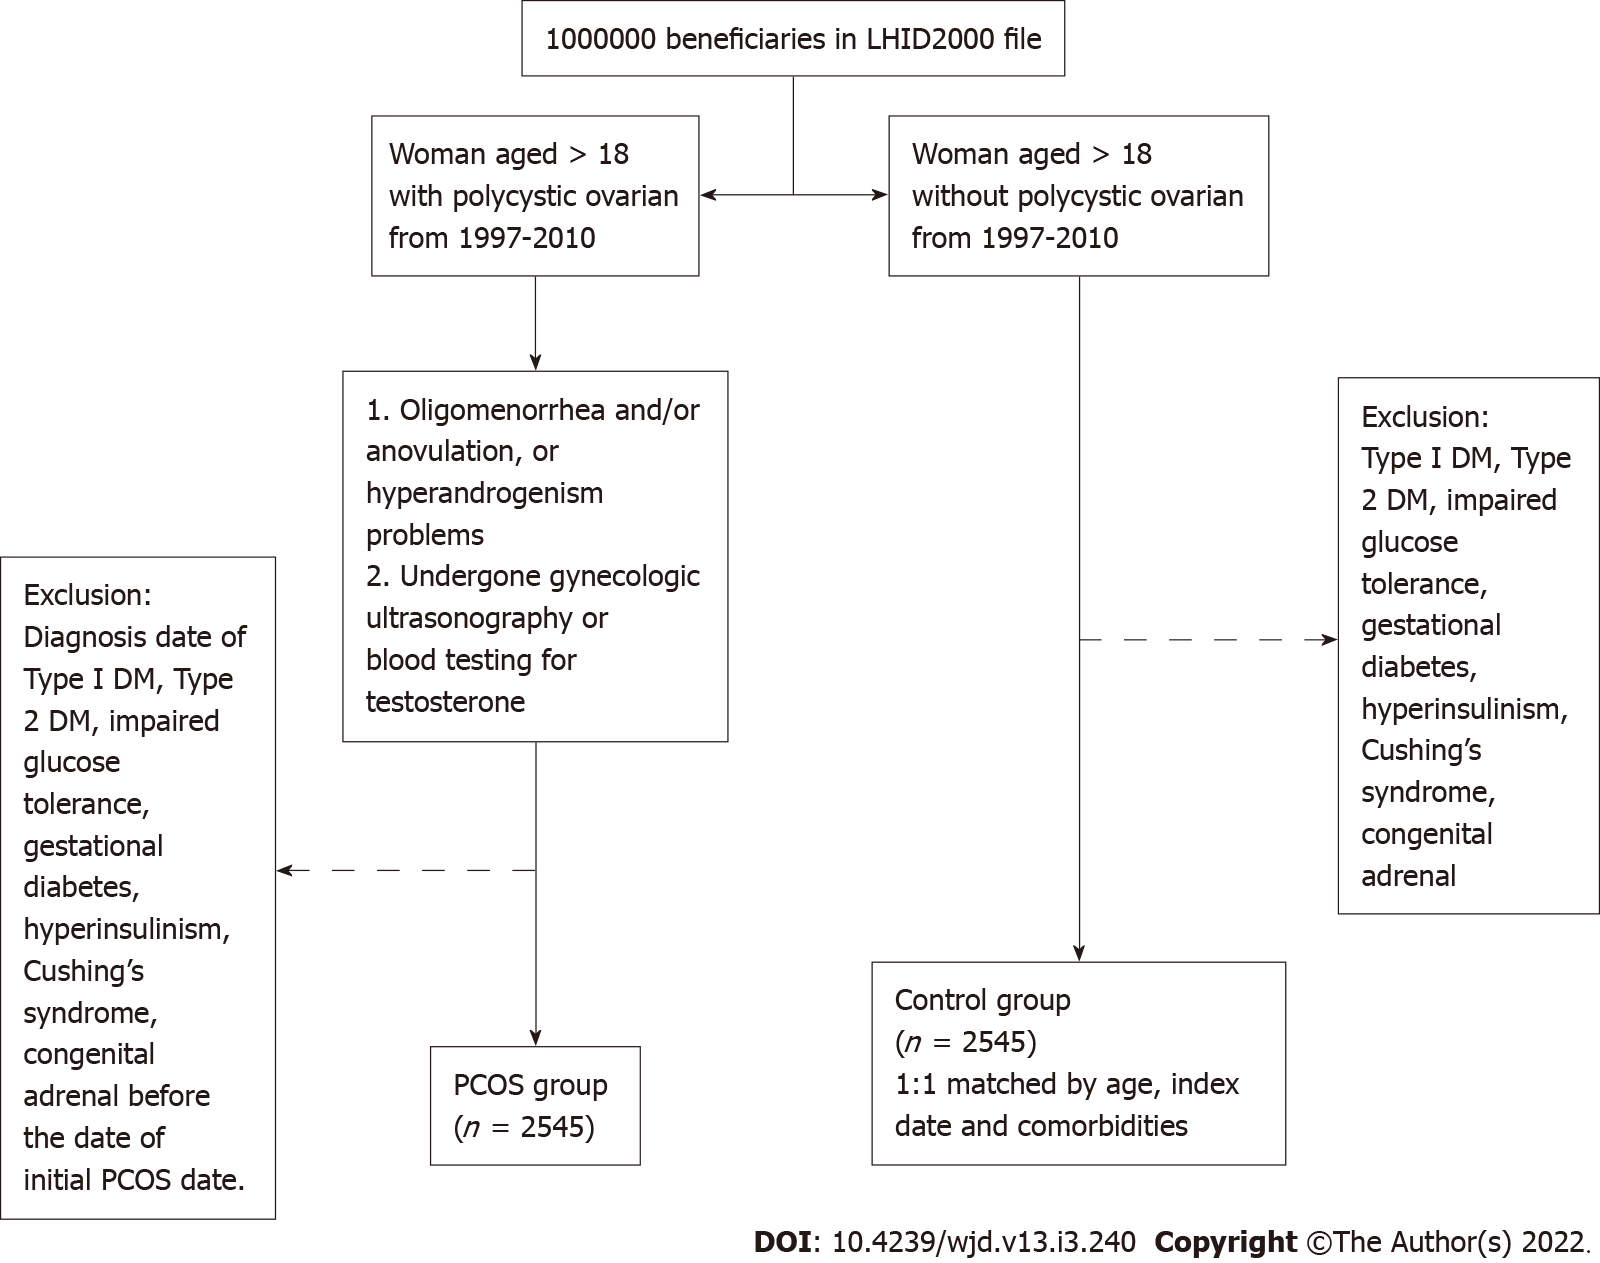
Figure 1 Flow diagram of the recruitment of subjects from the 1 million samples randomly selected from the Taiwanese National Health Insurance Research Database from 1997 to 2010.
LHID2000: Longitudinal Health Insurance Database 2000; PCOS: Polycystic ovary syndrome.
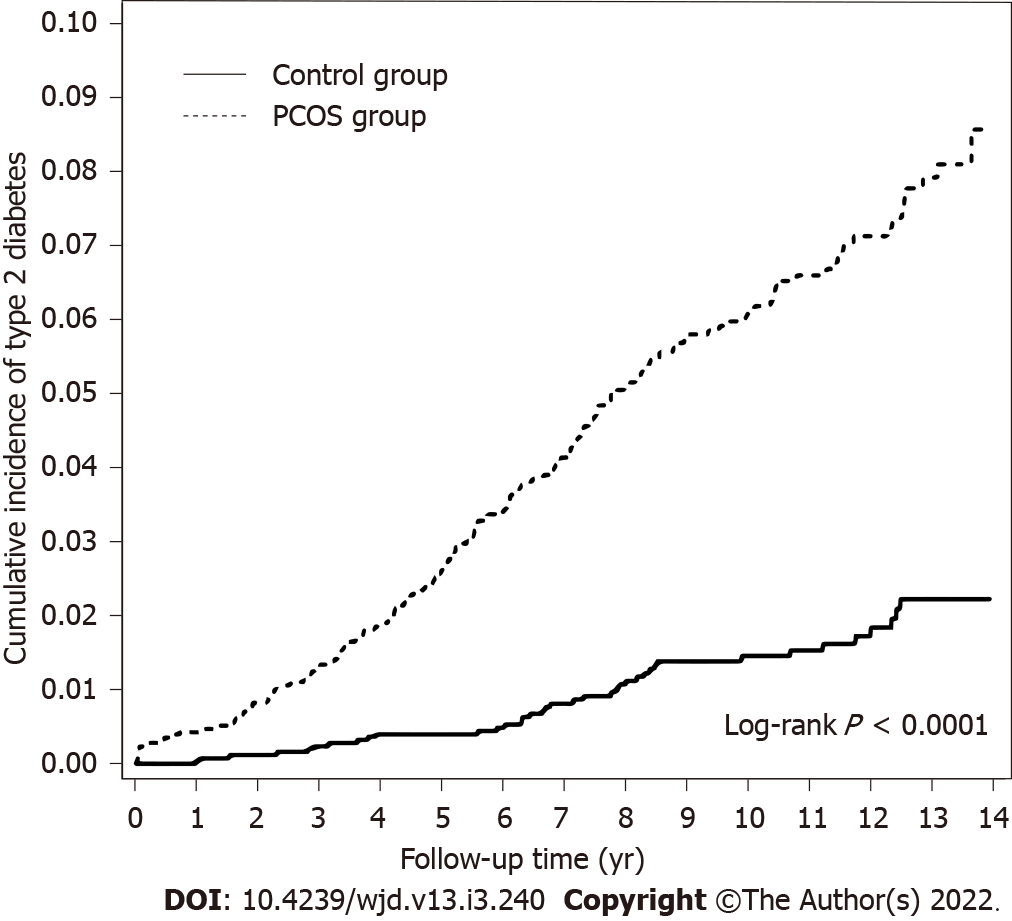
Figure 2 Kaplan–Meier curves for the cumulative incidence of type 2 diabetes of the polycystic ovary syndrome and control groups.
PCOS: Polycystic ovary syndrome.
- Citation: Liao WT, Huang JY, Lee MT, Yang YC, Wu CC. Higher risk of type 2 diabetes in young women with polycystic ovary syndrome: A 10-year retrospective cohort study. World J Diabetes 2022; 13(3): 240-250
- URL: https://www.wjgnet.com/1948-9358/full/v13/i3/240.htm
- DOI: https://dx.doi.org/10.4239/wjd.v13.i3.240


