Copyright
©The Author(s) 2022.
World J Diabetes. Feb 15, 2022; 13(2): 110-125
Published online Feb 15, 2022. doi: 10.4239/wjd.v13.i2.110
Published online Feb 15, 2022. doi: 10.4239/wjd.v13.i2.110
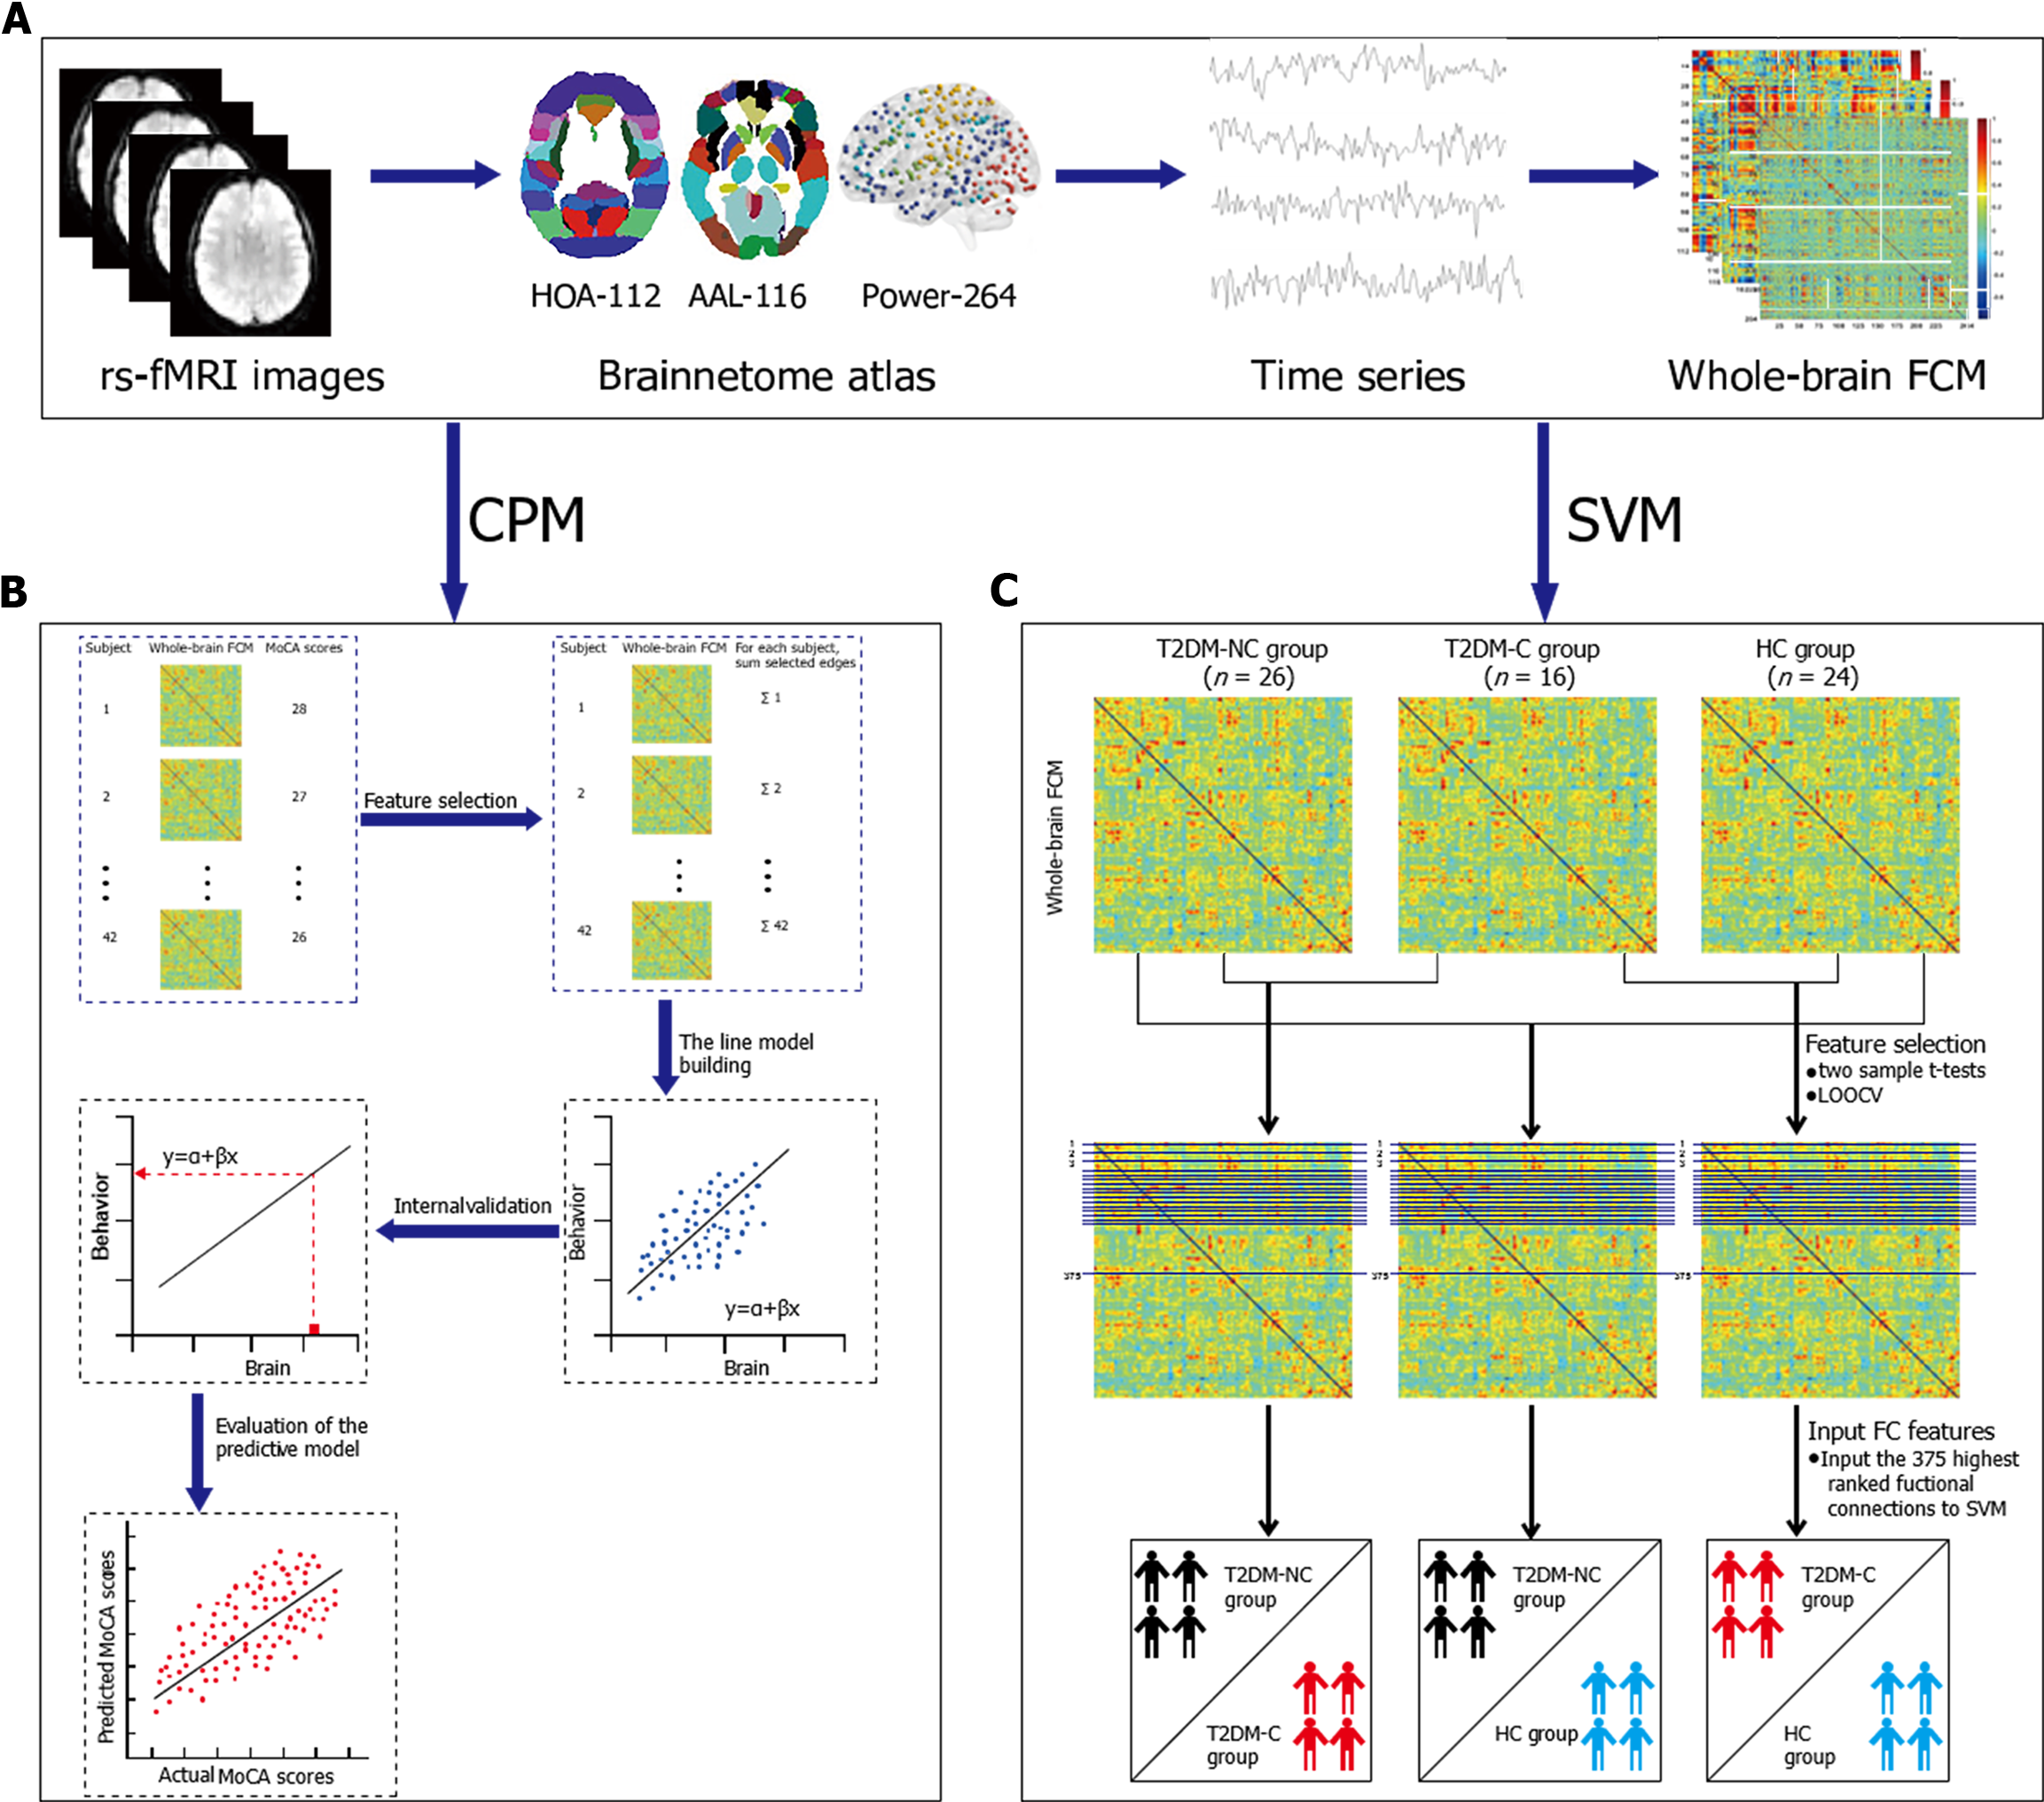
Figure 1 The prediction and classification flowchart.
A: Relevant information from image preprocessing to feature identification; B: Detailed steps of connectome-based predictive modeling; C: Detailed steps of support vector machine. rs-fMRI: Resting state functional magnetic resonance imaging; HOA -112: Harvard Oxford atlas; AAL-116: Automated Anatomical Labeling; Power-264: 264-region functional atlas introduced by Power et al; FCM: Functional connectivity matrix; MoCA: Montreal Cognitive Assessment; T2DM: Type 2 diabetes mellitus; T2DM-C/T2DM-NC: Patients with T2DM with the presence/absence of mild cognitive impairment; HC: Healthy controls; LOOCV: Leave-one-out cross validation; FC: Functional connectivity.
Figure 2 The connectome-based predictive modeling predicted the Montreal Cognitive Assessment scores.
Scatterplot of predicted the Montreal Cognitive Assessment (MoCA) scores vs. actual MoCA scores. Predicted scores were derived from edges positively correlated with prediction (positive network). r: The r value of Pearson's correlation of predicted the MoCA scores and actual MoCA scores; P: P values from permutation tests (5000 times); T2DM: Type 2 diabetes mellitus; T2DM-C/ T2DM-NC: Patients with T2DM with the presence/absence of mild cognitive impairment; HOA -112: Harvard Oxford atlas; AAL-116: Automated Anatomical Labeling; Power-264: 264-region functional atlas introduced by Power et al.
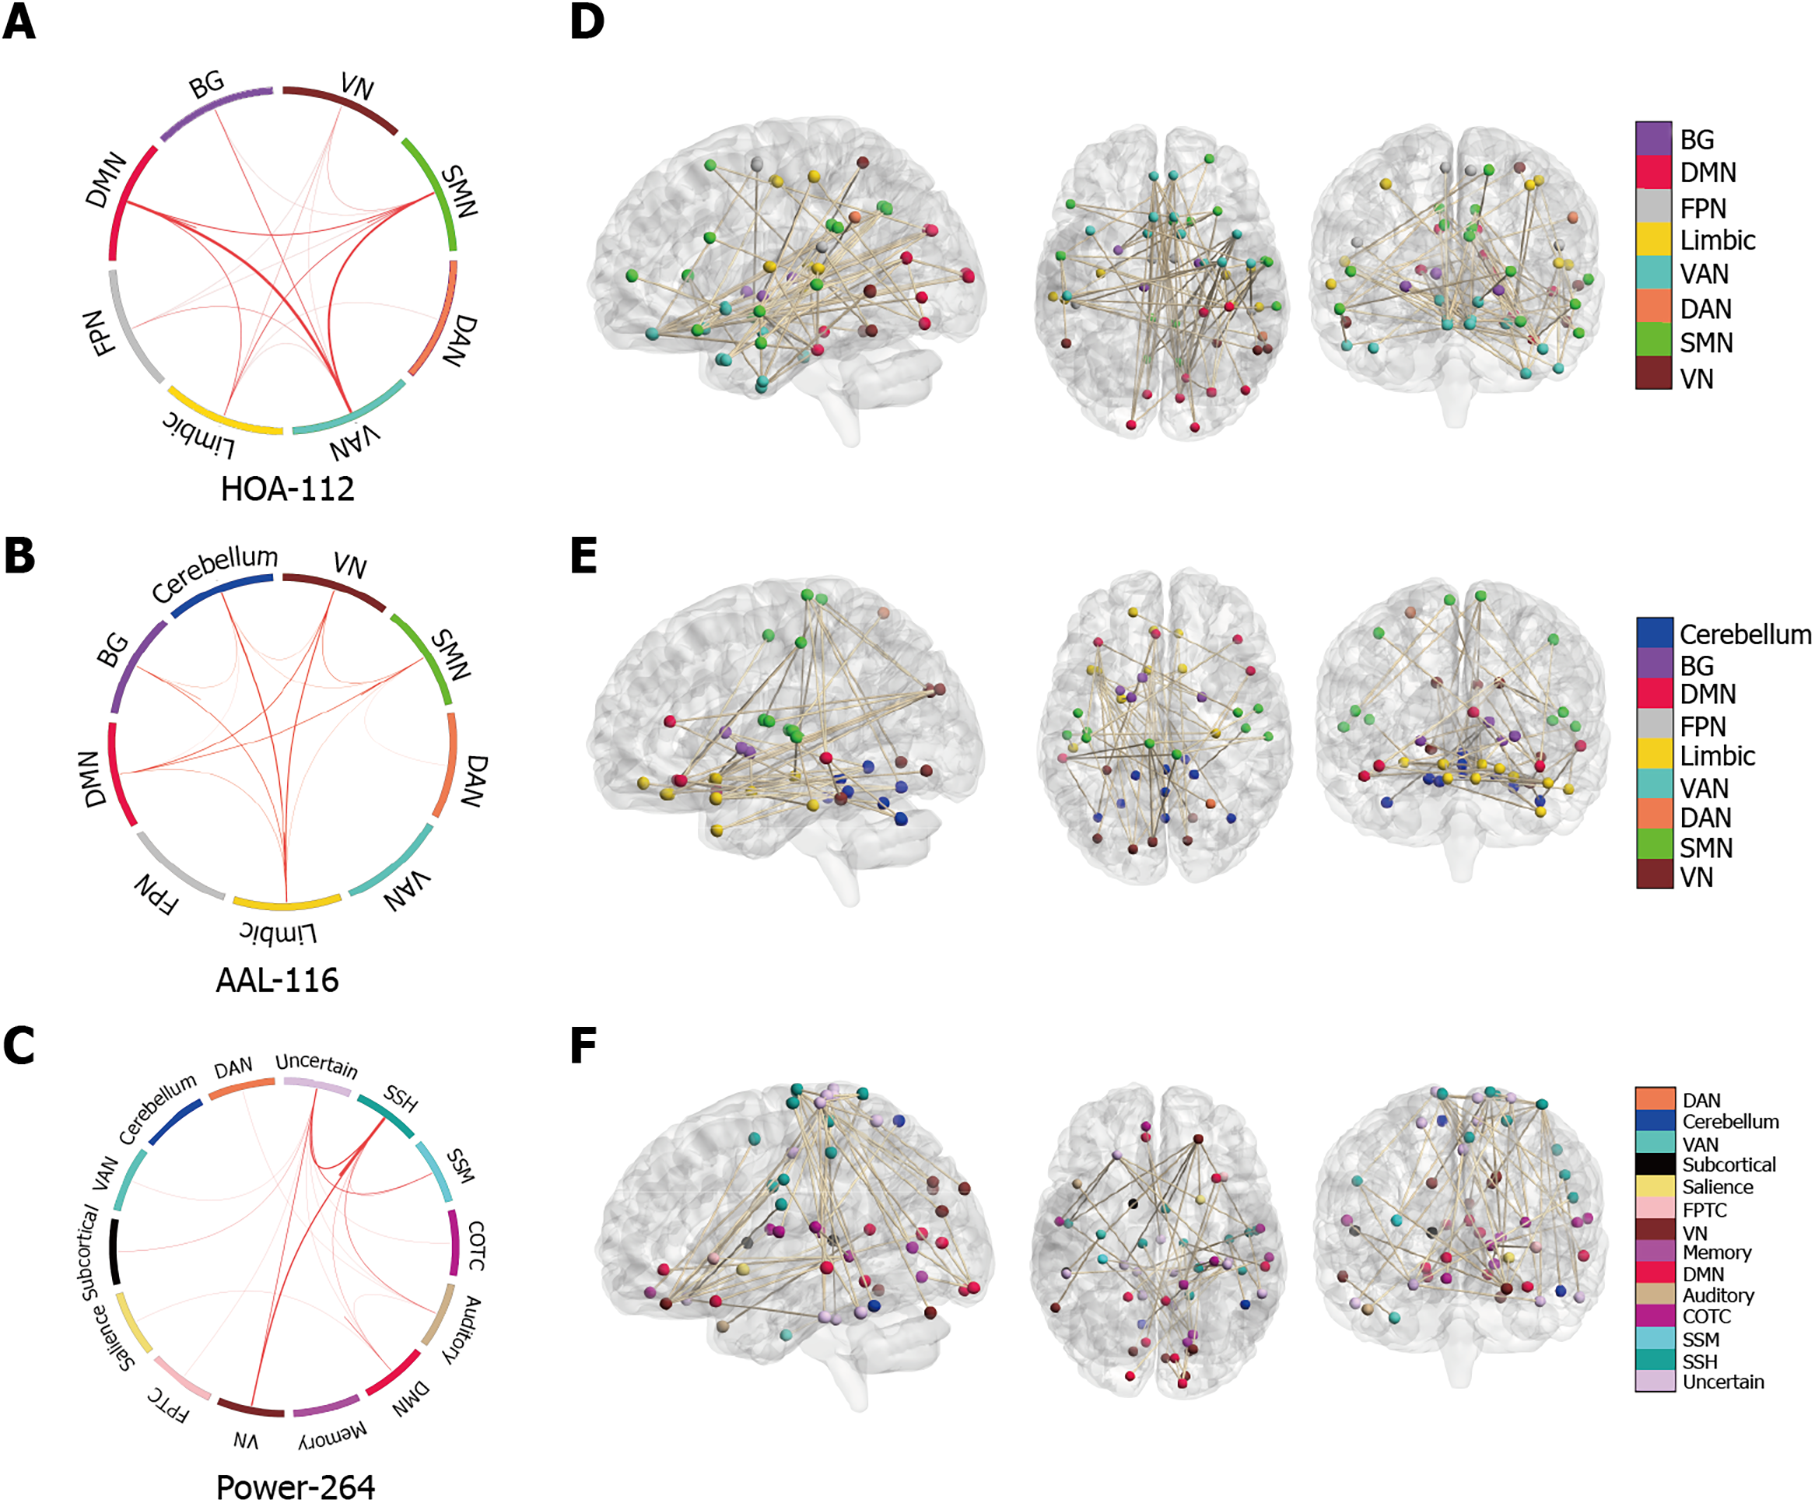
Figure 3 Functional connections predicting individual Montreal Cognitive Assessment scores based on three atlases.
A-C: On the far left of the image above, edges were classified as macroscale brain regions, and visualized by circle plots, in which nodes are grouped based on their anatomic location. The resting-state network (RSN) of the brain based on three templates is represented by a rectangle on the circumference of the big circle. The lines connecting two rectangles represent the connections between the corresponding one or two RSNs, including inter-network connections and intra-network connections. The thickness of the line represents the weight (i.e., connectome-based predictive modeling weight) of the connection. The thicker the line, the larger the weight. This visualization was created using Circos (http://circos.ca/). D-F: On the right of the image above, the same edges are visualized in the brain. The lines represent edges connecting the spheres, which in turn represent nodes. A legend indicating the approximate anatomic ‘lobe’ is shown in the far right side of the figure. HOA -112: Harvard Oxford atlas; AAL-116: Automated Anatomical Labeling; Power-264: 264-region functional atlas introduced by Power et al; VN: Visual Network; SMN: Sensory-motor Network; DAN: Dorsal Attention Network; VAN: Ventral Attention Network; Limbic: Limbic System; FPN: Fronto-parietal network; DMN: Default mode network; BG: Basal ganglia; SSH: Sensory somatomotor hand; SSM: Sensory somatomotor mouth; COTC: Cingulo-opercular task control; Memory: Memory retrieval; FPTC: Fronto-parietal task control.
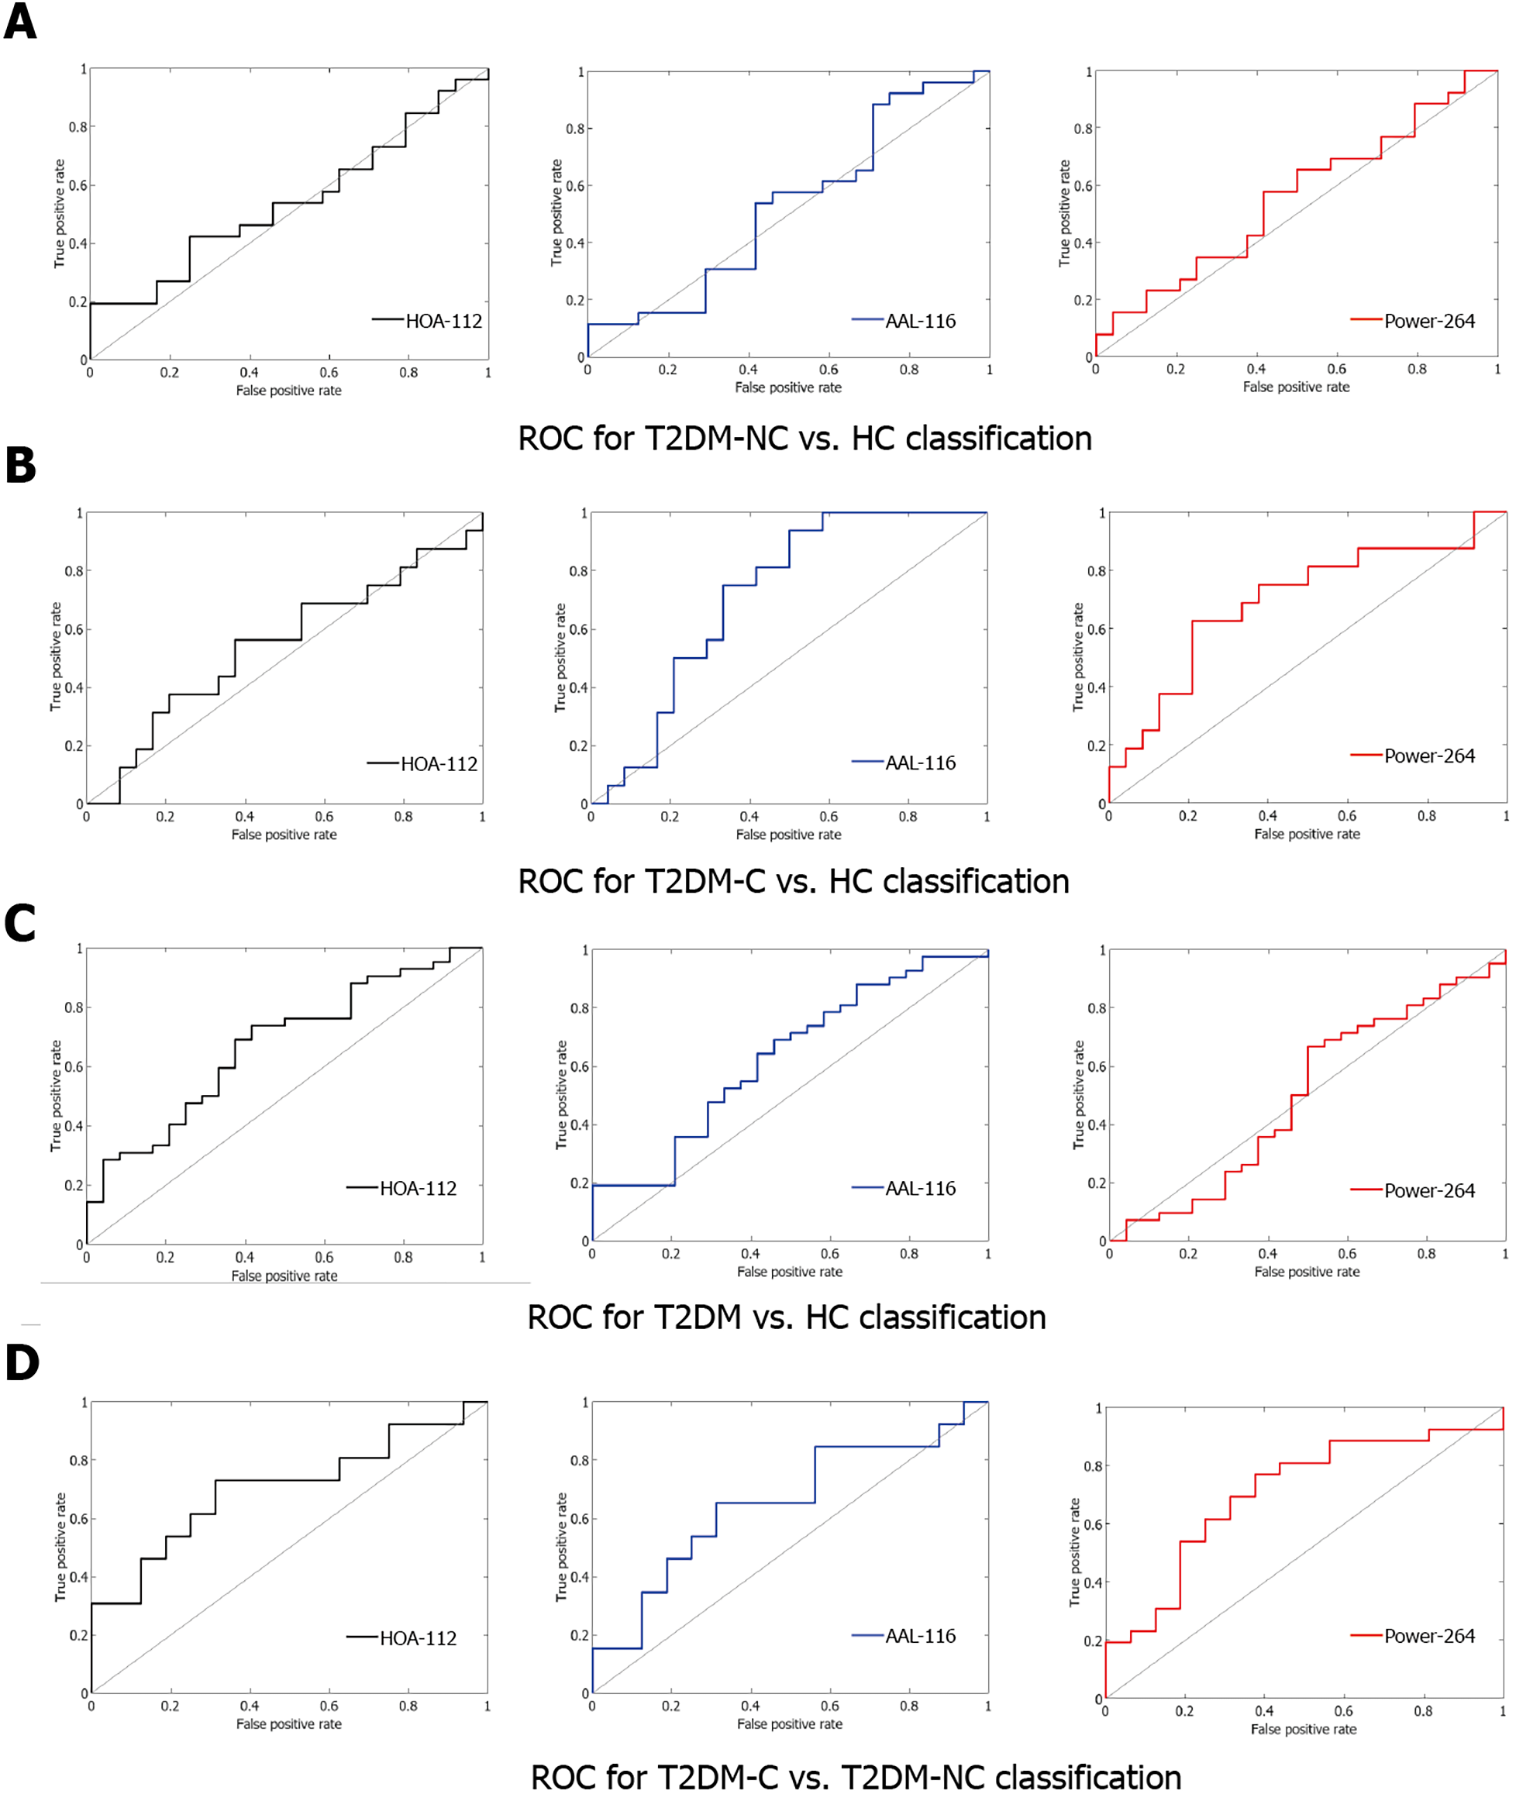
Figure 4 Classification efficiency of support vector machine based on three atlases.
The classification effect was not very ideal. A: The area under curve (AUC) value of patients with type 2 diabetes mellitus (T2DM) with the absence of mild cognitive impairment (T2DM-NC) Verus healthy controls (HC) group was 0.54 [Harvard Oxford (HOA-112) atlas], 0.53 [Automated Anatomical Labeling (AAL-116) atlas], 0.56 [264-region functional (Power-264) atlas]; B: the AUC value of patients with T2DM with the presence of mild cognitive impairment (T2DM-C) Verus HC group was 0.54 (HOA-112 atlas), 0.72 (AAL-116 atlas), 0.70 (Power-264 atlas); C: the AUC value of T2DM Verus HC group was 0.67 (HOA-112 atlas), 0.63 (AAL-116 atlas), 0.50 (Power-264 atlas); D: the AUC value of T2DM-C Verus T2DM-NC group was 0.70 (HOA-112 atlas and Power-264 atlas), 0.65(AAL-116 atlas). ROC: receiver operating characteristic curve.
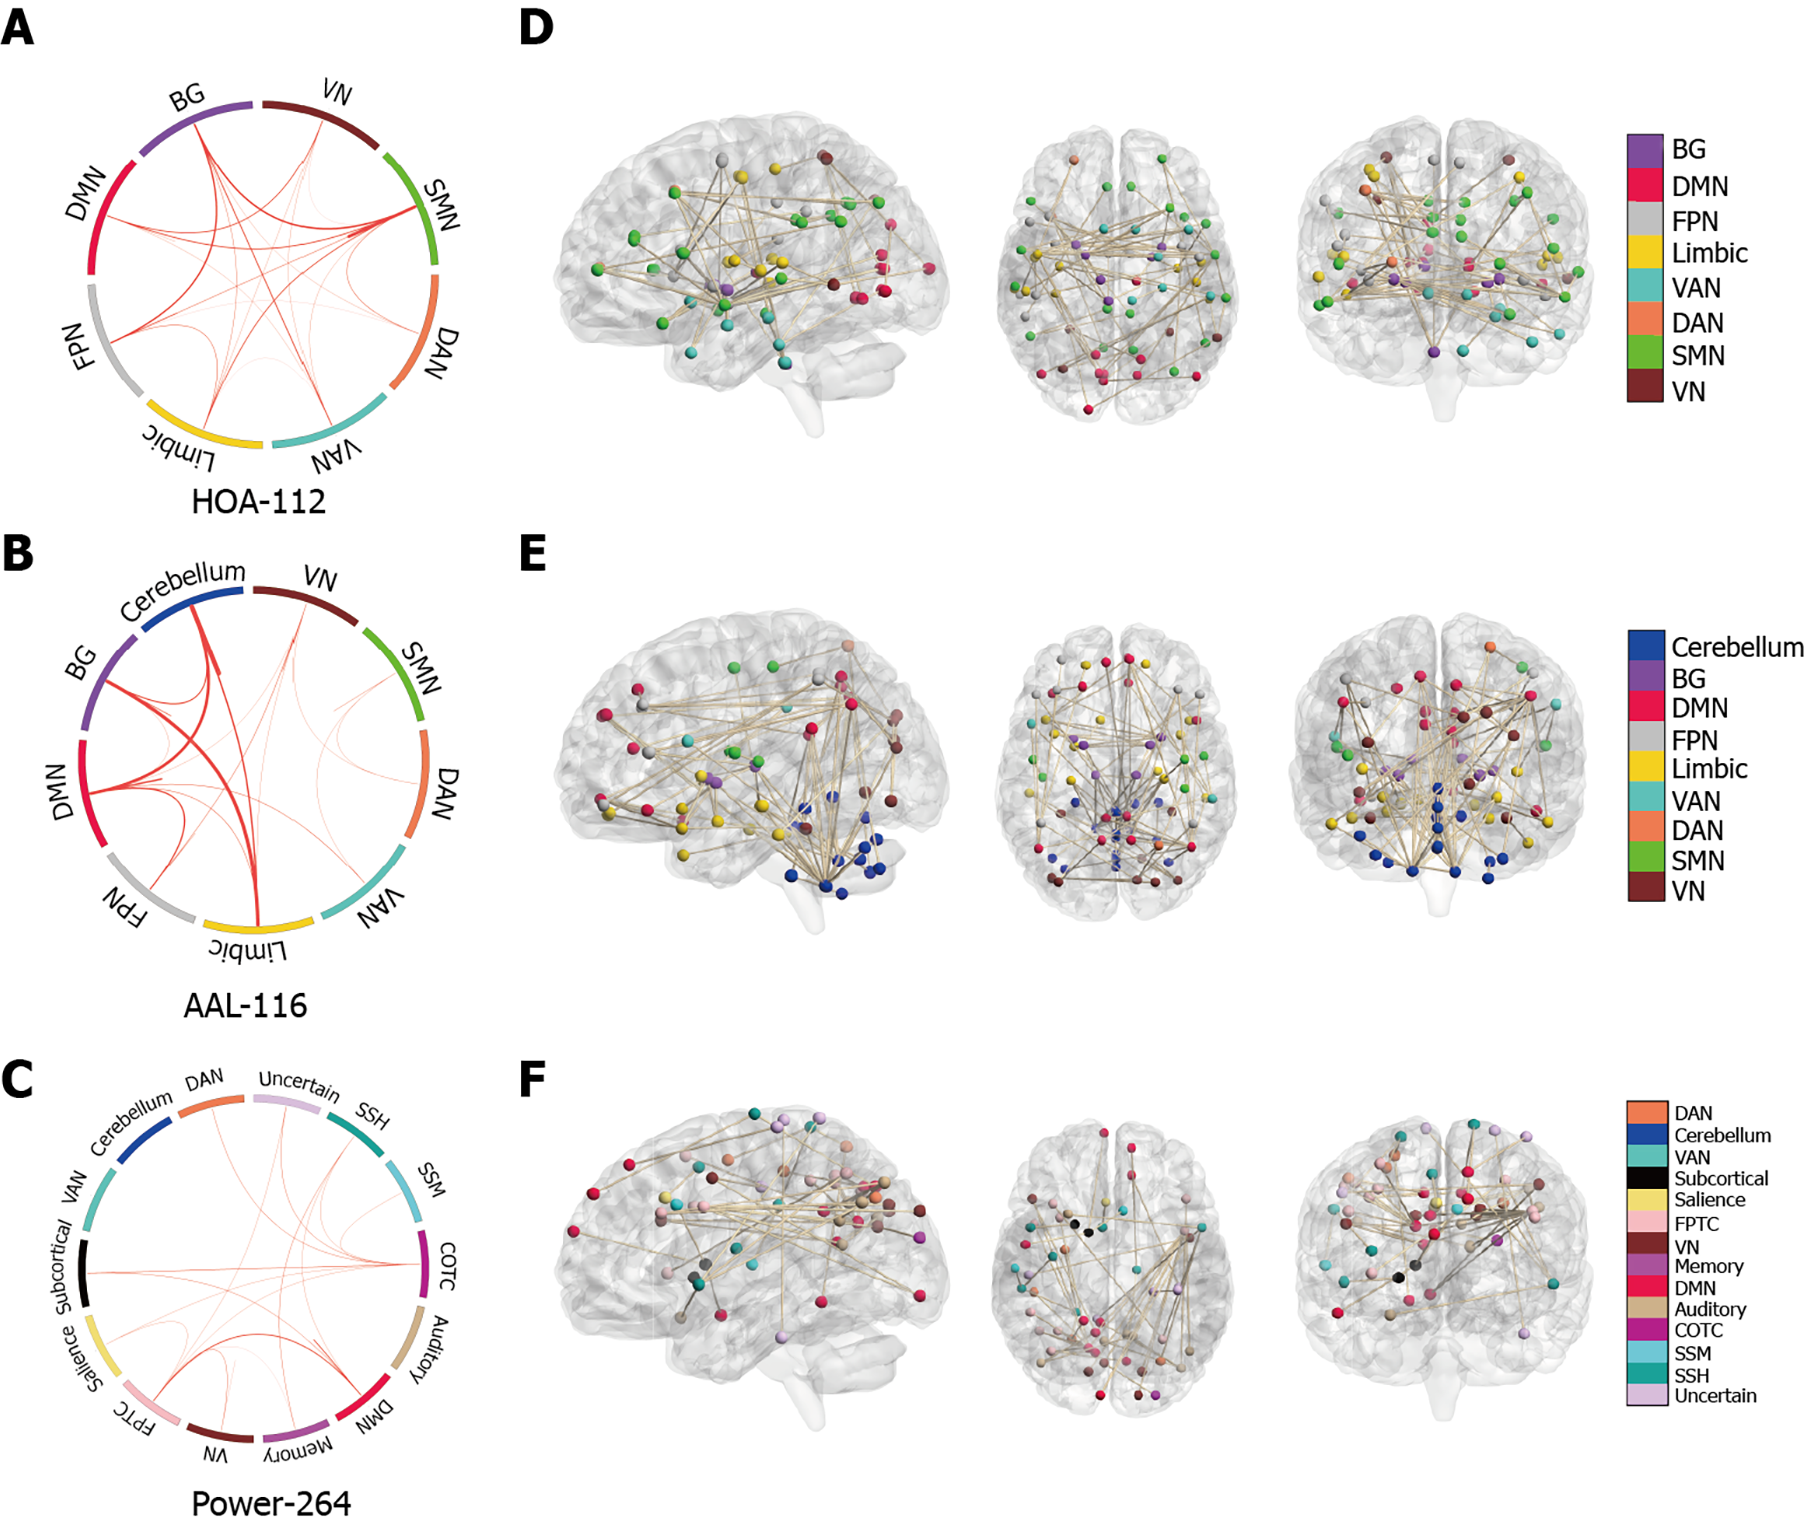
Figure 5 Functional connections classifying patients with type 2 diabetes mellitus with the present of mild cognitive impairment and patients with type 2 diabetes mellitus with the absence of mild cognitive impairment based on three different atlas.
A-C: On the far left of the image above, edges were classified as macroscale brain regions and were visualized using circle plots, in which nodes are grouped based on anatomic location. The resting-state network (RSN) of brain based on three atlas is represented by a rectangle on the circumference of the big circle. The lines connecting two rectangles represent the connections between the corresponding one or two RSN, including inter-network connections and intra-network connections. The thickness of the line represents the weight (i.e., support vector classification weight) of the connection. The thicker the line, the larger the weight. This visualization was created using Circos (http://circos.ca/); D-F: On the right of the image above, the same edges are visualized on brains. The lines represent edges connecting the spheres, which represent nodes. A legend indicating the approximate anatomic ‘lobe’ is shown in the far right side of picture. VN: Visual network; SMN: Sensory-motor network; DAN: Dorsal attention network; VAN: Ventral attention network; Limbic: Limbic system; FPN: Fronto-parietal network; DMN: Default mode network; BG: Basal ganglia; SSH: Sensory Somatomotor hand; SSM: Sensory somatomotor mouth; COTC: Cingulo-opercular task control; Memory: Memory retrieval; FPTC: Fronto-parietal task control.
- Citation: Shi AP, Yu Y, Hu B, Li YT, Wang W, Cui GB. Large-scale functional connectivity predicts cognitive impairment related to type 2 diabetes mellitus. World J Diabetes 2022; 13(2): 110-125
- URL: https://www.wjgnet.com/1948-9358/full/v13/i2/110.htm
- DOI: https://dx.doi.org/10.4239/wjd.v13.i2.110


