Copyright
©The Author(s) 2022.
World J Diabetes. Feb 15, 2022; 13(2): 110-125
Published online Feb 15, 2022. doi: 10.4239/wjd.v13.i2.110
Published online Feb 15, 2022. doi: 10.4239/wjd.v13.i2.110
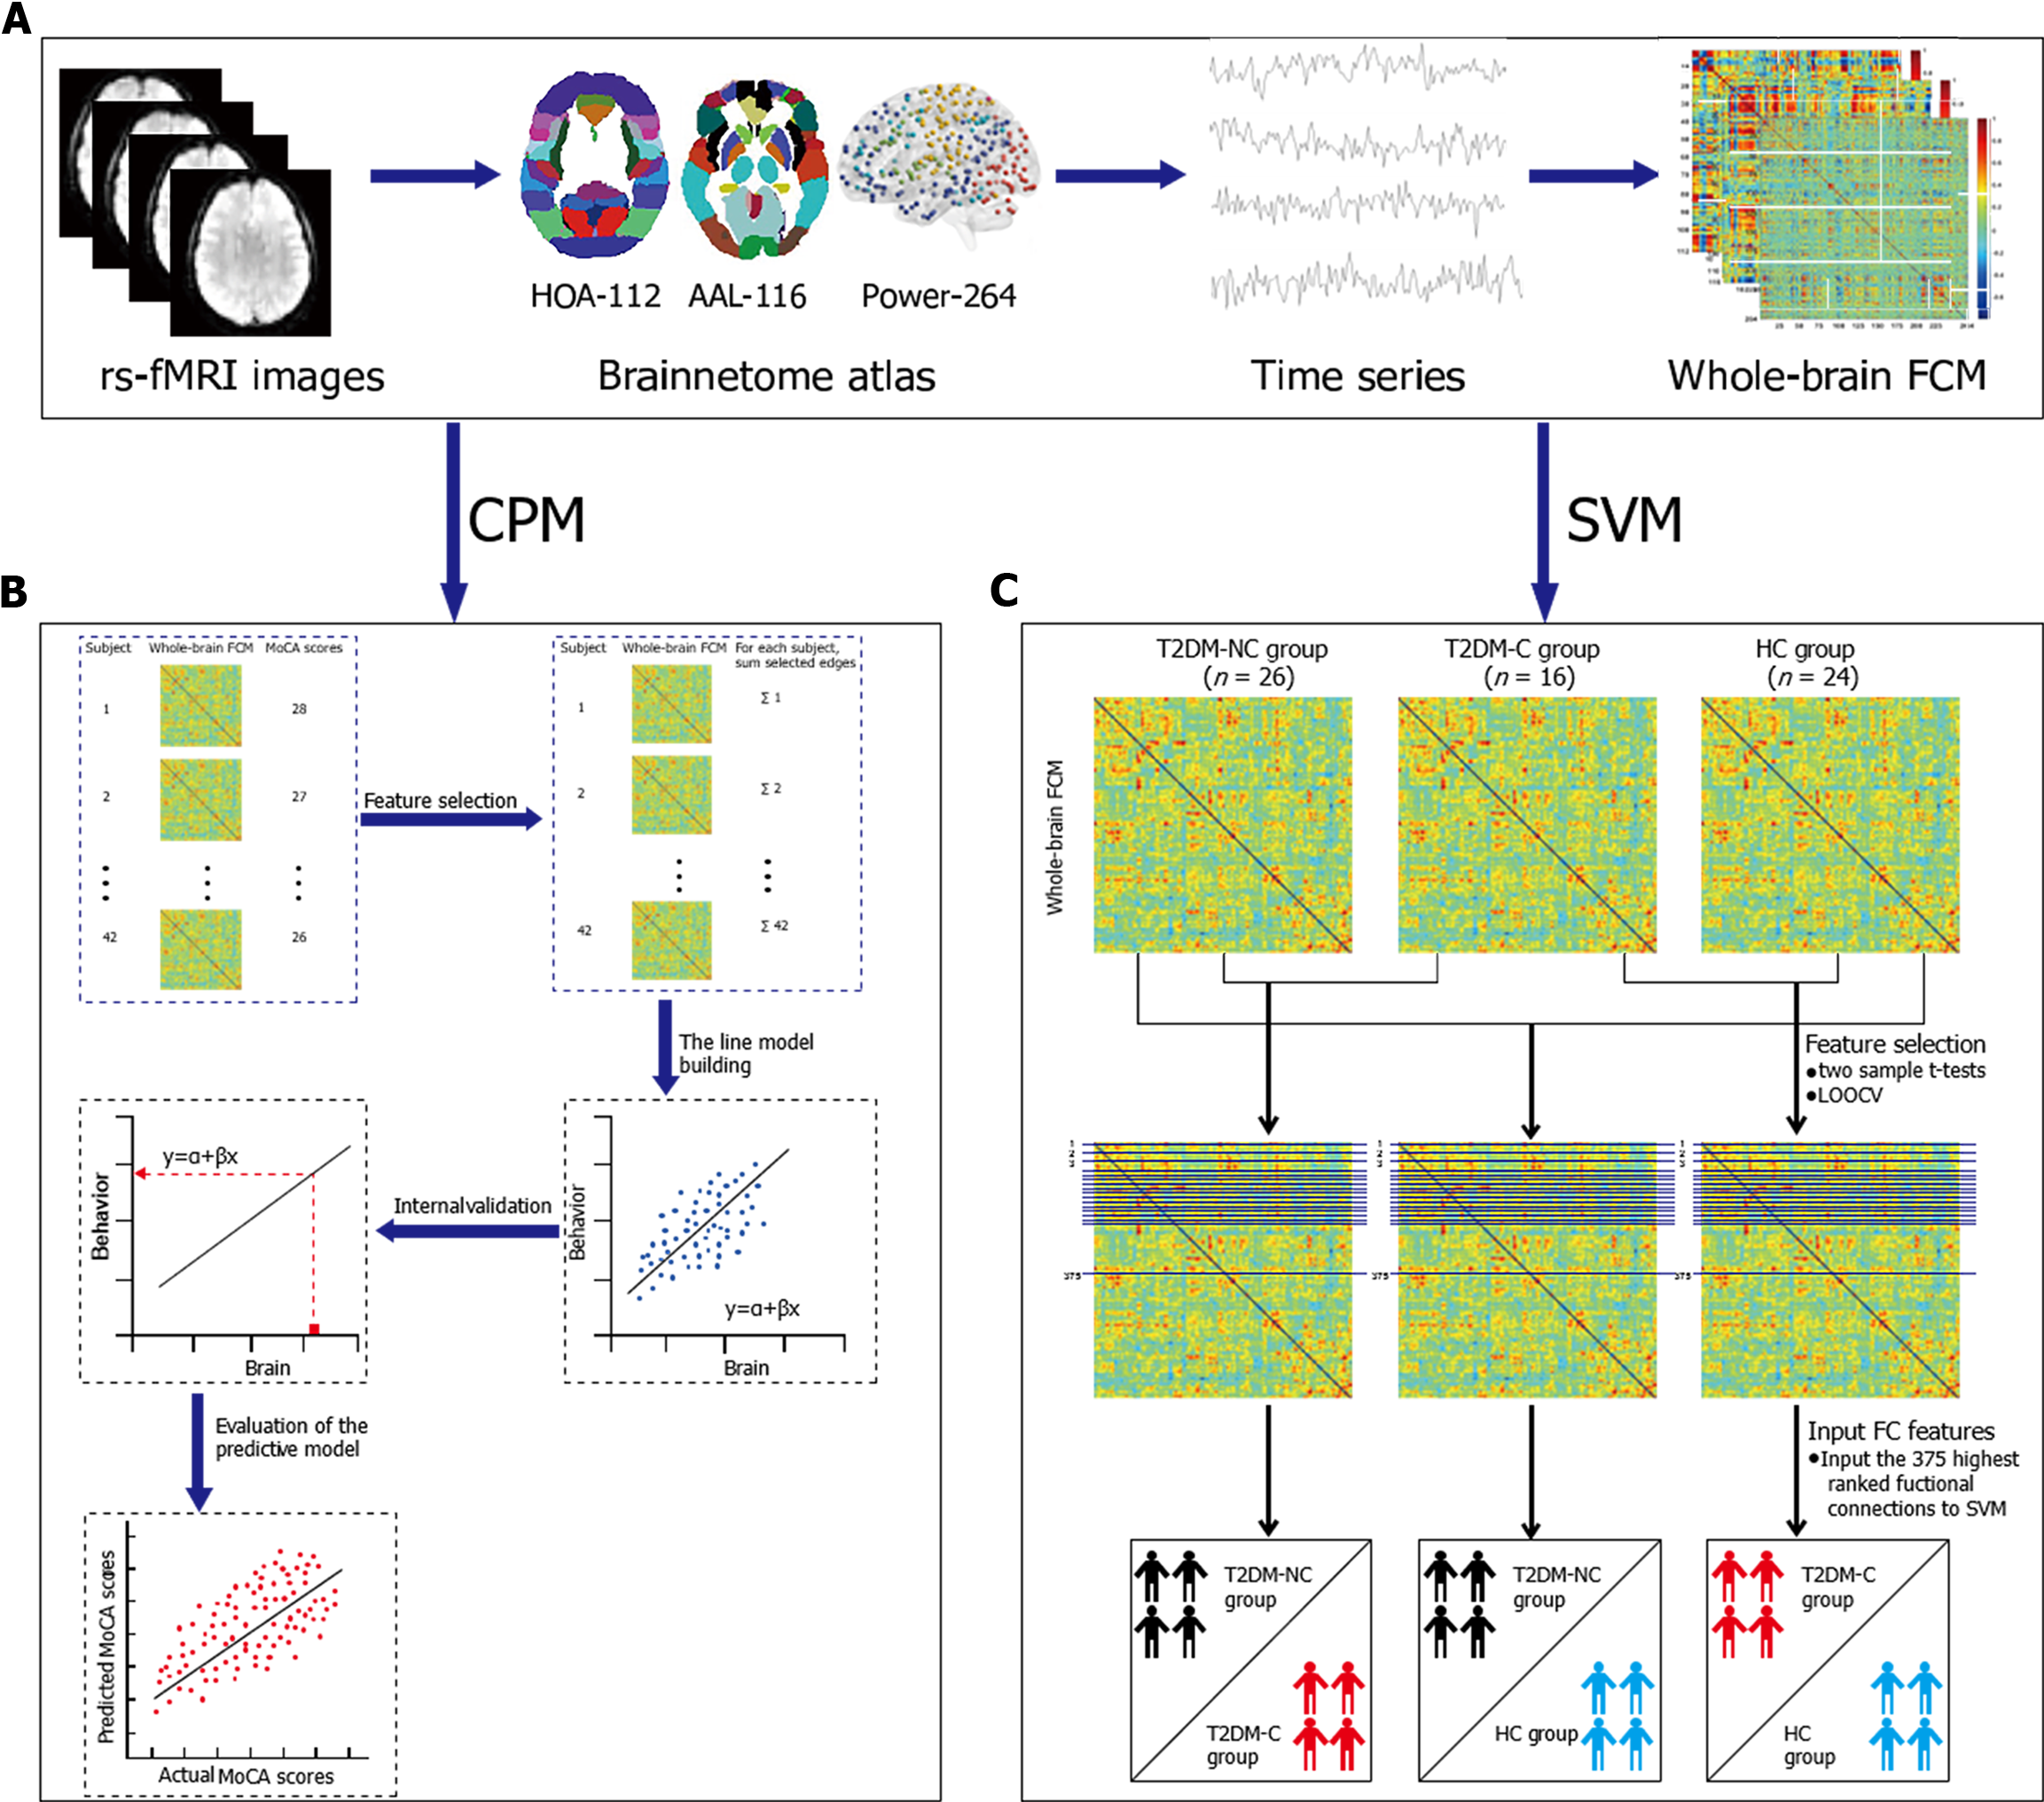
Figure 1 The prediction and classification flowchart.
A: Relevant information from image preprocessing to feature identification; B: Detailed steps of connectome-based predictive modeling; C: Detailed steps of support vector machine. rs-fMRI: Resting state functional magnetic resonance imaging; HOA -112: Harvard Oxford atlas; AAL-116: Automated Anatomical Labeling; Power-264: 264-region functional atlas introduced by Power et al; FCM: Functional connectivity matrix; MoCA: Montreal Cognitive Assessment; T2DM: Type 2 diabetes mellitus; T2DM-C/T2DM-NC: Patients with T2DM with the presence/absence of mild cognitive impairment; HC: Healthy controls; LOOCV: Leave-one-out cross validation; FC: Functional connectivity.
- Citation: Shi AP, Yu Y, Hu B, Li YT, Wang W, Cui GB. Large-scale functional connectivity predicts cognitive impairment related to type 2 diabetes mellitus. World J Diabetes 2022; 13(2): 110-125
- URL: https://www.wjgnet.com/1948-9358/full/v13/i2/110.htm
- DOI: https://dx.doi.org/10.4239/wjd.v13.i2.110


