Copyright
©The Author(s) 2022.
World J Diabetes. Jan 15, 2022; 13(1): 37-53
Published online Jan 15, 2022. doi: 10.4239/wjd.v13.i1.37
Published online Jan 15, 2022. doi: 10.4239/wjd.v13.i1.37
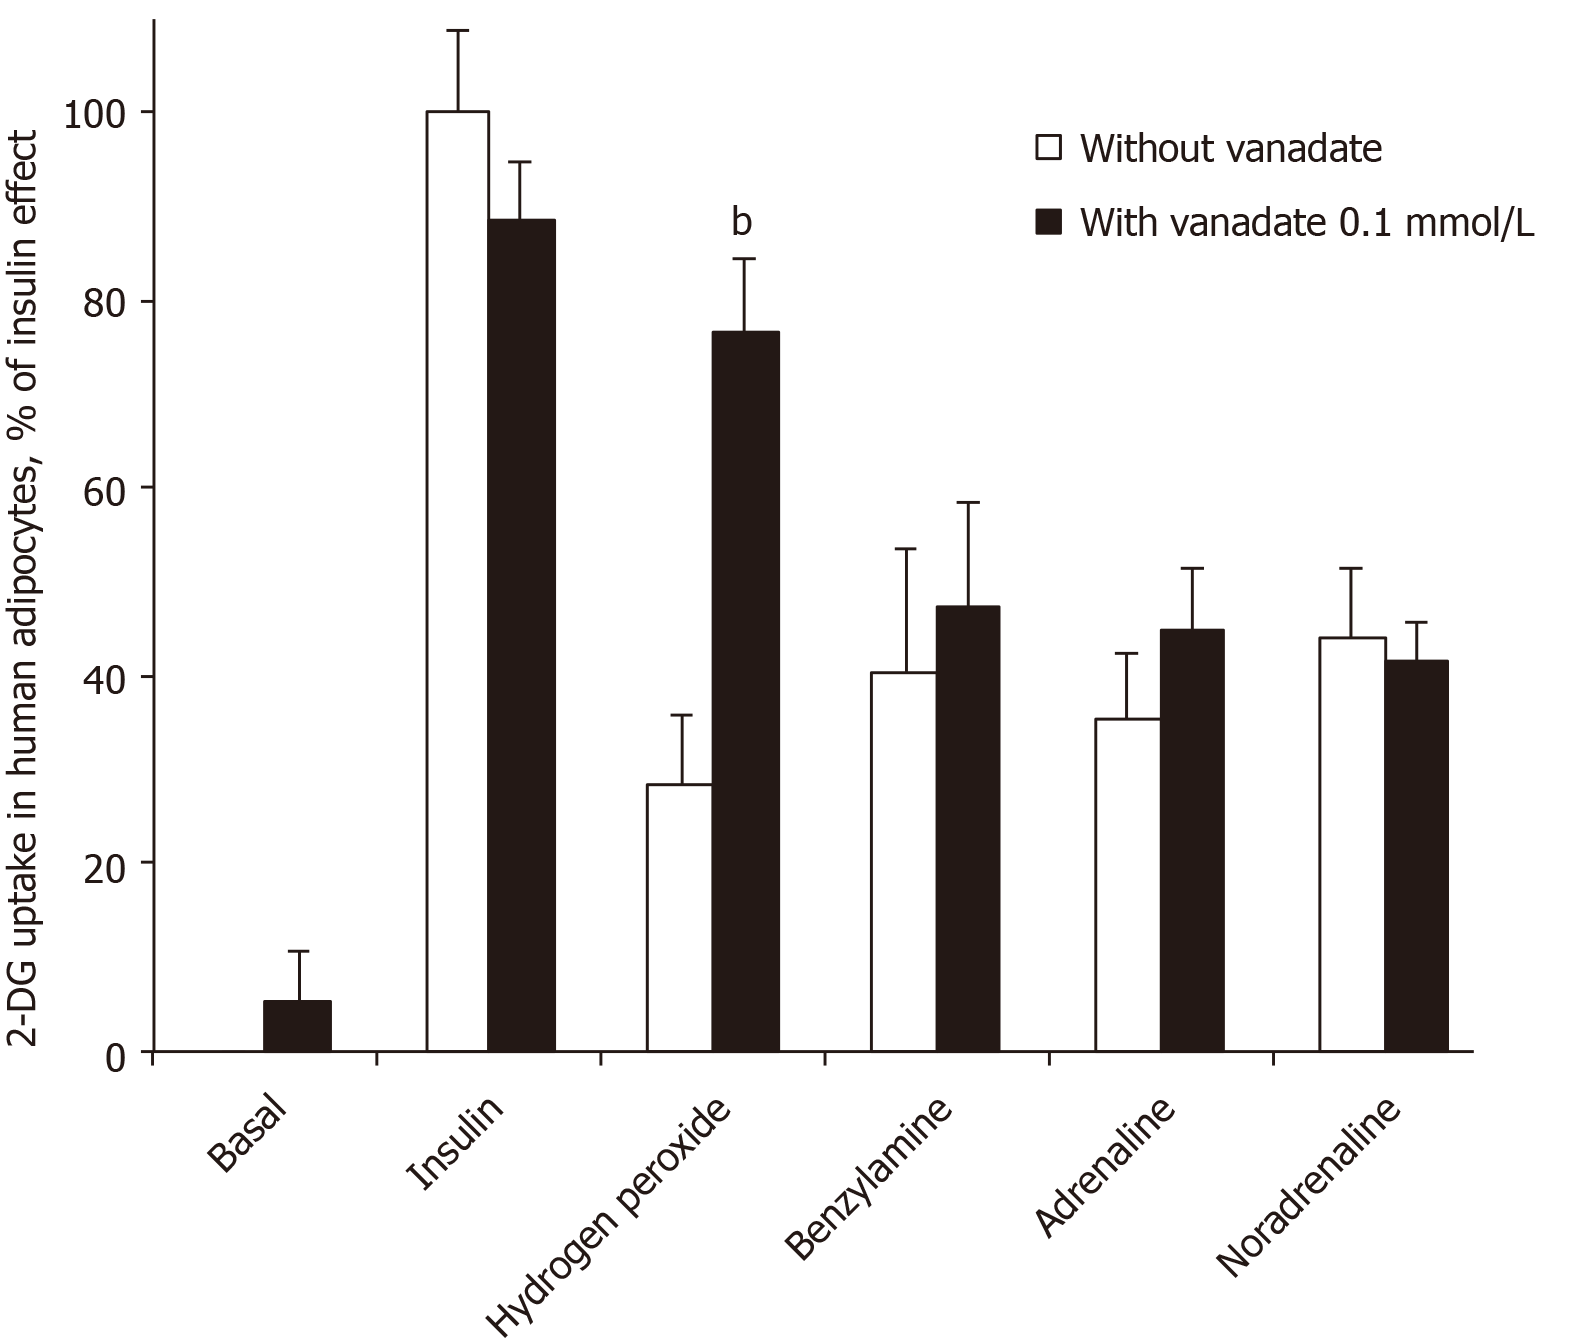
Figure 1 Influence of vanadate on glucose transport in human adipocytes in response to insulin, hydrogen peroxide and naturally occurring amines.
Suspensions of human fat cells were preincubated without (white columns) or with 100 µmol/L sodium orthovanadate (dark columns) for 45 min in the presence of the indicated amines at 100 µmol/L or with 100 nmol/L insulin and hydrogen peroxide at 1 mmol/L. [3H]-2-deoxyglucose uptake assay was then immediately performed for 10 min and expressed as the percentage of maximal stimulation by insulin (set at 100%), with baseline set at 0% (the respective levels of which were: 1.29 ± 0.12 and 0.45 ± 0.04 transported nmol 2-deoxyglucose/100 mg cell lipids/10 min). Each column is the mean ± standard error of the mean from 7 to 10 determinations. In all conditions tested, 2-deoxyglucose uptake was significantly different from basal. A significant influence of vanadium when compared to respective control without vanadate was observed at: bP < 0.01. 2-DG: 2-Deoxyglucose.
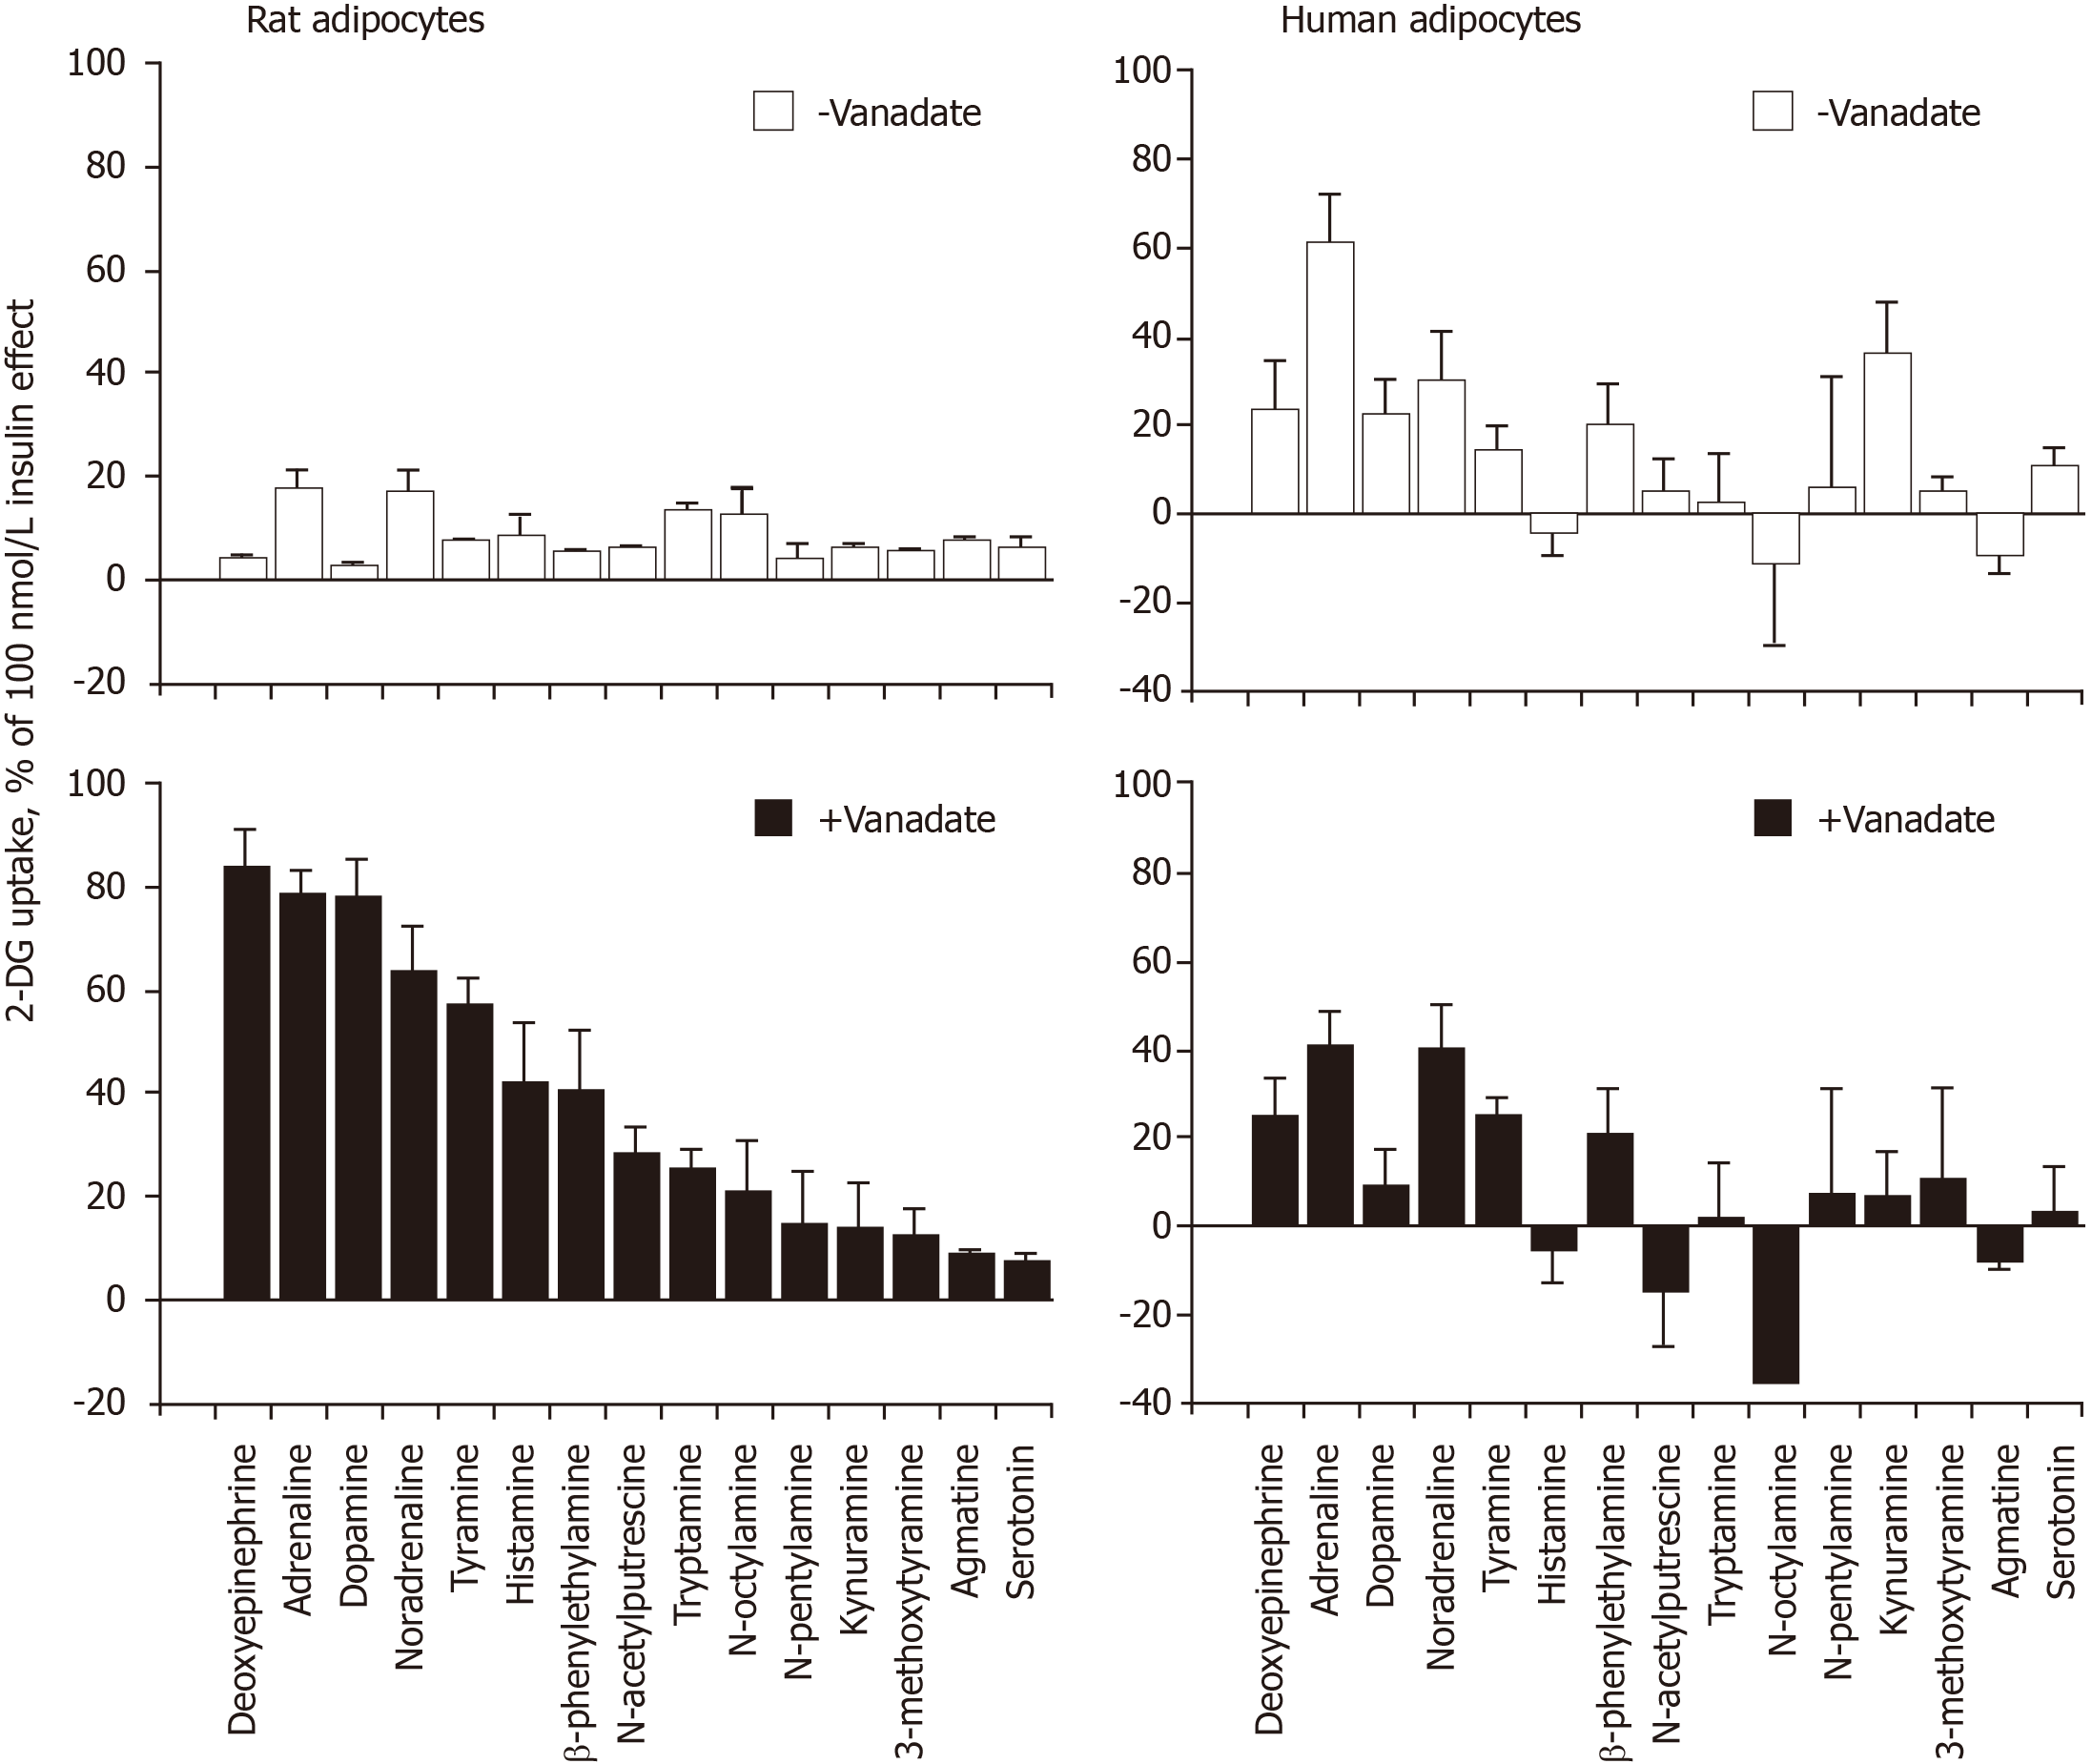
Figure 2 Interspecific differences between rat and human adipocytes in hexose uptake activation by various amines with and without vanadium.
Rat (left) or human (right) fat cells were incubated with 1 mmol/L of the indicated amines in the absence (upper panels, open columns) or the presence of 0.1 mmol/L sodium orthovanadate (lower panels, black columns) just before 2-deoxyglucose uptake assays. Hexose uptake was expressed as the percentage of maximal stimulation induced by 100 nmol/L insulin (set at 100%, with basal uptake set at 0). Negative percentages traduced a transport that was lower than baseline. Each column is the mean ± standard error of the mean of 4 to 11 experiments in rat adipocytes and of 3 to 12 preparations of human adipocytes and is presented according to the decreasing rank order of amine-induced stimulation obtained in rat adipocytes when tested at 1 mmol/L + 0.1 mmol/L vanadate, according to our previously published data[1], redrawn here in the left panel with the author’s permission. 2-DG: 2-Deoxyglucose.
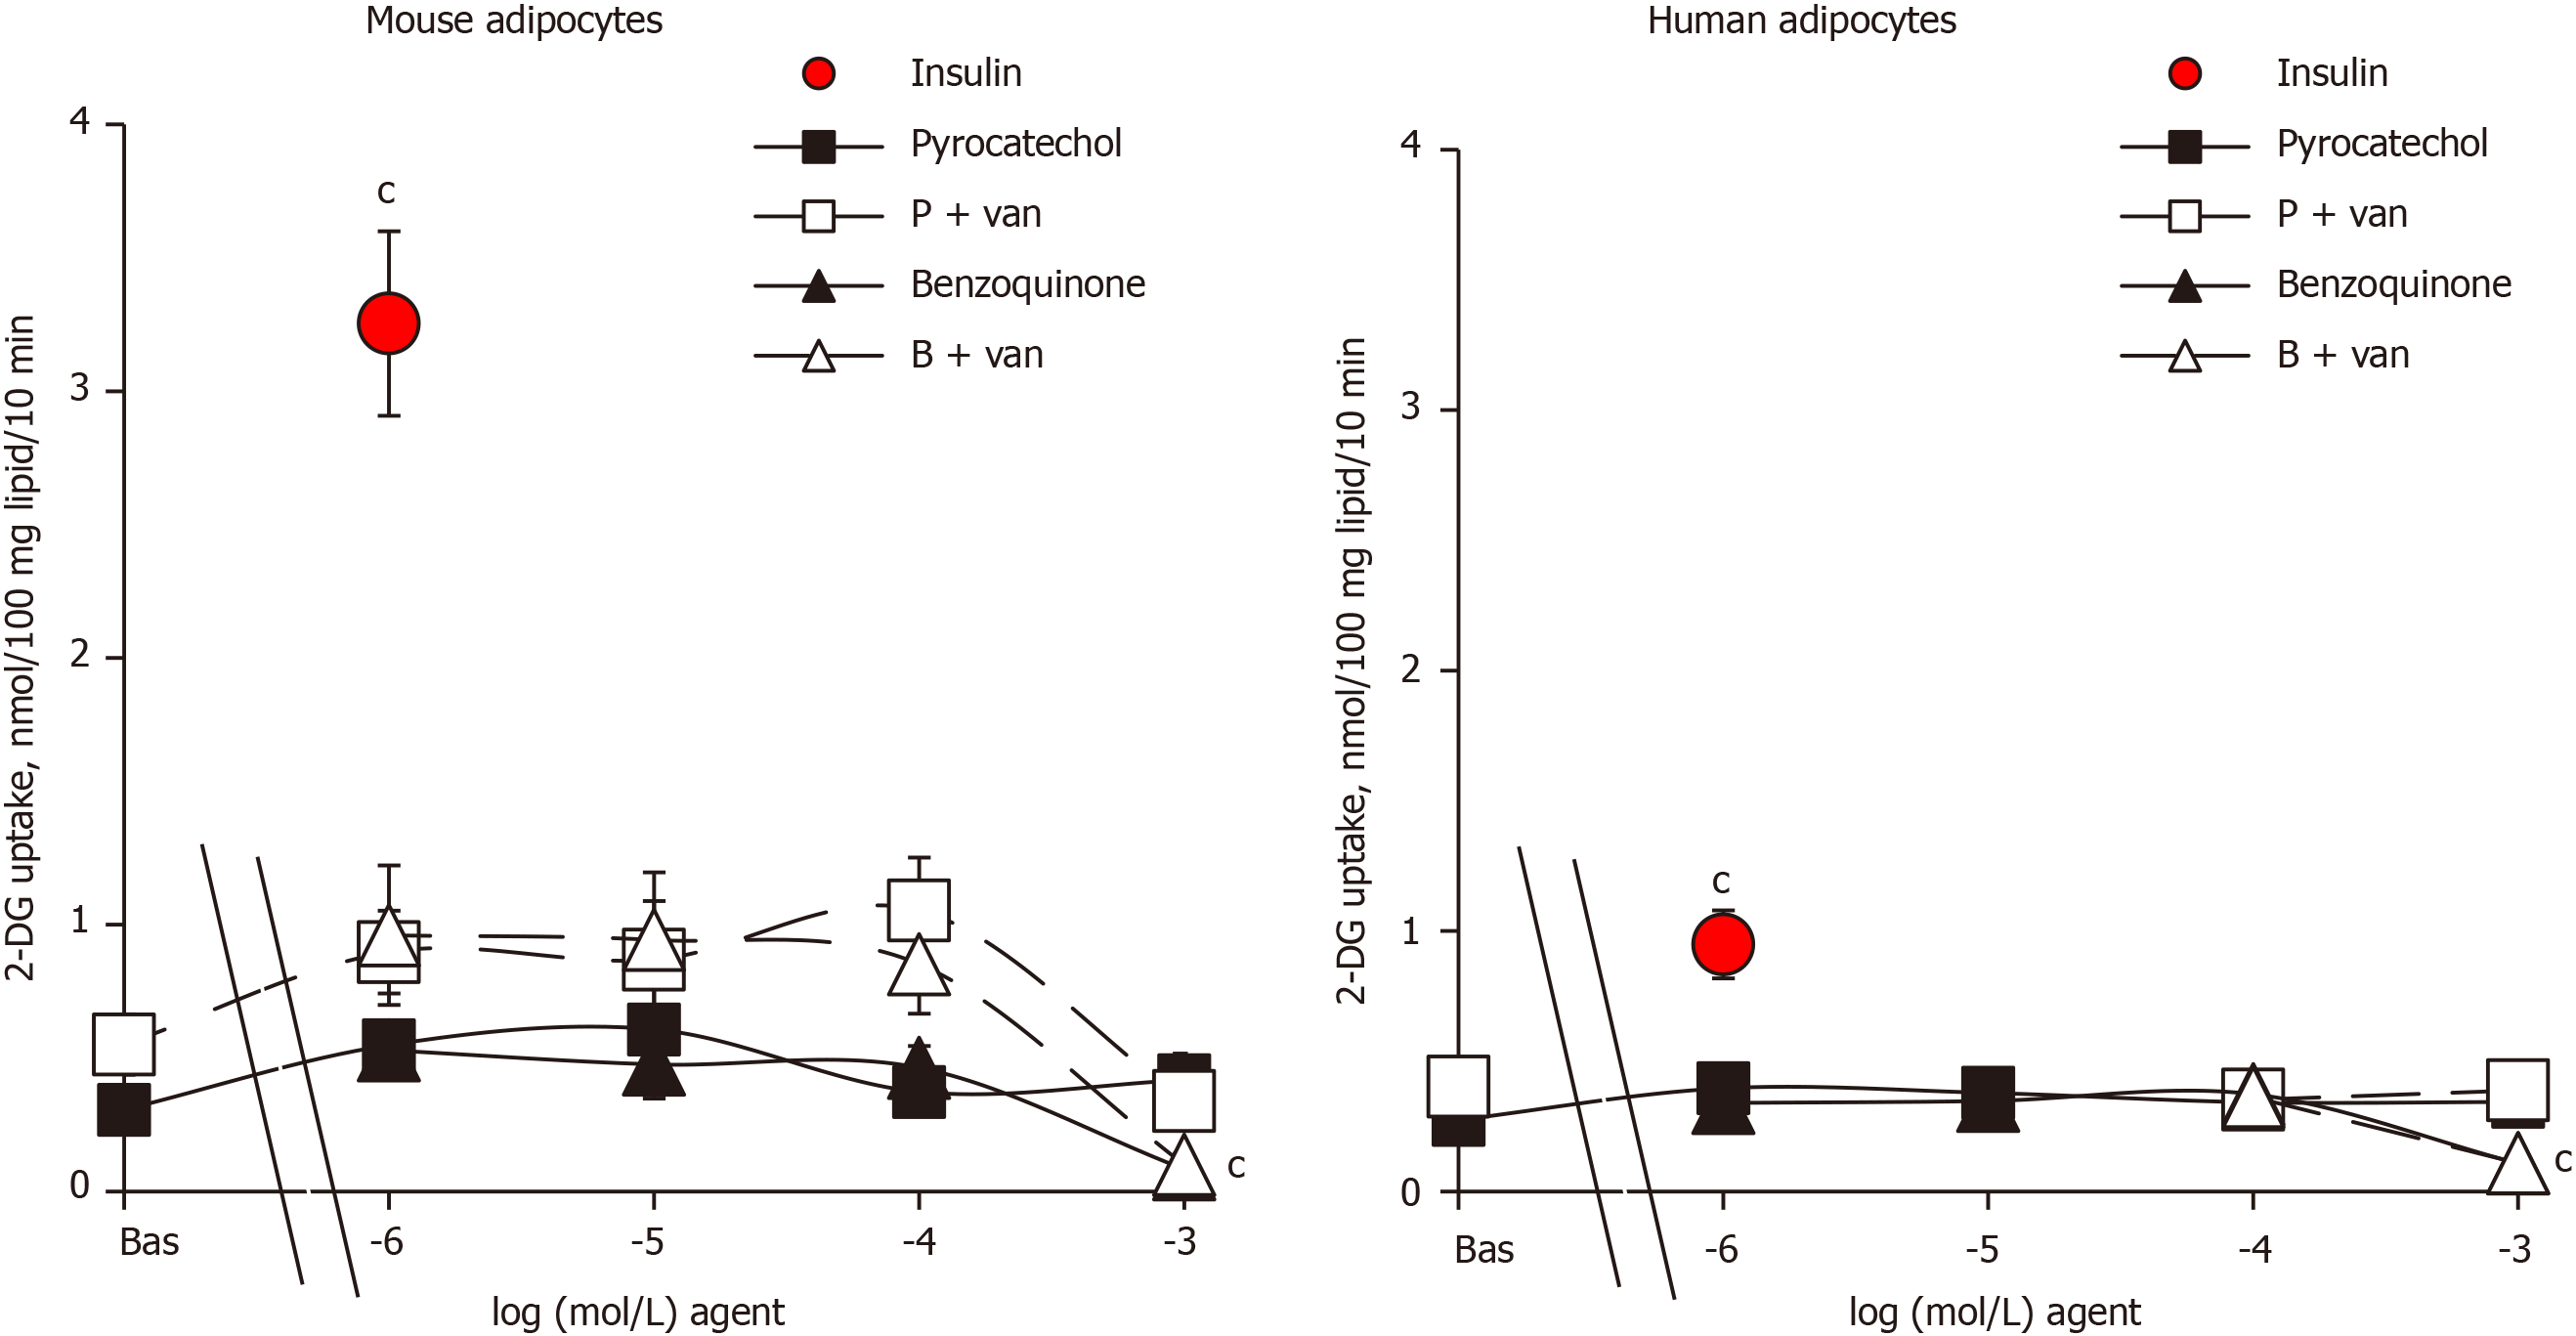
Figure 3 Lack of stimulatory influence of pyrocatechol and benzoquinone on hexose uptake in mouse and human adipocytes.
Mouse (left panel) and human (right panel) fat cells were incubated for 45 min with increasing concentrations (from 1 µmol/L to 1 mmol/L, indicated as log of molar concentration) of pyrocatechol (squares) or benzoquinone (triangles) without (closed symbols) or with 100 µmol/L vanadate (open symbols) just before assaying [3H]-2-deoxyglucose uptake for a 10-min period. Basal (without any agent added) and maximal hexose uptake in response to 1 µmol/L insulin (red circle, bovine hormone for mouse adipocytes and human recombinant protein for human adipocytes) are given with the same Y-axis scale for the sake of comparison. Mean ± standard error of the mean of 9 and 7 separate experiments for mouse and human adipocyte preparations containing 15 ± 2 and 20 ± 3 mg lipid/400 µL assay tube, respectively. Difference from basal uptake was significant at: cP < 0.001. 2-DG: 2-Deoxyglucose; B: Benzoquinone; van: Vanadate; P: Pyrocatechol; Bas: Basal.
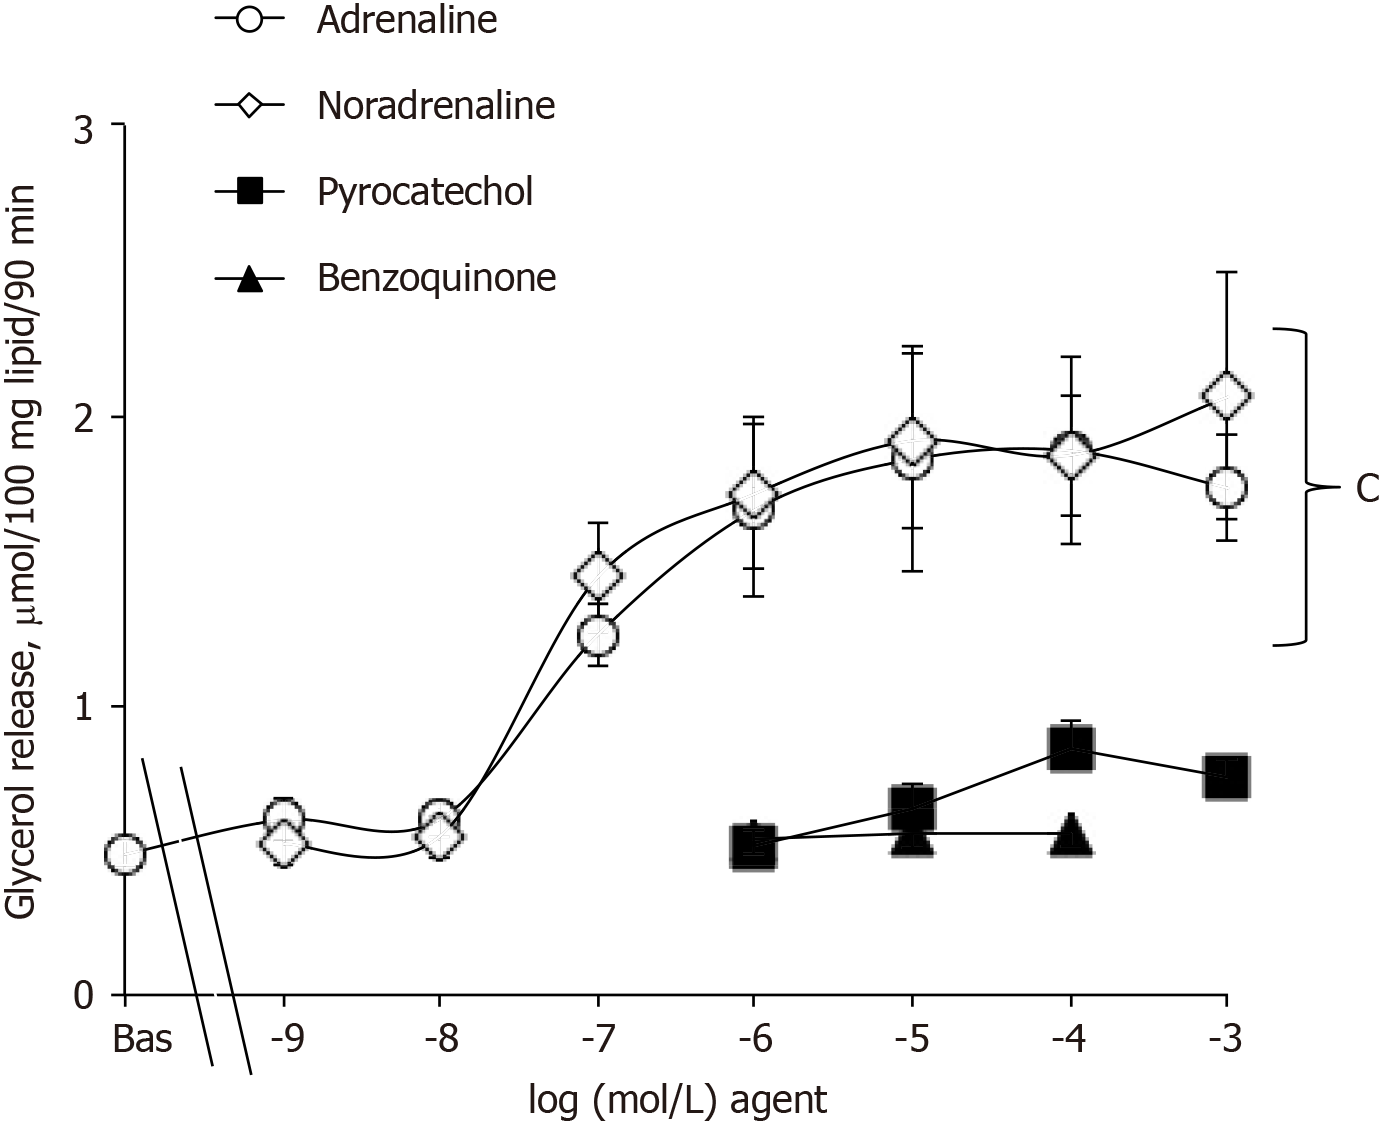
Figure 4 Dose-dependent activation of lipolysis by adrenaline and noradrenaline but not pyrocatechol and benzoquinone in mouse adipocytes.
Glycerol release was assessed after 90 min incubation of mouse adipocytes without (basal) or with increasing concentrations of adrenaline (open circles), noradrenaline (open diamonds), pyrocatechol (black squares) or benzoquinone (dark triangles). Each condition is the mean ± standard error of the mean of 5-6 adipocyte preparations. The doses of adrenaline and noradrenaline ranging between 1 µmol/L and 1 mmol/L induced a response different from basal at: cP < 0.001. Bas: Basal.
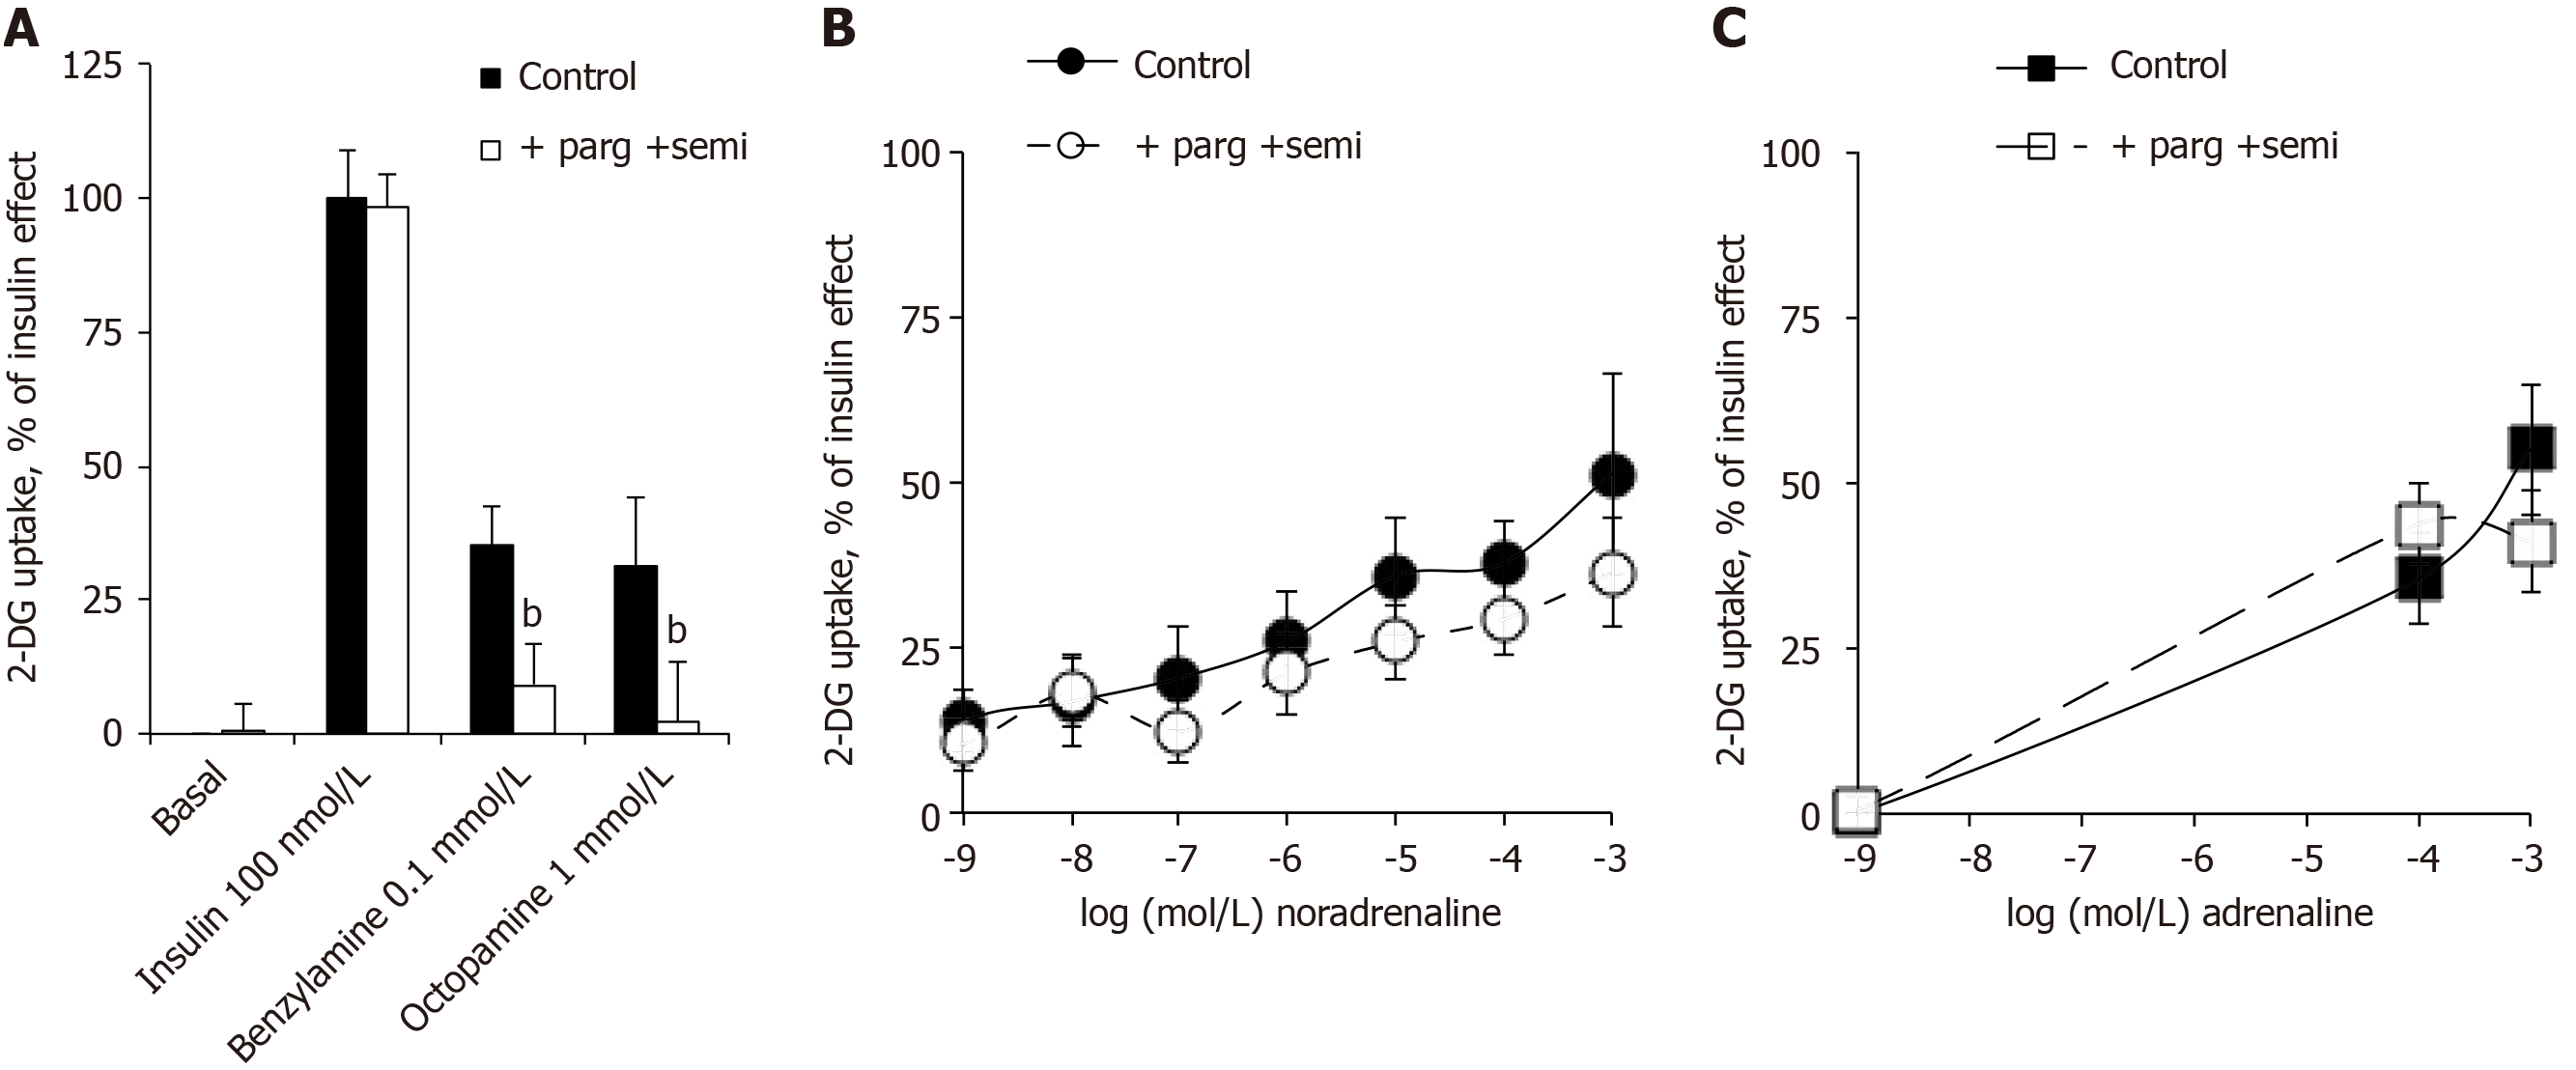
Figure 5 Inhibition by pargyline and semicarbazide of benzylamine and octopamine effects on hexose uptake in human adipocytes but not of noradrenaline and adrenaline effects.
Human fat cells were incubated in the presence of the indicated agents without (control, black symbols) and with the combination of 100 µmol/L pargyline plus 1 mmol/L semicarbazide (open symbols) before being subjected to 2-deoxyglucose uptake assay. A: Insulin, benzylamine and octopamine: mean ± standard error of the mean of 7 adipocyte preparations. A significant inhibition when compared to respective control was observed at: bP < 0.01. B: Increasing doses of noradrenaline: mean ± standard error of the mean of 13 cases. C: Indicated doses of adrenaline: mean ± standard error of the mean of 17 cases. No significant difference was found between inhibitor and respective control conditions. 2-DG: 2-Deoxyglucose; parg: Pargyline; semi: Semicarbazide.
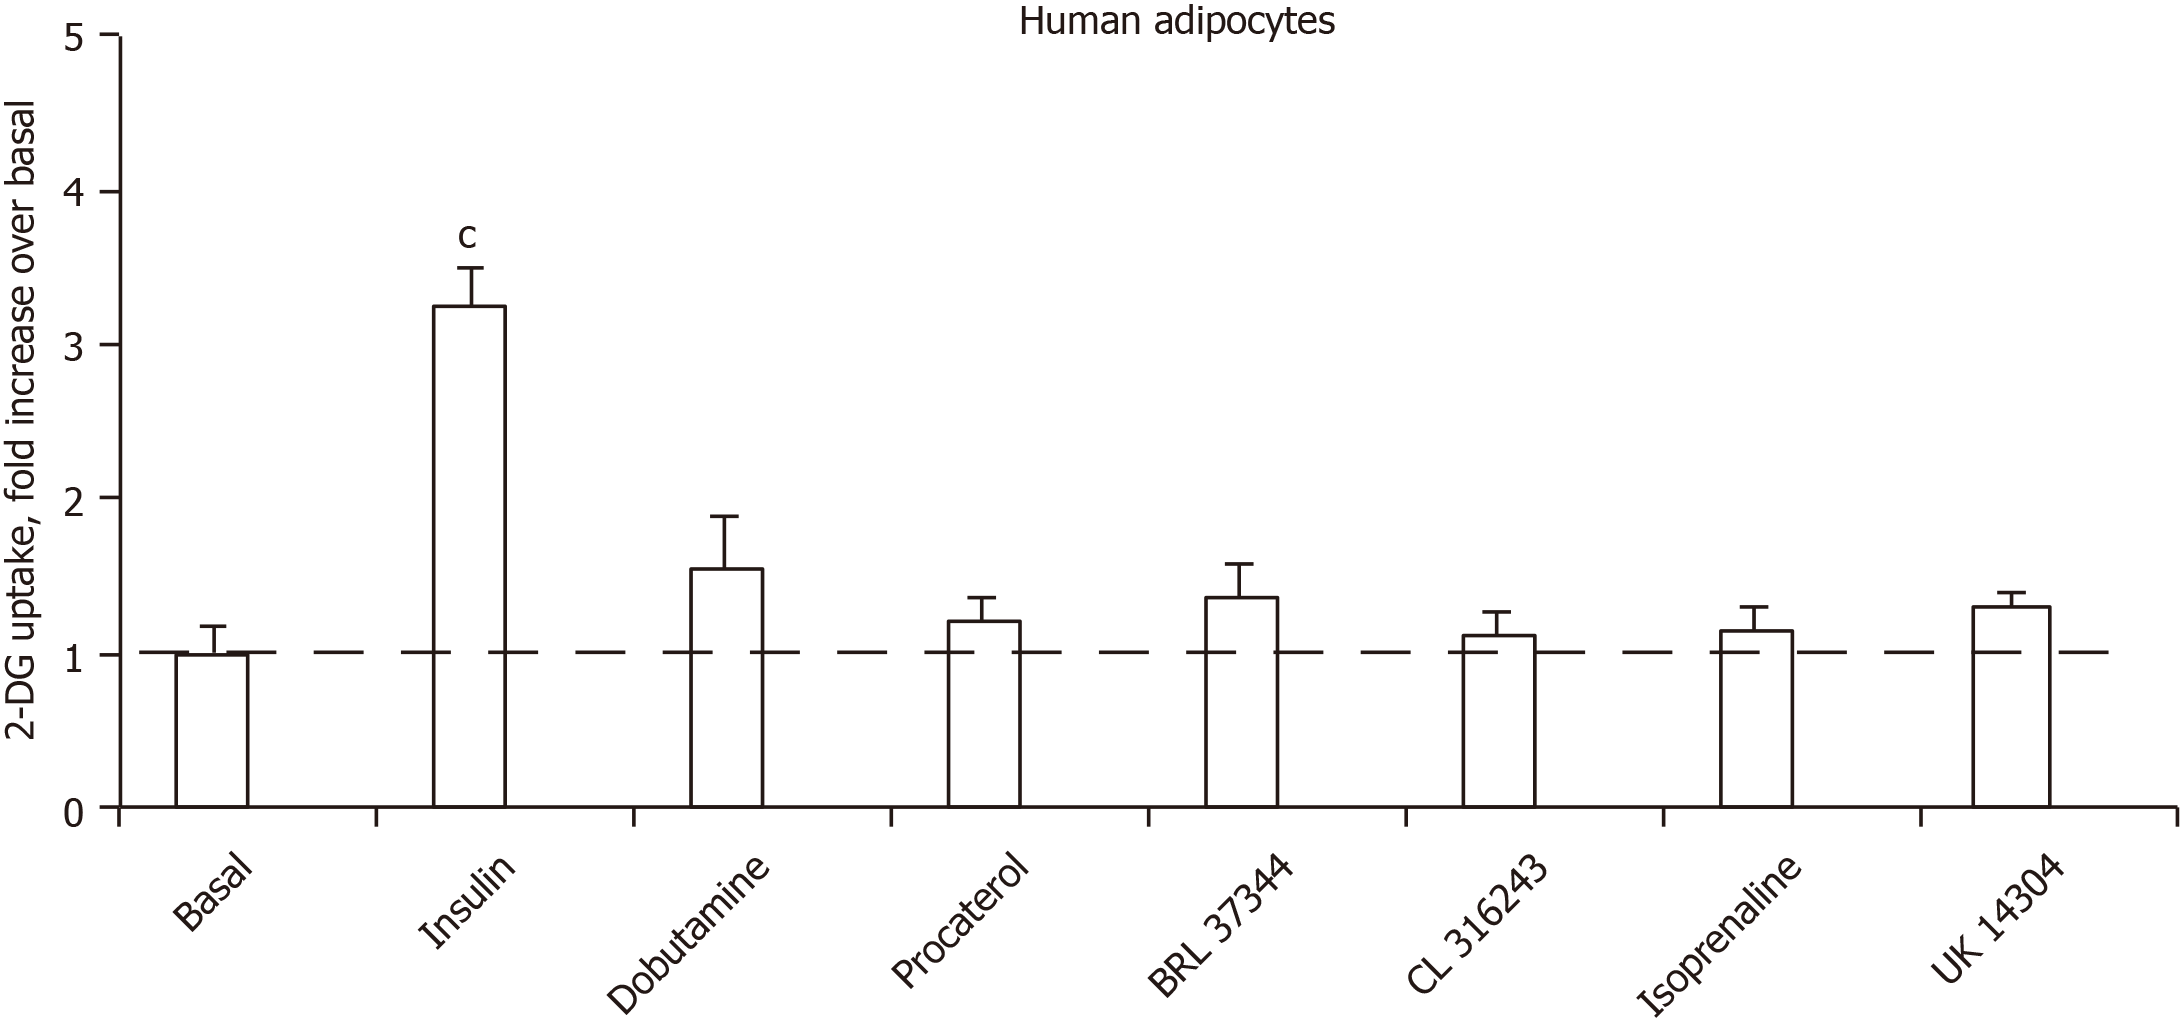
Figure 6 Influence of insulin, β- and α-adrenergic receptor agonists on hexose transport in human adipocytes.
2-Deoxyglucose uptake assay was performed without (basal) and with 100 nmol/L insulin or 1 µmol/L of the indicated adrenergic receptor agonists. Dobutamine: β1-AR agonist; procaterol: β2-AR agonist; BRL 37344 and CL 316243: β3-AR agonists; isoprenaline: pan-agonist of the three subtypes of β-ARs; UK 14304: α2-AR agonist. Glucose transport was expressed as fold increase relative to basal uptake set at 1.0 (dotted line). Each column is the mean ± standard error of the mean of 9-12 individual adipocyte preparations. Only insulin-induced uptake was significantly different from baseline at: cP < 0.001. 2-DG: 2-Deoxyglucose.
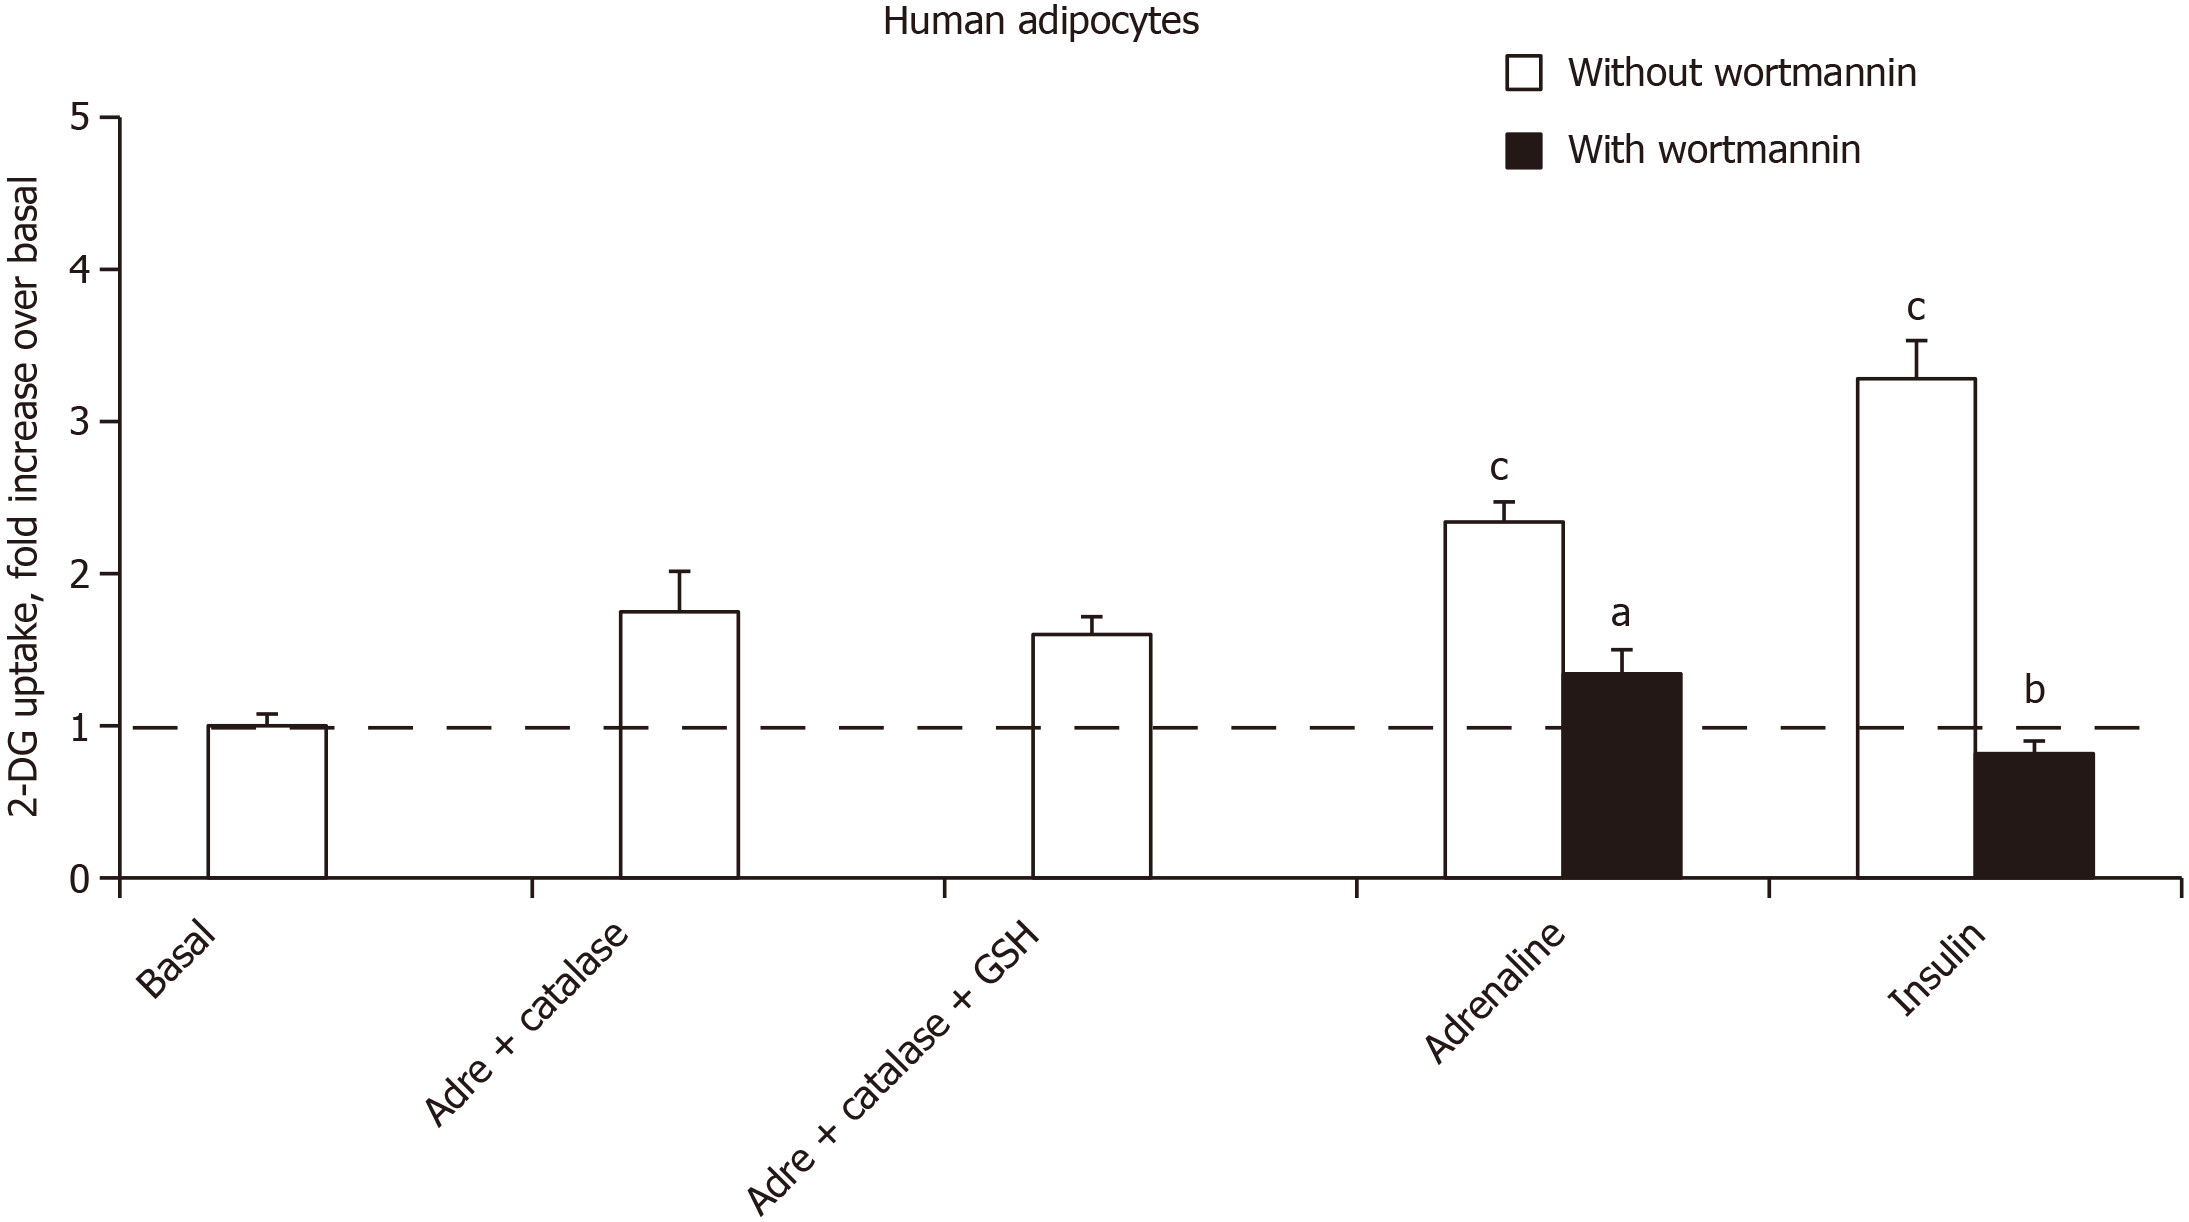
Figure 7 Inhibition of adrenaline-induced hexose uptake in human adipocytes by catalase, glutathione and wortmannin.
The pretreatment of adipocytes by catalase alone (5000 IU/mL) or in combination with 1 mmol/L glutathione was started 10 min before the addition of 1 mmol/L adrenaline, which was incubated for 45 min before performing 2-deoxyglucose uptake assay for 10 min. The mean ± standard error of the mean of 4 to 6 separate experiments is given as fold increase above basal 2-deoxyglucose uptake. A significant difference from basal was observed at: cP < 0.001; Different from 1 mmol/L adrenaline alone at: aP < 0.05, or from 100 nmol/L insulin alone at: bP < 0.001. 2-DG: 2-Deoxyglucose; adre: Adrenaline.
- Citation: Carpéné C, Boulet N, Grolleau JL, Morin N. High doses of catecholamines activate glucose transport in human adipocytes independently from adrenoceptor stimulation or vanadium addition. World J Diabetes 2022; 13(1): 37-53
- URL: https://www.wjgnet.com/1948-9358/full/v13/i1/37.htm
- DOI: https://dx.doi.org/10.4239/wjd.v13.i1.37


