Copyright
©The Author(s) 2021.
World J Diabetes. Jun 15, 2021; 12(6): 685-705
Published online Jun 15, 2021. doi: 10.4239/wjd.v12.i6.685
Published online Jun 15, 2021. doi: 10.4239/wjd.v12.i6.685
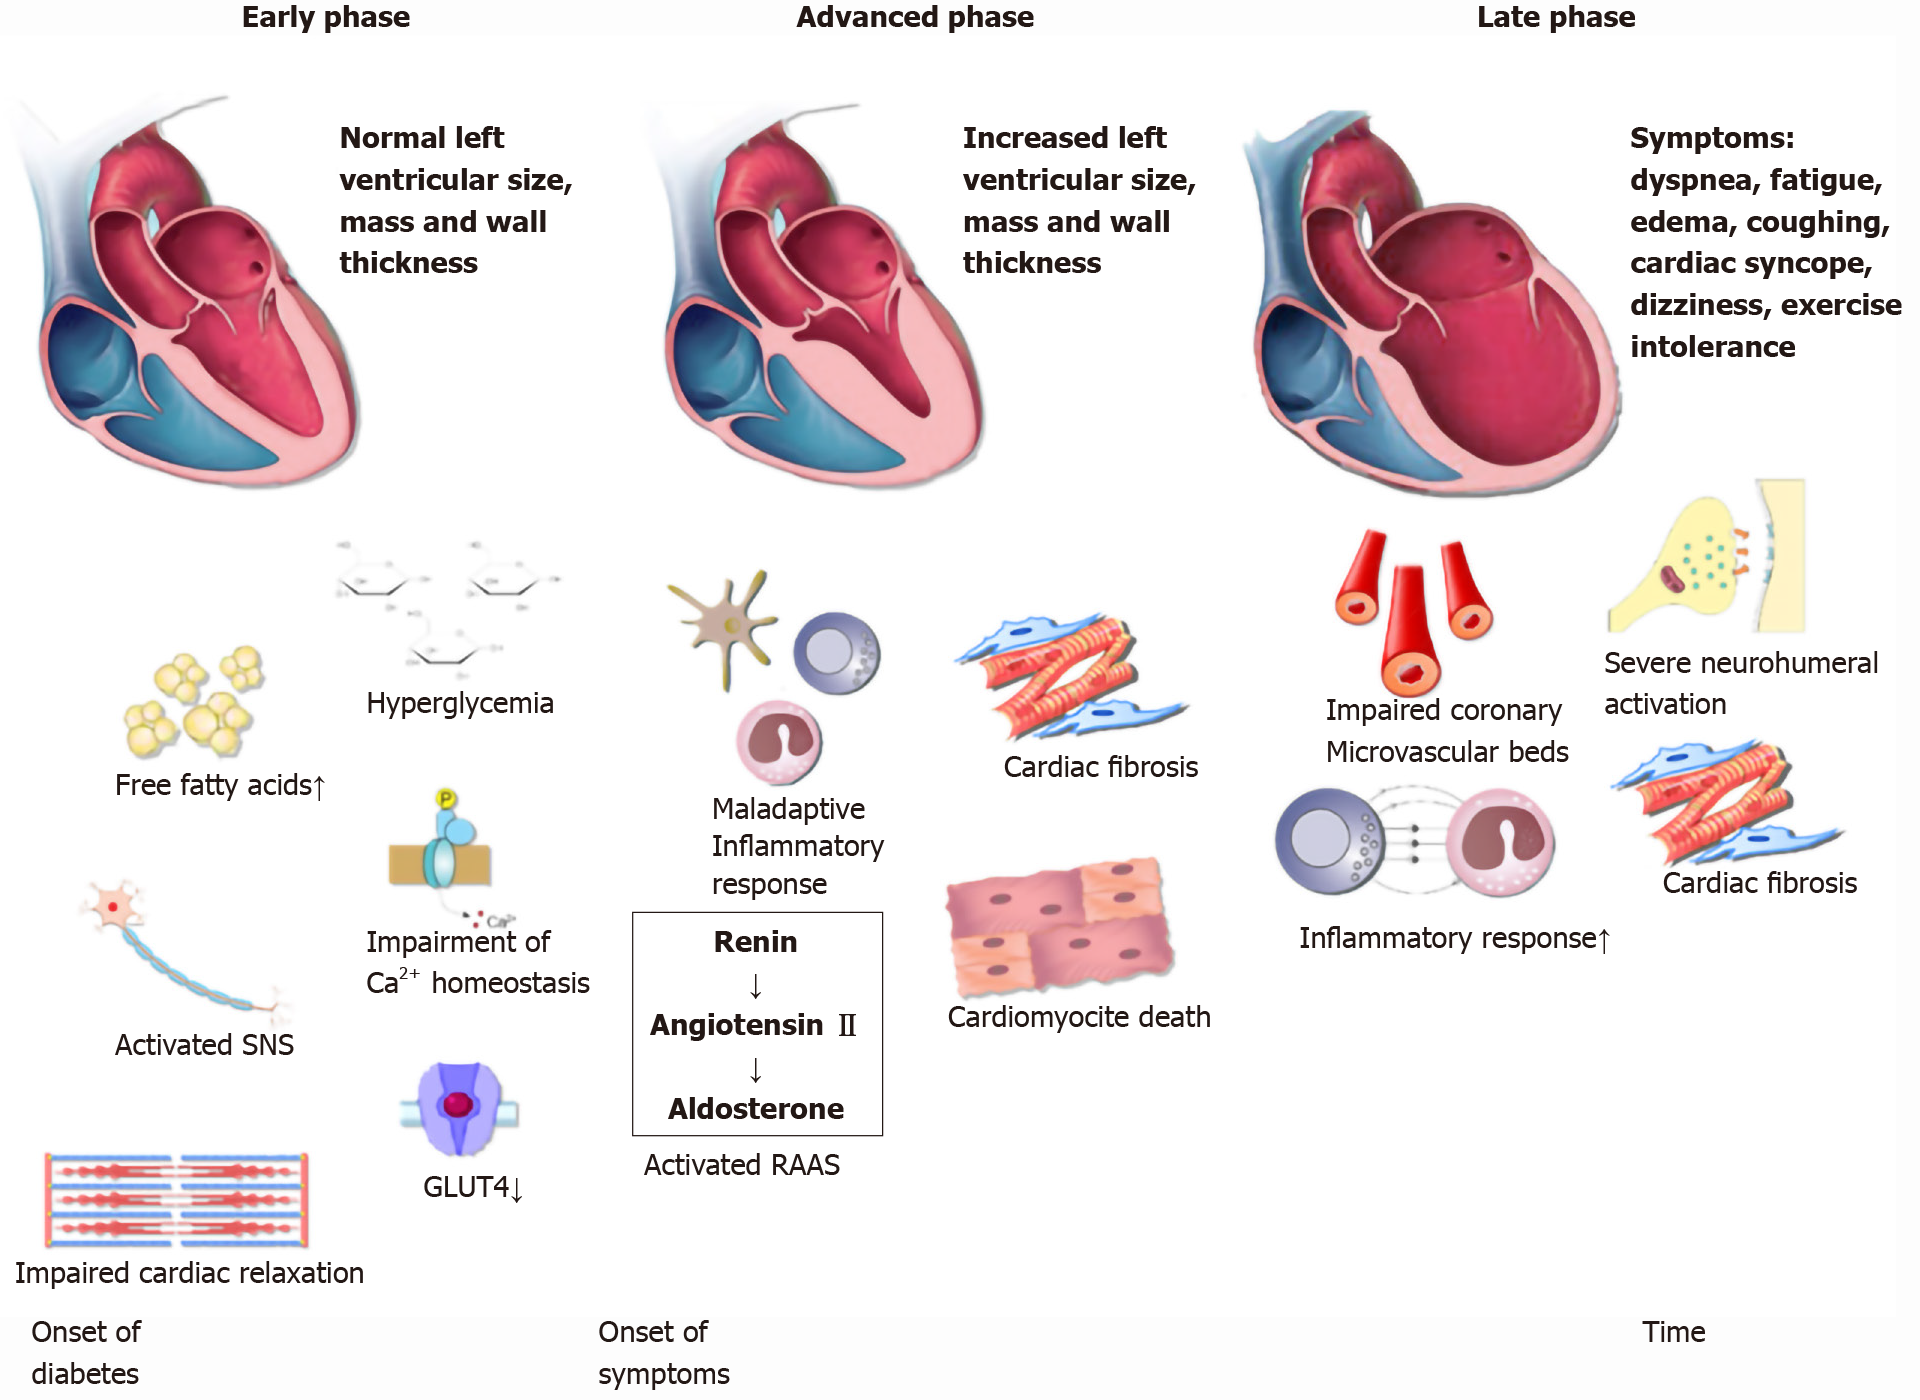
Figure 1 Schematic representation of the diabetic cardiomyopathy phases.
Each background color corresponds to its respective phase: green (early phase), yellow (advanced phase), red (late phase). The red line represents the incremental nature of symptom severity. SNS: Sympathetic nervous system; GLUT4: Glucose transporter type 4; RAAS: Renin-Angiotensin-Aldosterone System.
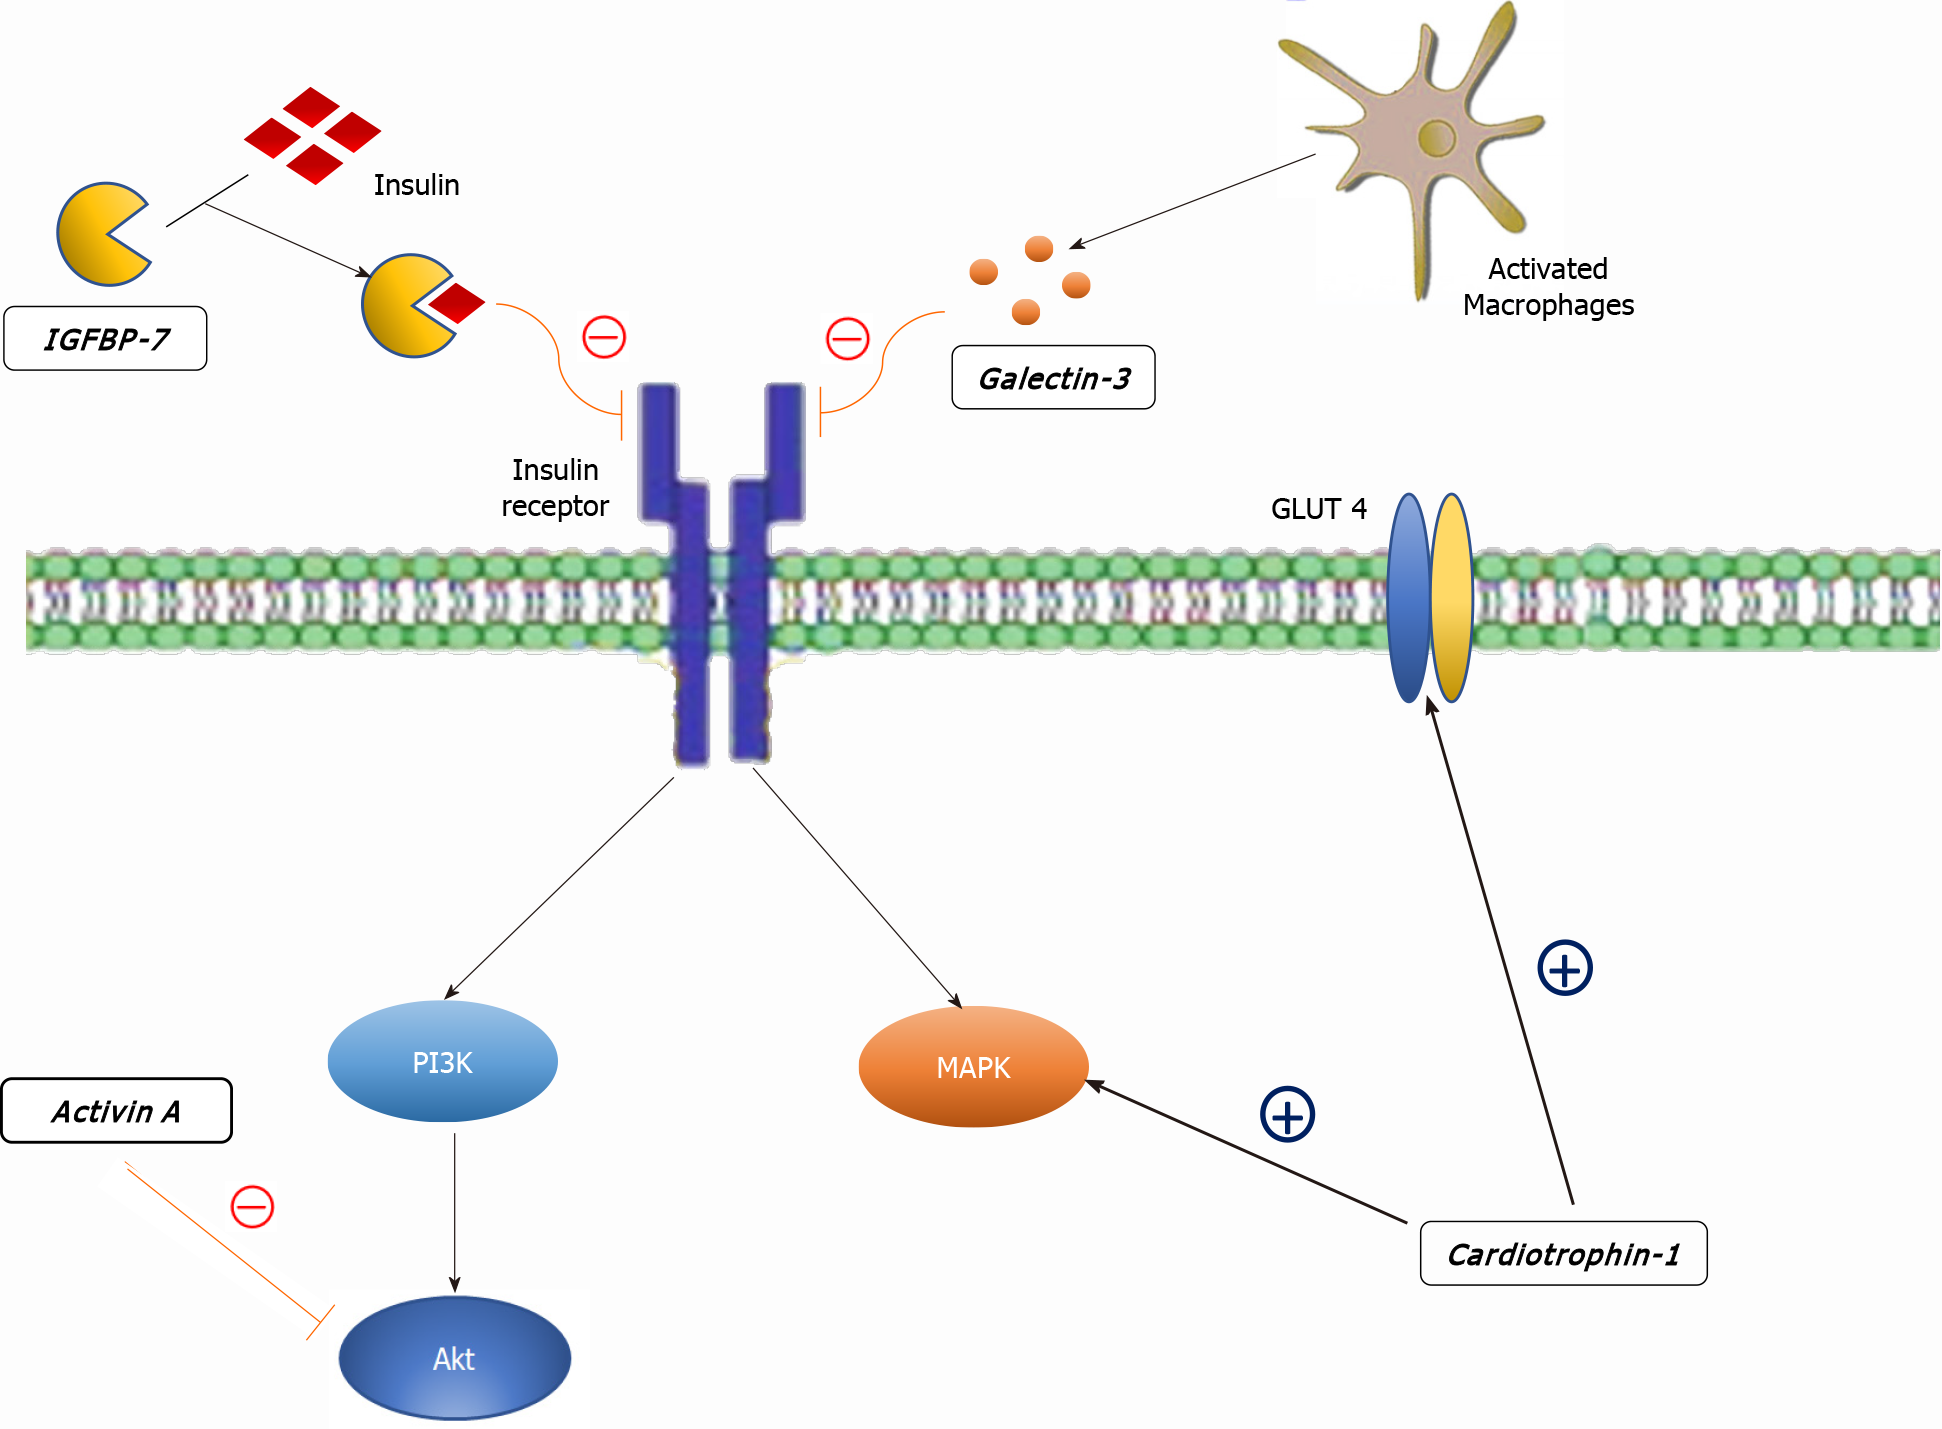
Figure 2 Molecular targets of the diabetic cardiomyopathy biomarkers in cardiomyoctes.
MAPK: Mitogen-activated protein kinase; PI3K: Phosphatidylinositol 3-kinase-protein kinase B; IGFBP7: Insulin-like growth factor binding protein 7; GLUT4: Glucose transporter type 4.
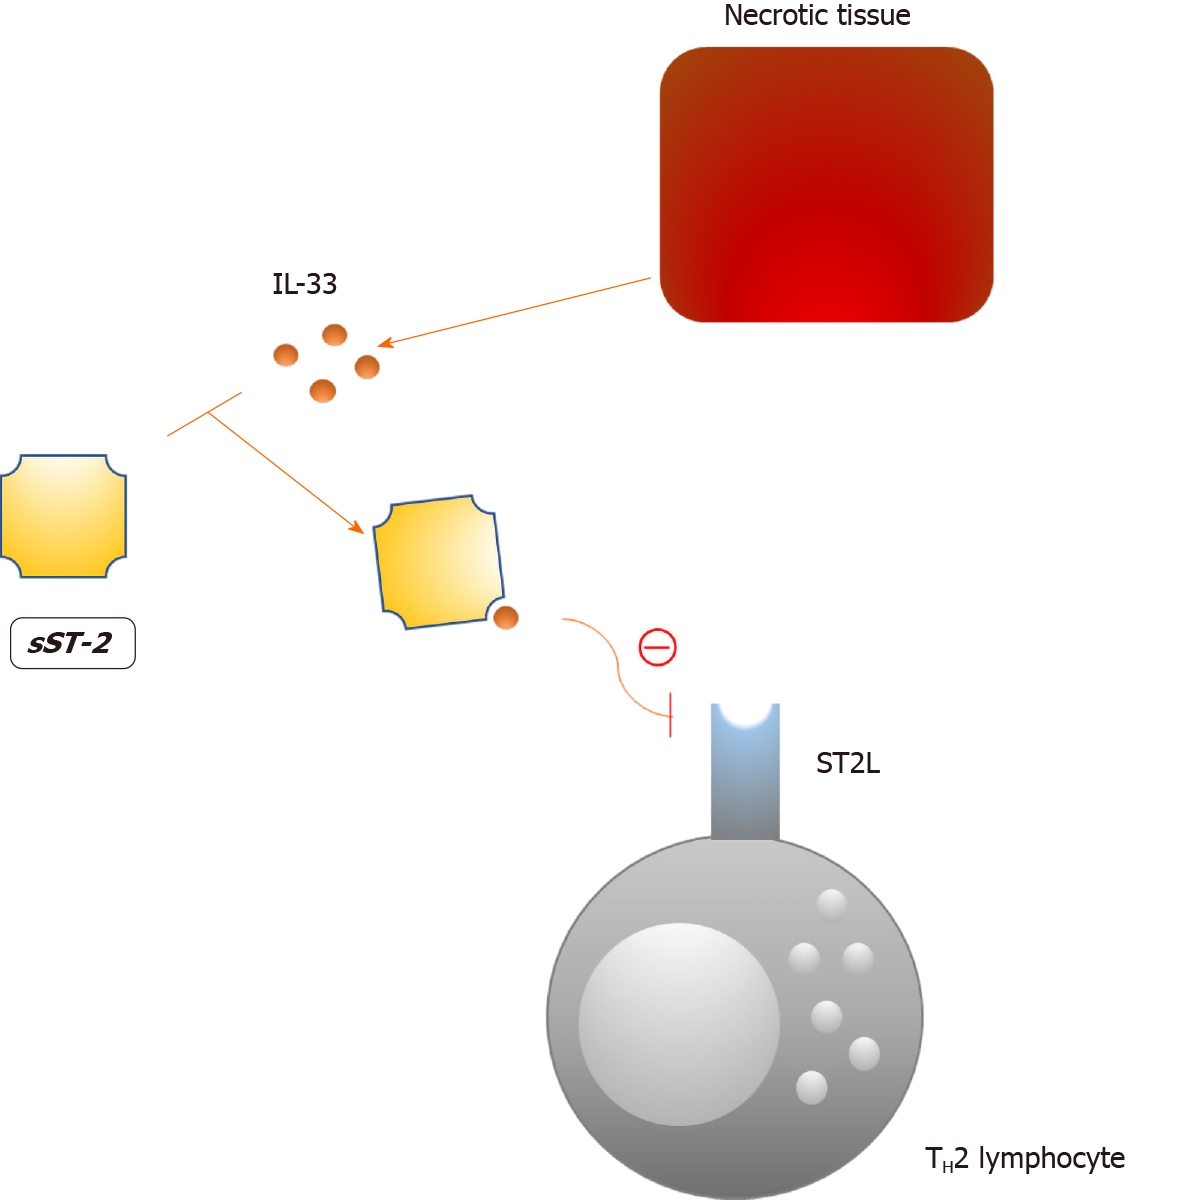
Figure 3 Molecular target of the soluble form of suppression of tumorigenicity 2.
sST2: Soluble form of suppression of tumorigenicity 2; IL-33: Interleukin-33; ST2L: Suppression of tumorigenicity 2 ligand; TH2: T helper lymphocyte type 2.
- Citation: Kumric M, Ticinovic Kurir T, Borovac JA, Bozic J. Role of novel biomarkers in diabetic cardiomyopathy. World J Diabetes 2021; 12(6): 685-705
- URL: https://www.wjgnet.com/1948-9358/full/v12/i6/685.htm
- DOI: https://dx.doi.org/10.4239/wjd.v12.i6.685


