Copyright
©The Author(s) 2021.
World J Diabetes. Mar 15, 2021; 12(3): 278-291
Published online Mar 15, 2021. doi: 10.4239/wjd.v12.i3.278
Published online Mar 15, 2021. doi: 10.4239/wjd.v12.i3.278
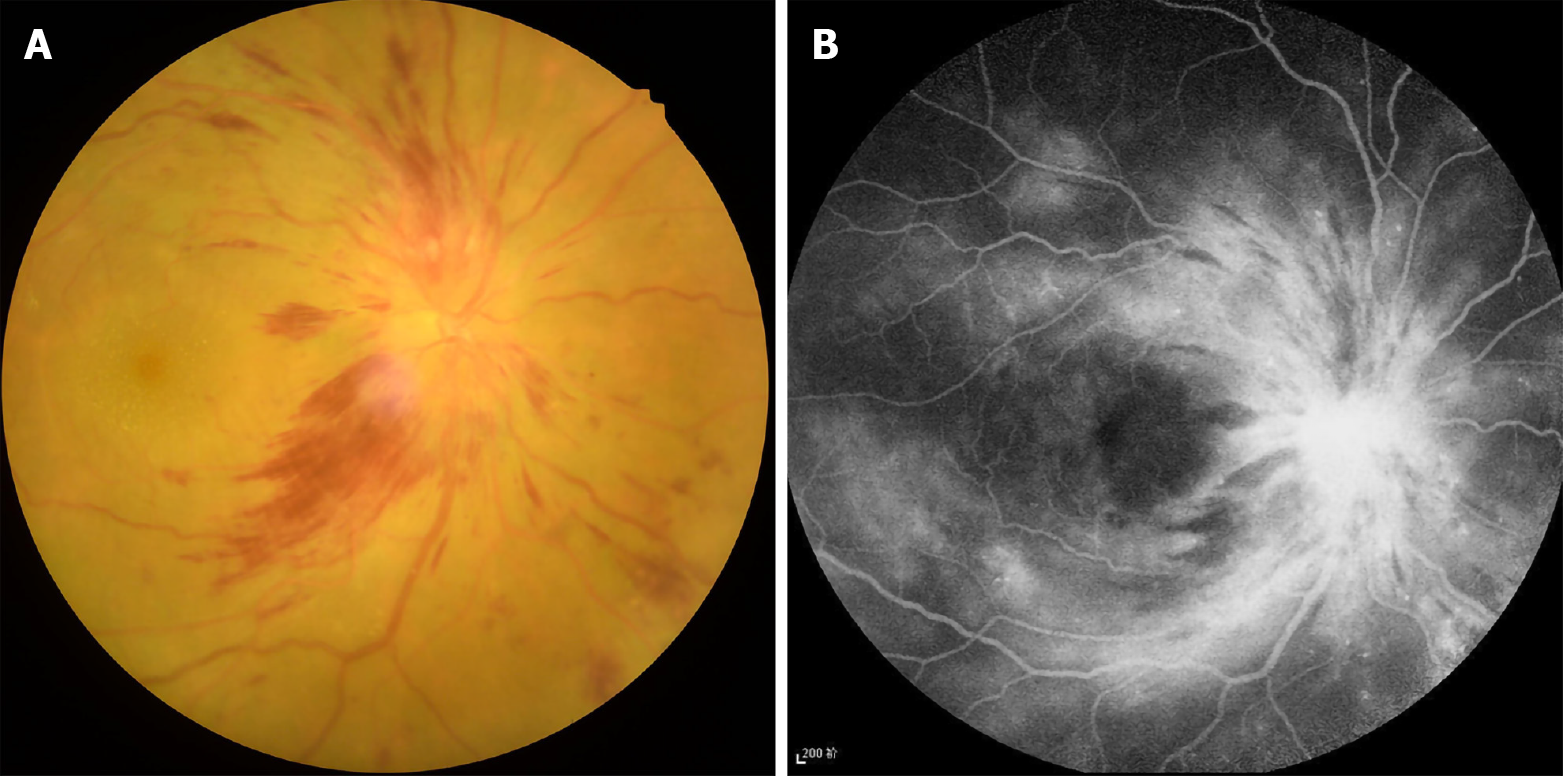
Figure 1 Typical example of diabetic optic neuropathy seen on fundus camera and fluorescence fundus angiography.
A: Fundus camera; B: Fluorescence fundus angiography.
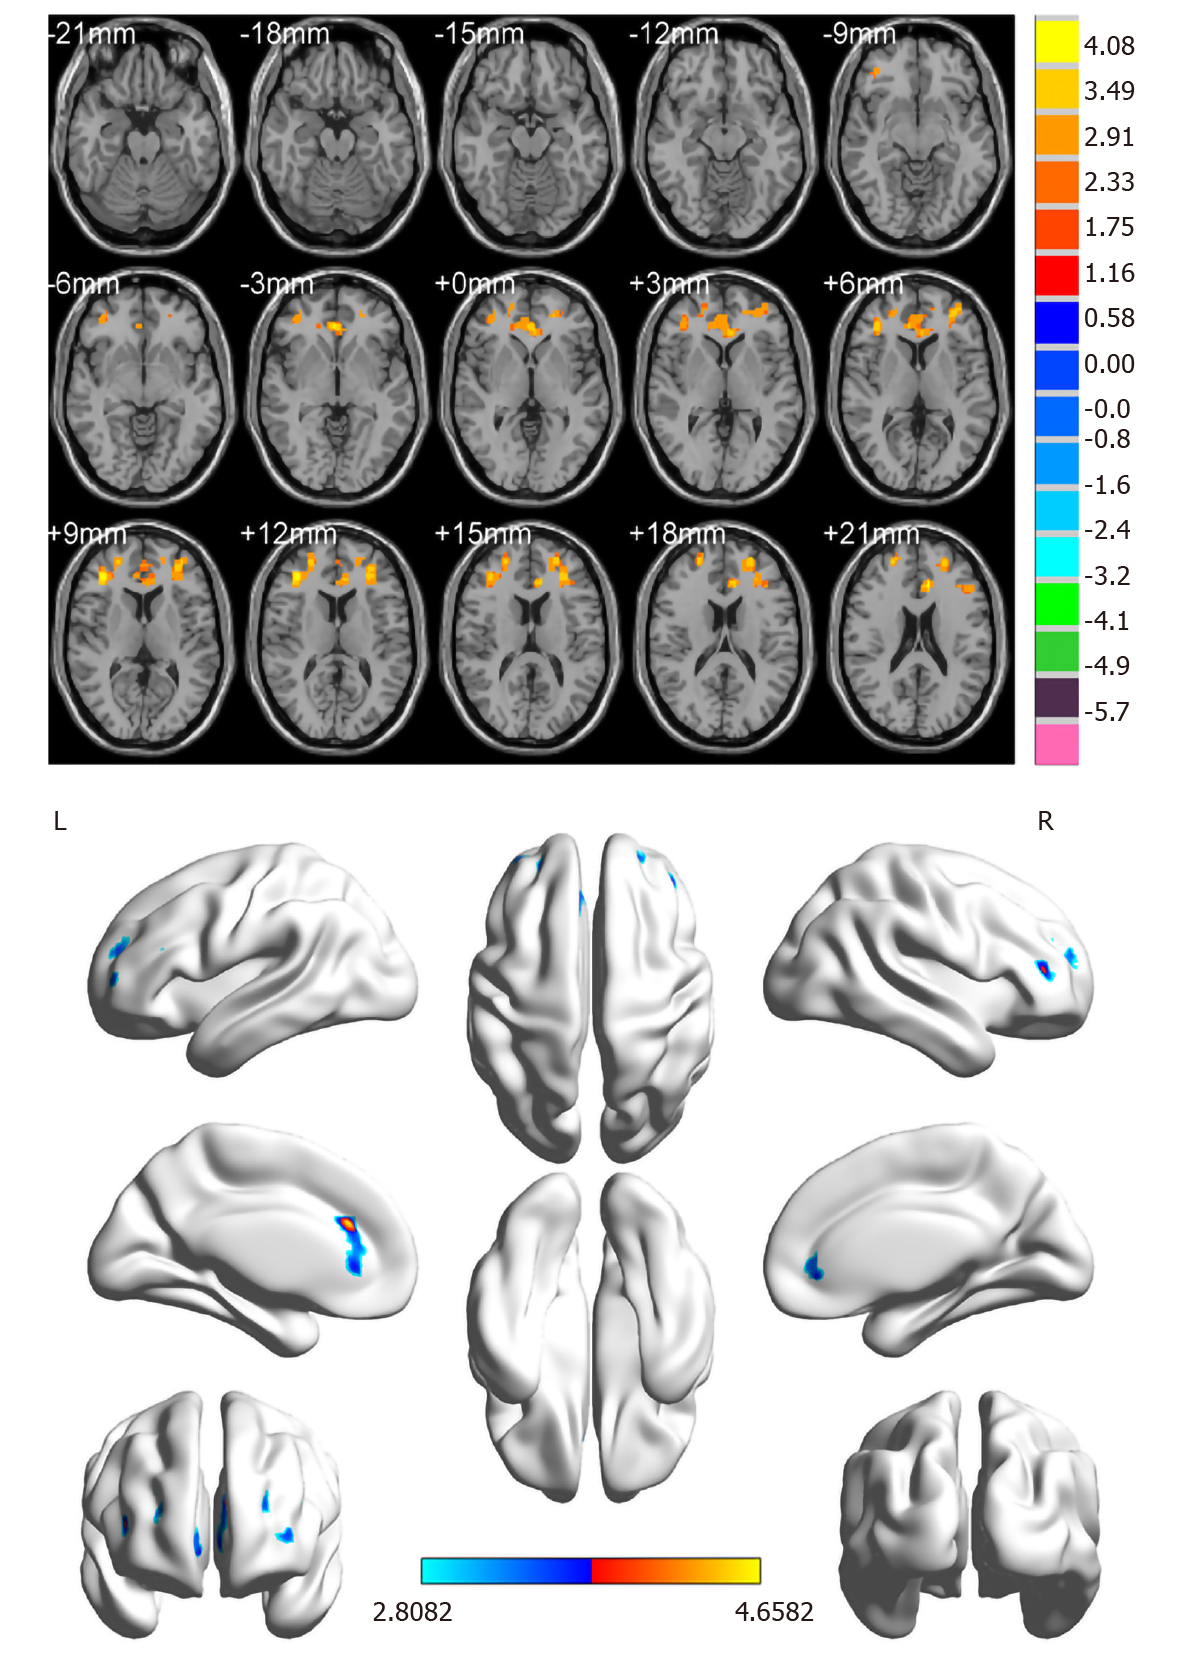
Figure 2 Spontaneous brain activity in patients with diabetic optic neuropathy.
Blue regions (right middle frontal gyrus, left anterior cingulate, and superior frontal gyrus/left frontal superior orbital gyrus) indicate lower regional homogeneity values (z > 2.3, P < 0.05, cluster size, > 40, AlphaSim-corrected). R: Right; L: Left.
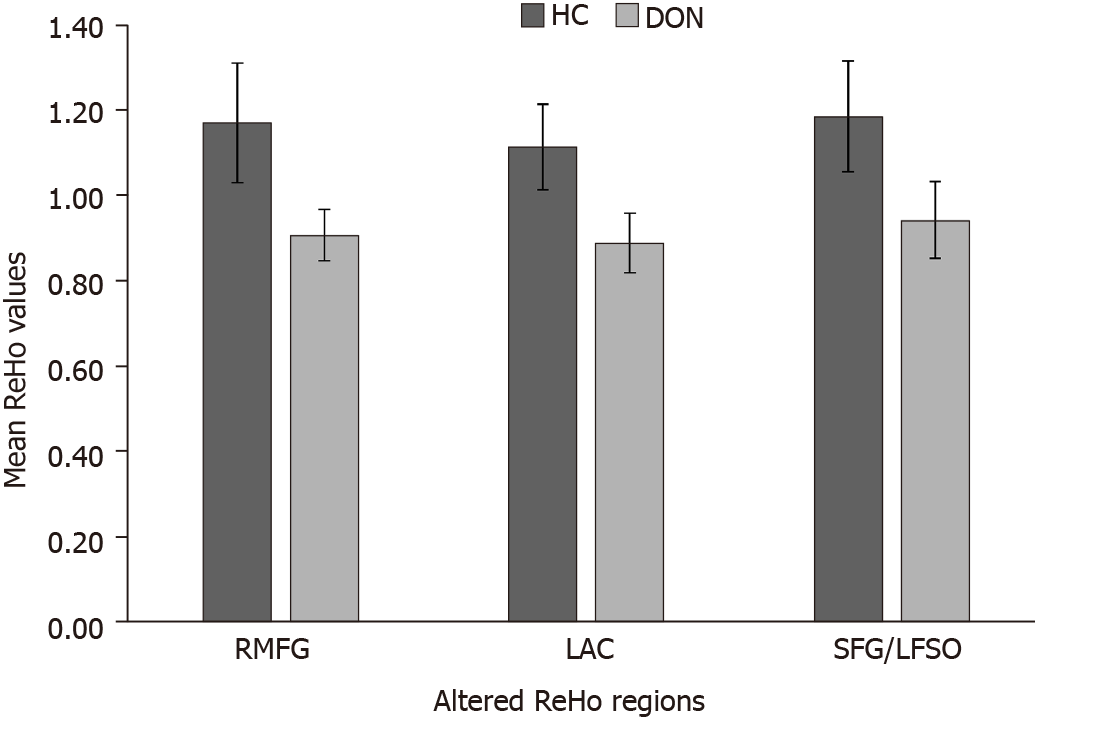
Figure 3 Means of altered regional homogeneity between the diabetic optic neuropathy group and healthy controls.
ReHo: Regional homogeneity; DON: Diabetic optic neuropathy; HC: Healthy control; RMFG: Right middle frontal gyrus; LAC: Left anterior cingulate; SFG: Superior frontal gyrus; LFSO: Left frontal superior orbital gyrus.
Figure 4 Receiver operating characteristic curve analysis of the mean regional homogeneity values for altered brain regions.
The area under the receiver operating characteristic curve was 0.984, (P < 0.001; 95%CI: 0.945-1.000) for the right middle frontal gyrus; 0.984 (P < 0.001; 95%CI: 0.948-1.000) for the left anterior cingulate; and 0.929 (P < 0.001; 95%CI: 0.832-1.000) for the superior frontal gyrus/left frontal superior orbital gyrus. ROC: Receiver operating characteristic; RMFG: Right middle frontal gyrus; LAC: Left anterior cingulate; SFG: Superior frontal gyrus; LFSO: Left frontal superior orbital gyrus; AUC: Area under the ROC curve.
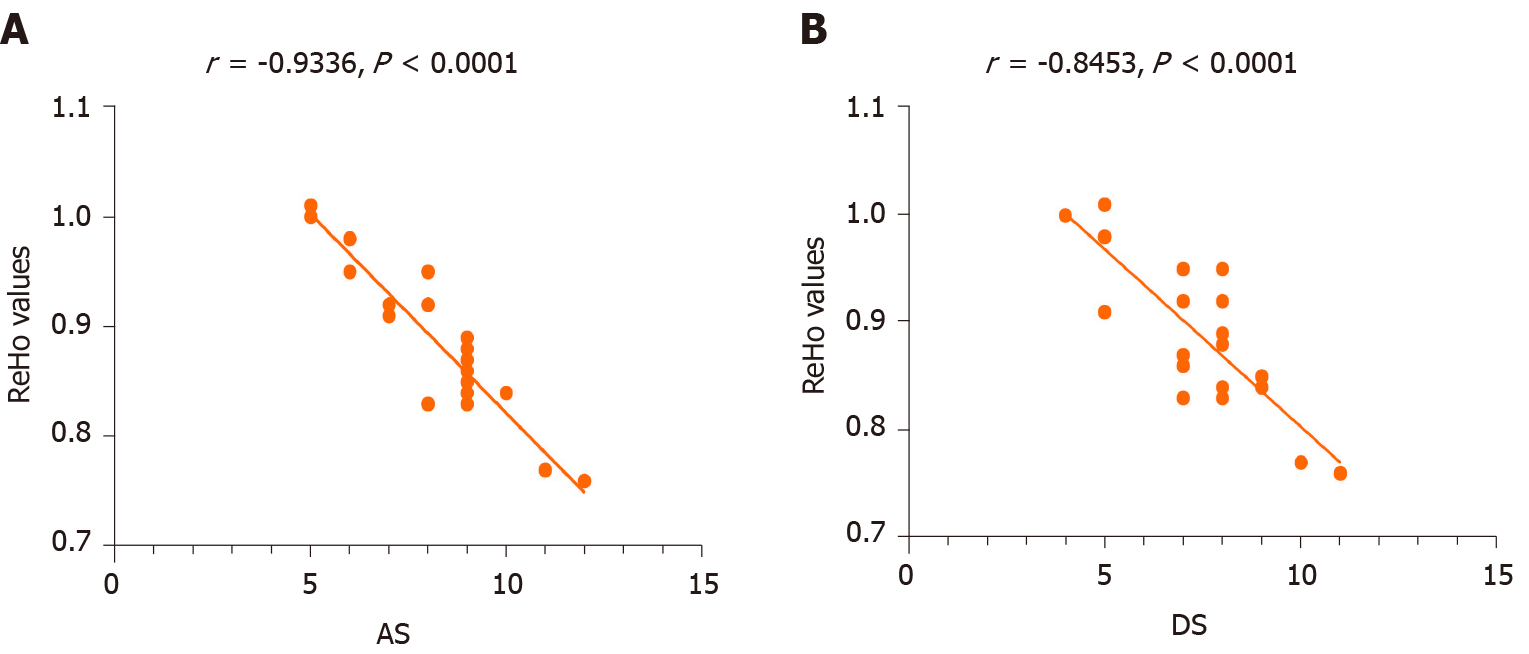
Figure 5 Correlations between the mean regional homogeneity values of the left anterior cingulate and the clinical behaviors.
A: The anxiety scores showed a negative correlation with the regional homogeneity (ReHo) values of the left anterior cingulate (LAC) (r = −0.9336, P < 0.001); B: The depression scores showed a negative correlation with the ReHo values of the LAC (r = −0.8453, P < 0.001). ReHo: Regional homogeneity; AS: Anxiety scores; DS: Depression scores.
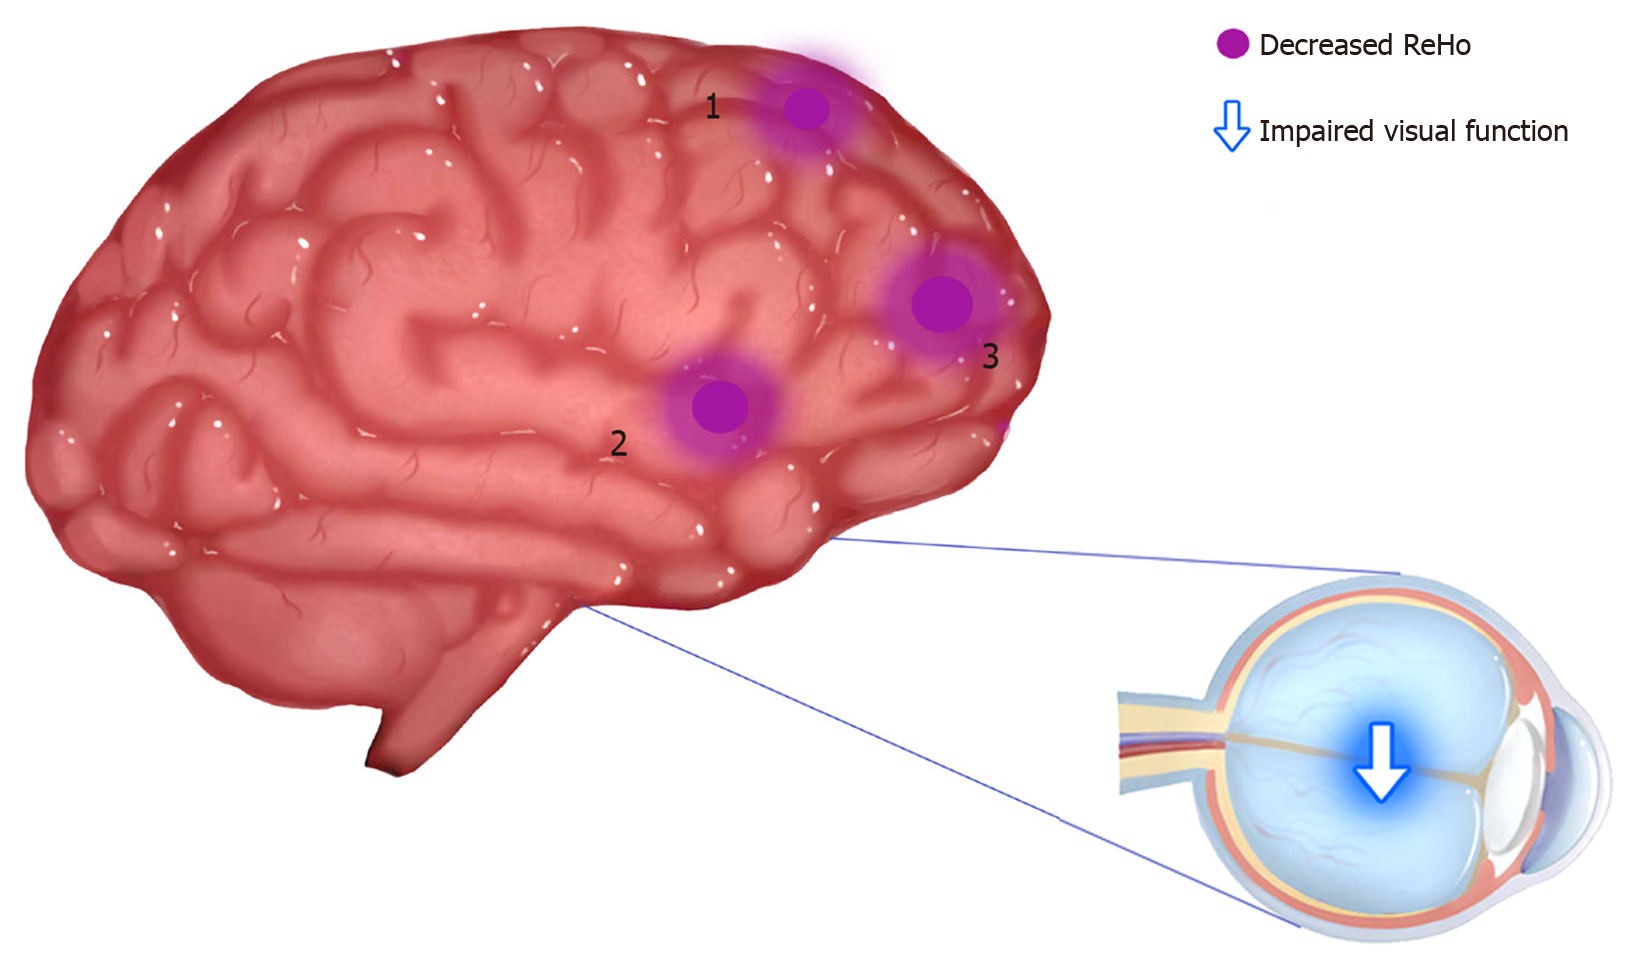
Figure 6 Regional homogeneity results of brain activity in the diabetic optic neuropathy group.
Compared with the healthy controls, the regional homogeneity values of regions 1-3 in diabetic optic neuropathy patients were decreased to various extents; region 1 refers to the superior frontal gyrus/left frontal superior orbital gyrus [Brodmann area (BA) 48; t = 4.0066], region 2 to the right middle frontal gyrus (BA 45; t = 4.4606), and region 3 to the left anterior cingulate (BA 32; t = 4.6582). ReHo: Regional homogeneity; 1: Superior frontal gyrus/left frontal superior orbital gyrus; 2: Right middle frontal gyrus; 3: Left anterior cingulate.
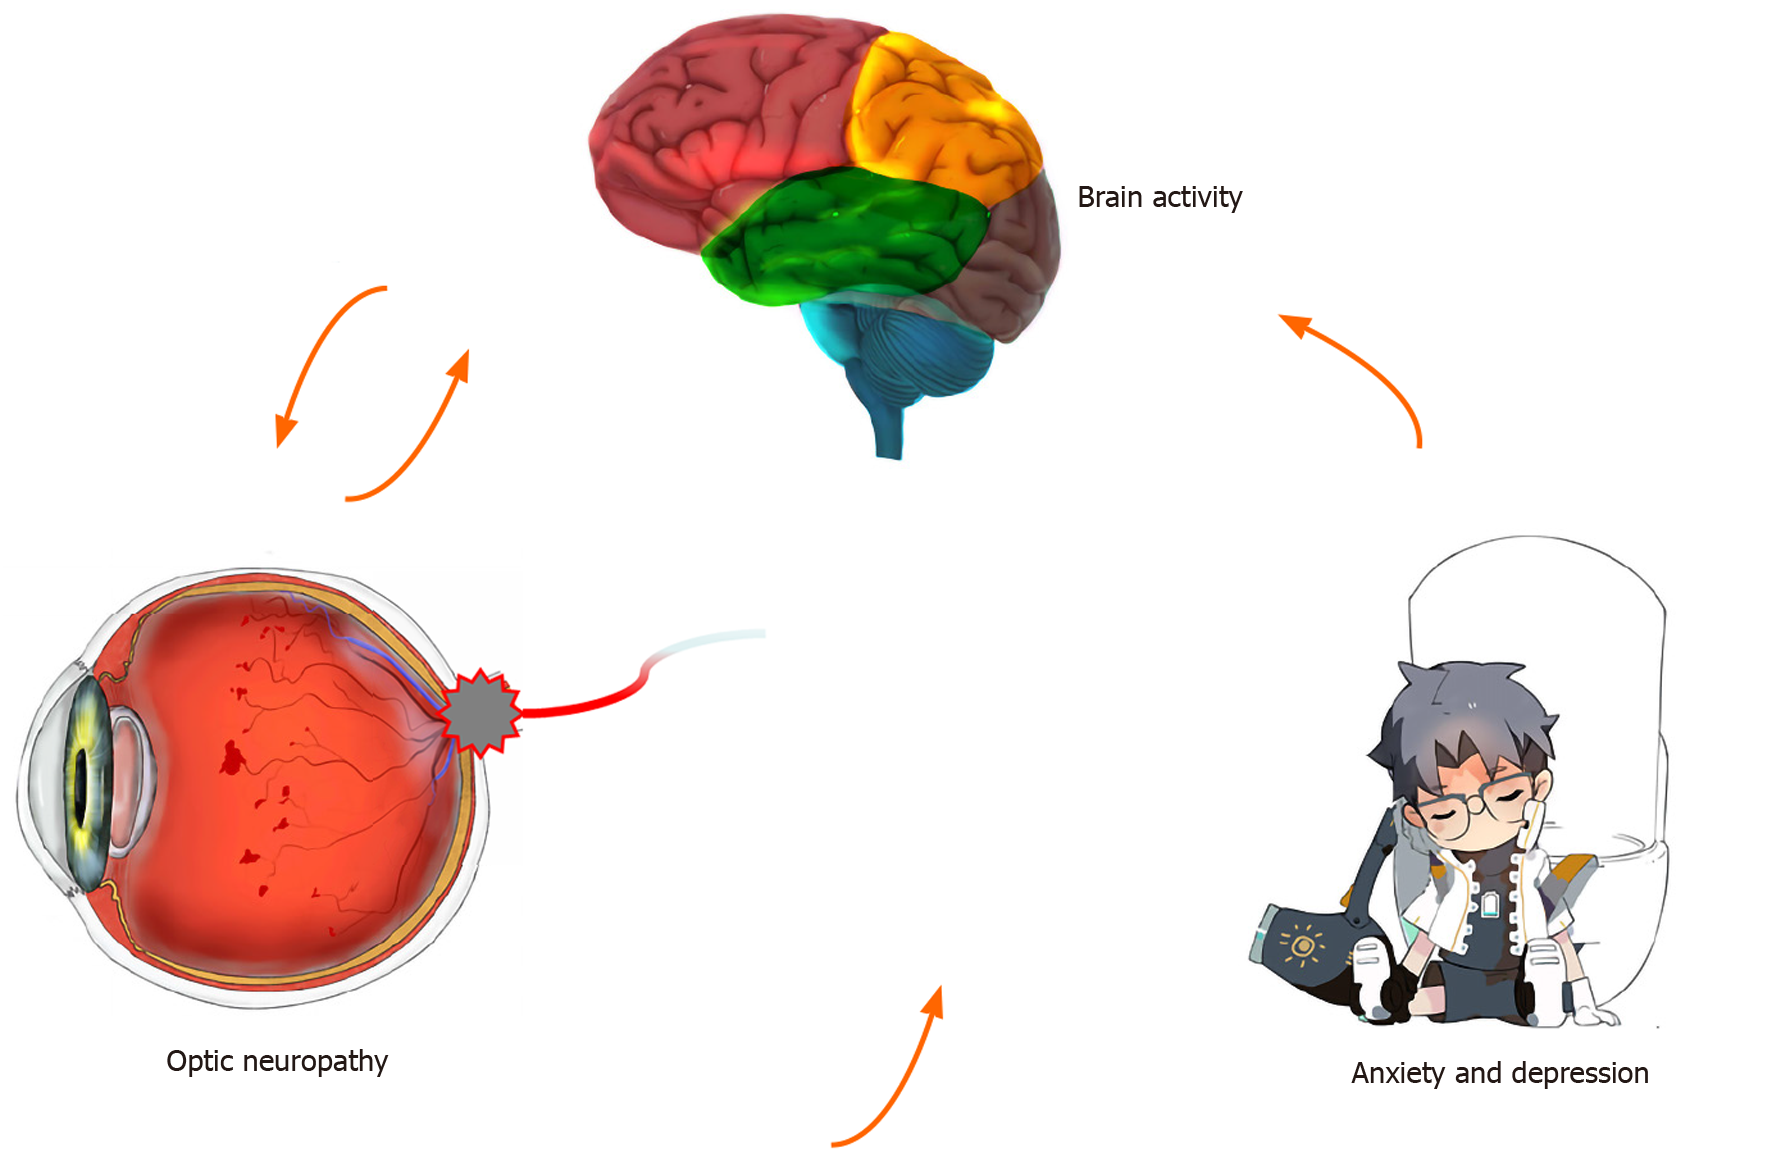
Figure 7 Relationship between regional homogeneity values of the left anterior cingulate and emotional state.
Compared with healthy controls, the regional homogeneity values of the left anterior cingulate were decreased and diabetic optic neuropathy patients are more likely to have anxiety and depression.
- Citation: Guo GY, Zhang LJ, Li B, Liang RB, Ge QM, Shu HY, Li QY, Pan YC, Pei CG, Shao Y. Altered spontaneous brain activity in patients with diabetic optic neuropathy: A resting-state functional magnetic resonance imaging study using regional homogeneity. World J Diabetes 2021; 12(3): 278-291
- URL: https://www.wjgnet.com/1948-9358/full/v12/i3/278.htm
- DOI: https://dx.doi.org/10.4239/wjd.v12.i3.278


