Copyright
©The Author(s) 2020.
World J Diabetes. Jul 15, 2020; 11(7): 309-321
Published online Jul 15, 2020. doi: 10.4239/wjd.v11.i7.309
Published online Jul 15, 2020. doi: 10.4239/wjd.v11.i7.309
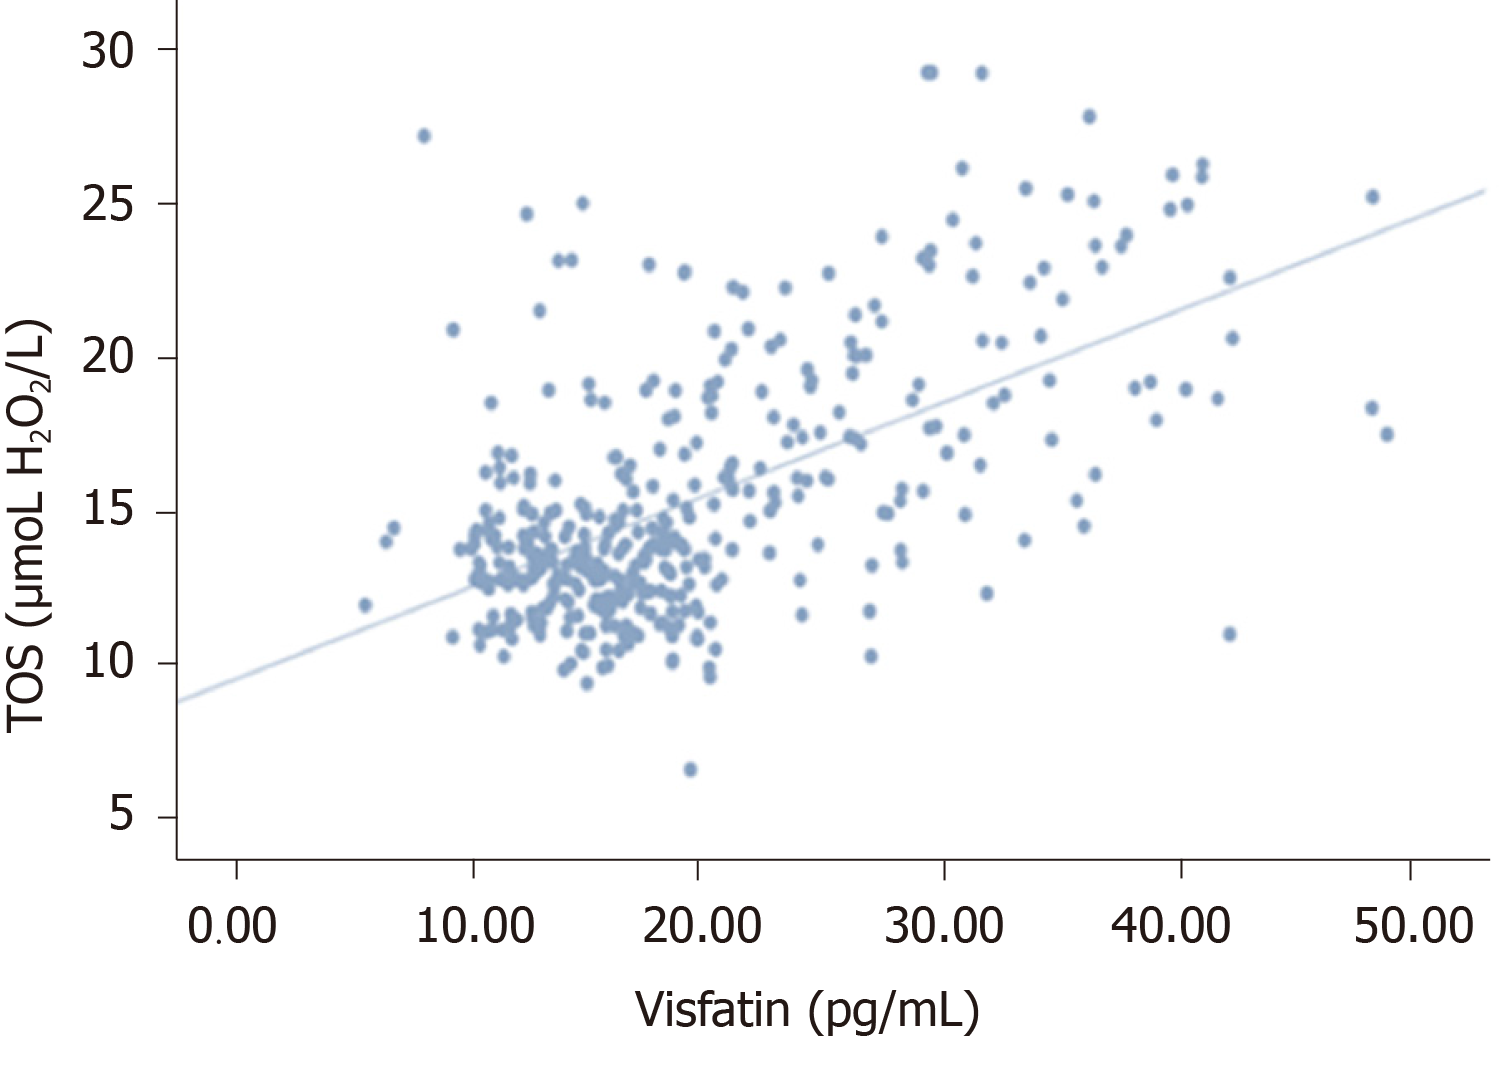
Figure 1 Positive correlation between visfatin and total oxidant status (P < 0.
05, r = 0.407). TOS: Total oxidant status.
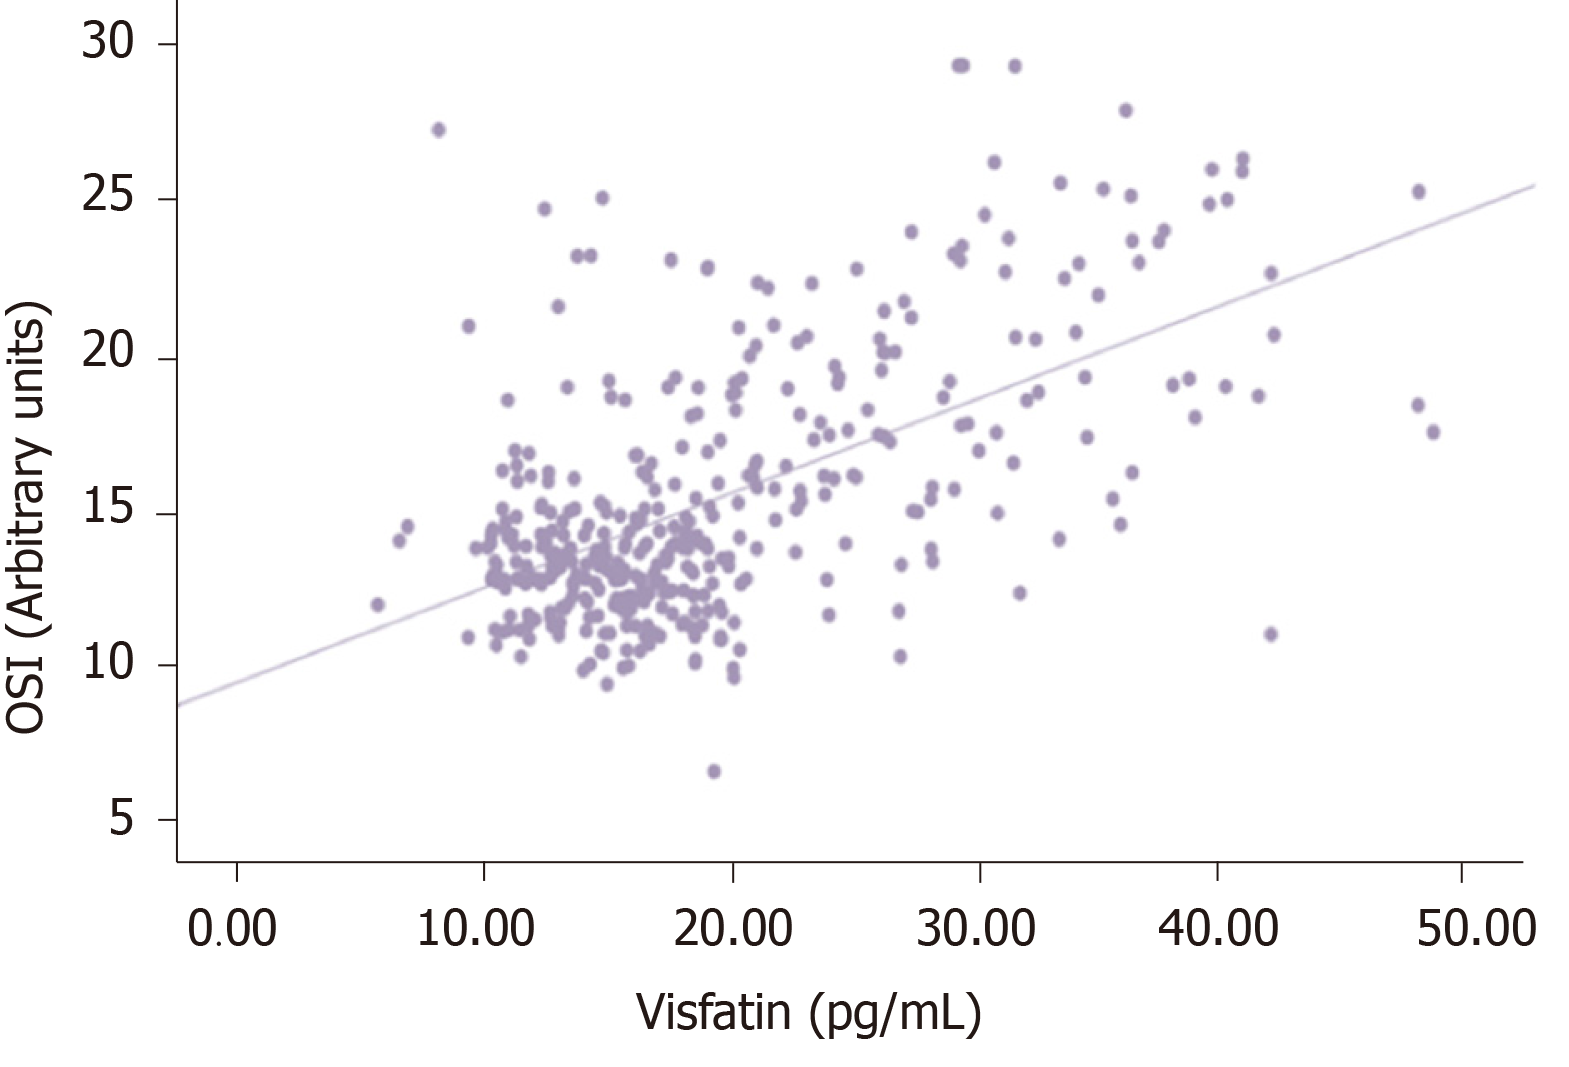
Figure 2 Positive correlation between visfatin and oxidative stress index (P < 0.
05, r = 0.587). OSI: Oxidative stress index.
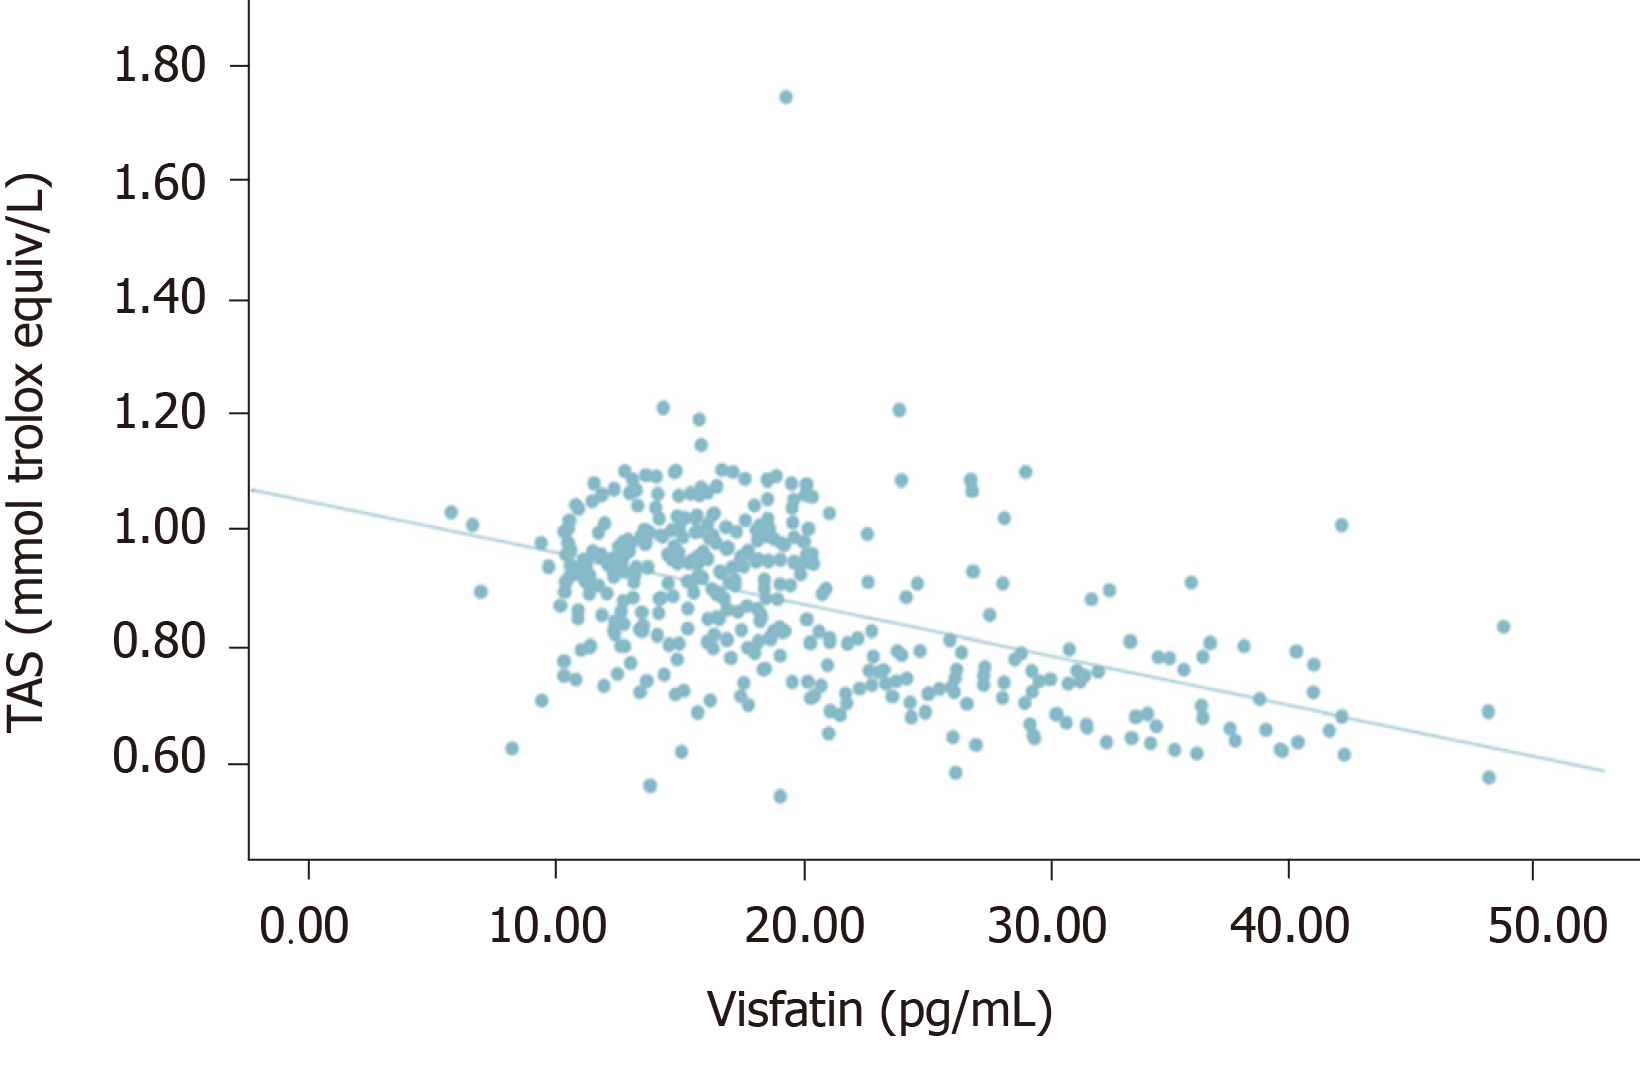
Figure 3 Negative correlation between visfatin and total antioxidant status (P < 0.
05, r = -0.499). TAS: Total antioxidant status.
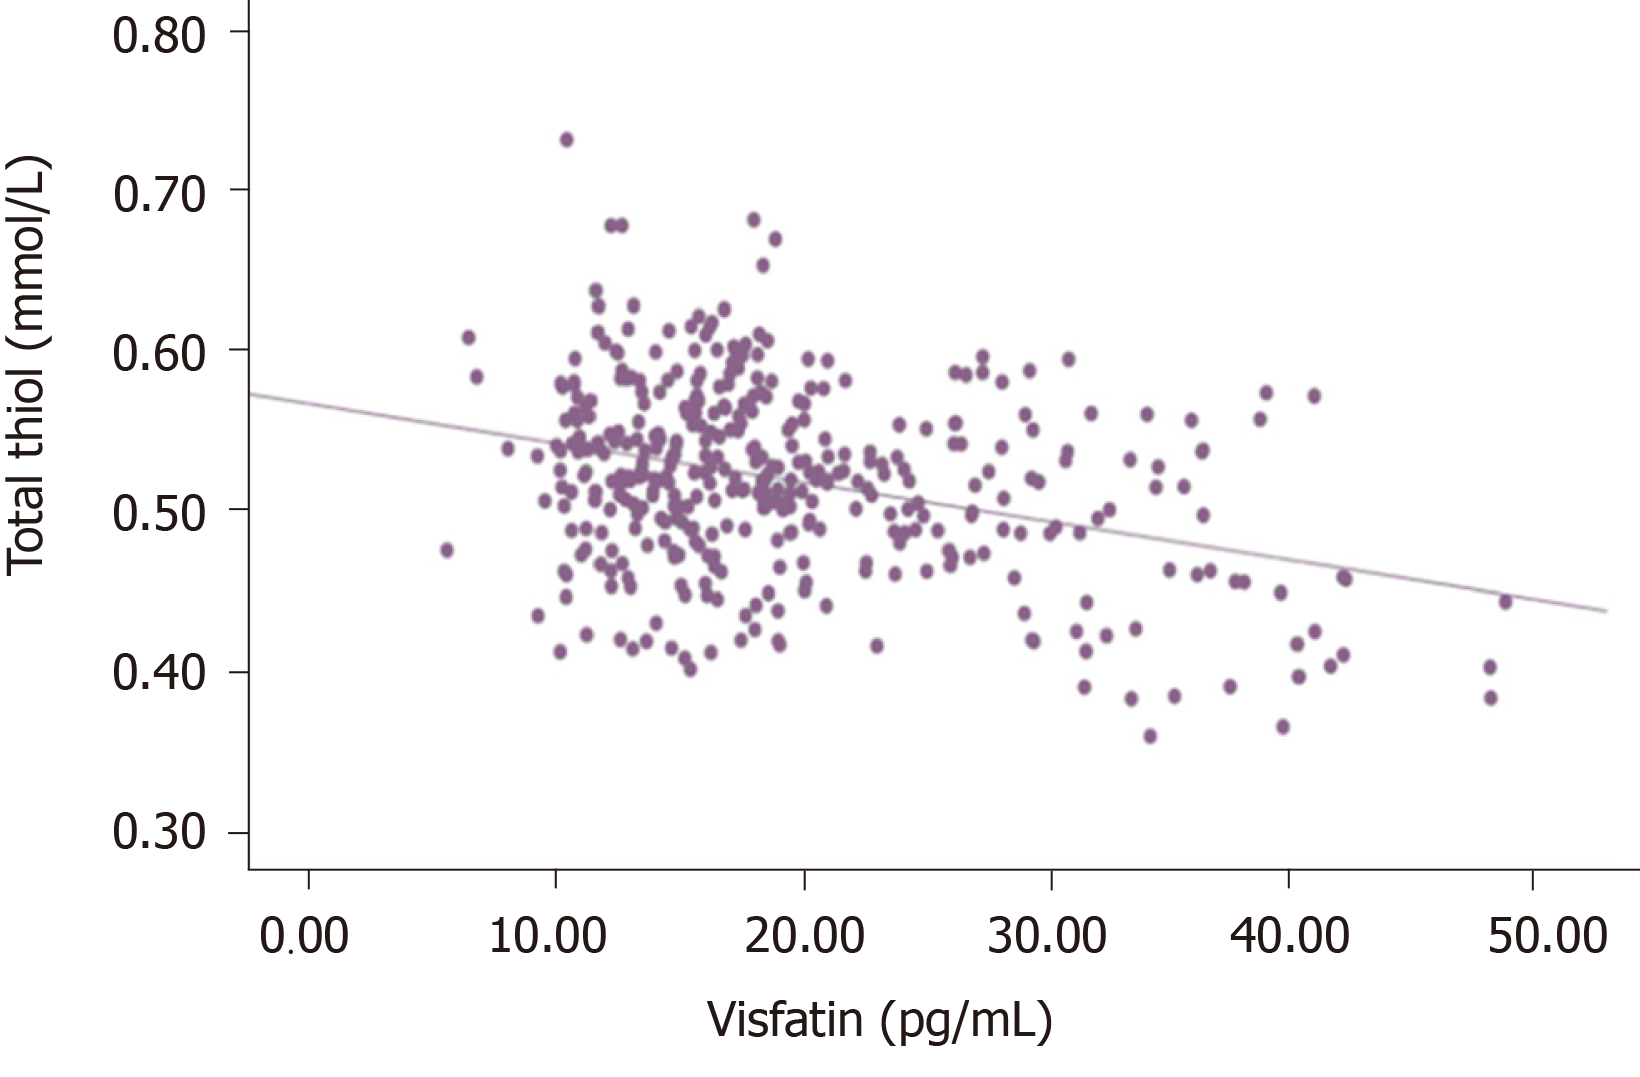
Figure 4 Negative correlation between visfatin and total thiol (P < 0.
05, r = -0.338).
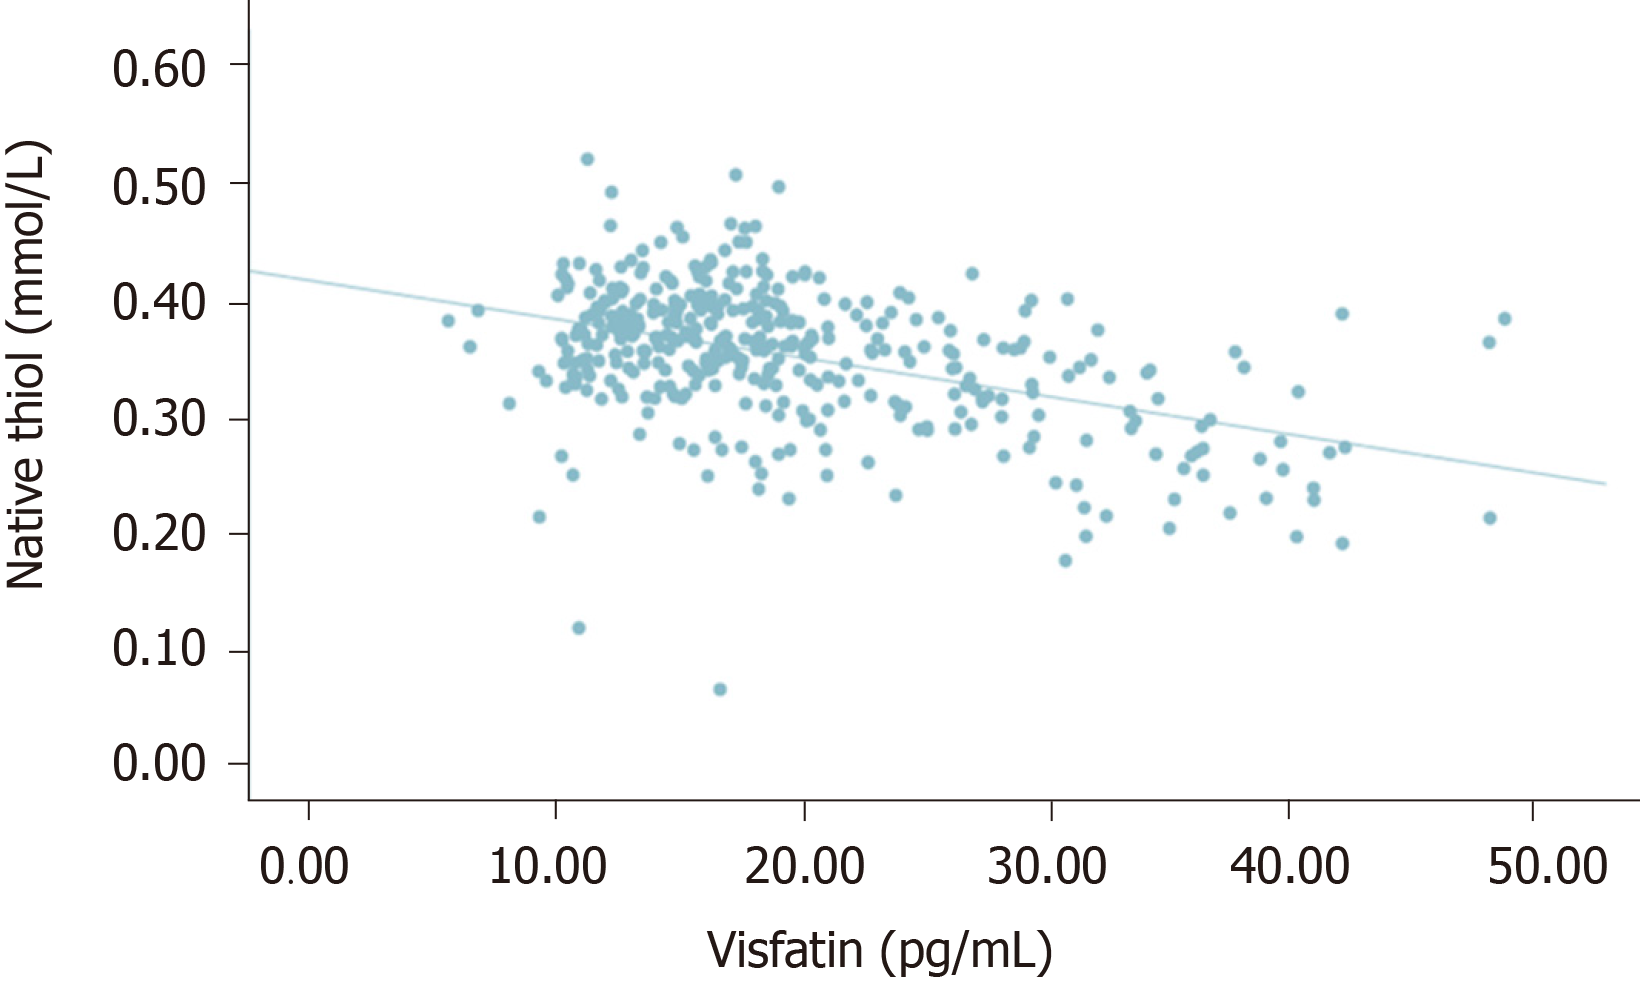
Figure 5 Negative correlation between visfatin and native thiol (P < 0.
05, r = -0.448).
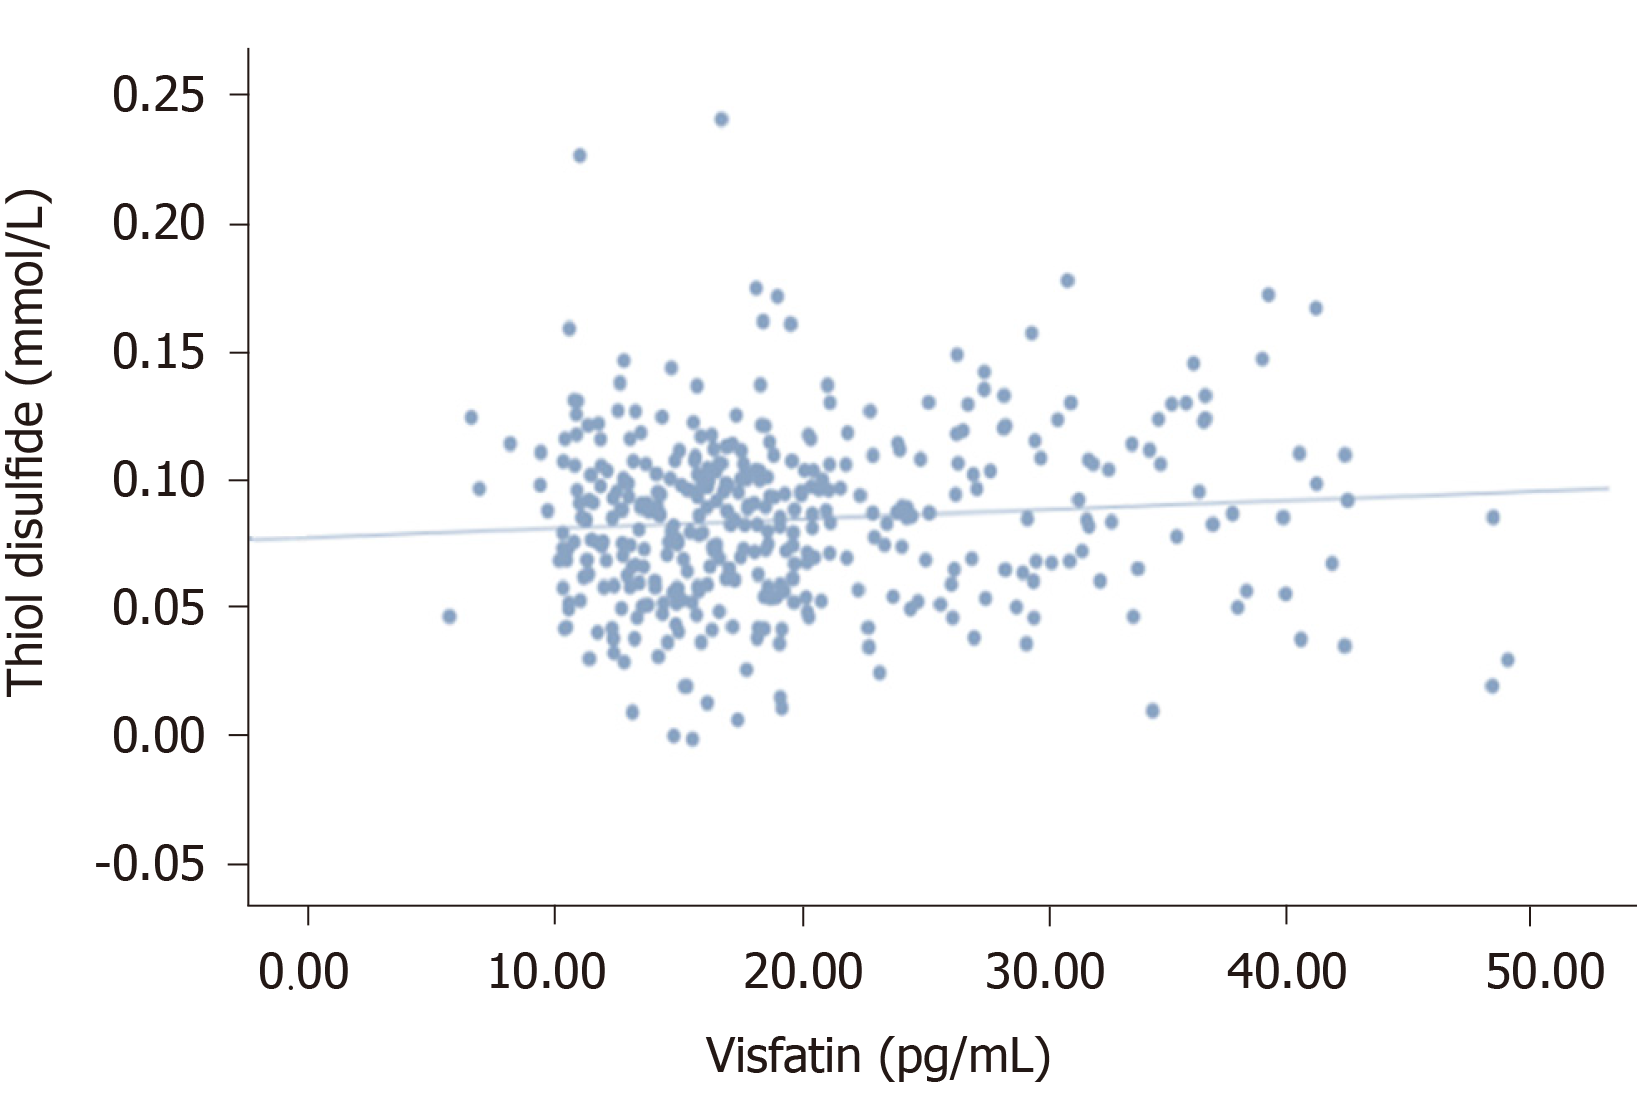
Figure 6 There is no statistical relationship between visfatin and thiol-disulfide (P = 0.
092, r = 0.086).
- Citation: Buyukaydin B, Guler EM, Karaaslan T, Olgac A, Zorlu M, Kiskac M, Kocyigit A. Relationship between diabetic polyneuropathy, serum visfatin, and oxidative stress biomarkers. World J Diabetes 2020; 11(7): 309-321
- URL: https://www.wjgnet.com/1948-9358/full/v11/i7/309.htm
- DOI: https://dx.doi.org/10.4239/wjd.v11.i7.309


