Copyright
©The Author(s) 2020.
World J Diabetes. Apr 15, 2020; 11(4): 126-136
Published online Apr 15, 2020. doi: 10.4239/wjd.v11.i4.126
Published online Apr 15, 2020. doi: 10.4239/wjd.v11.i4.126
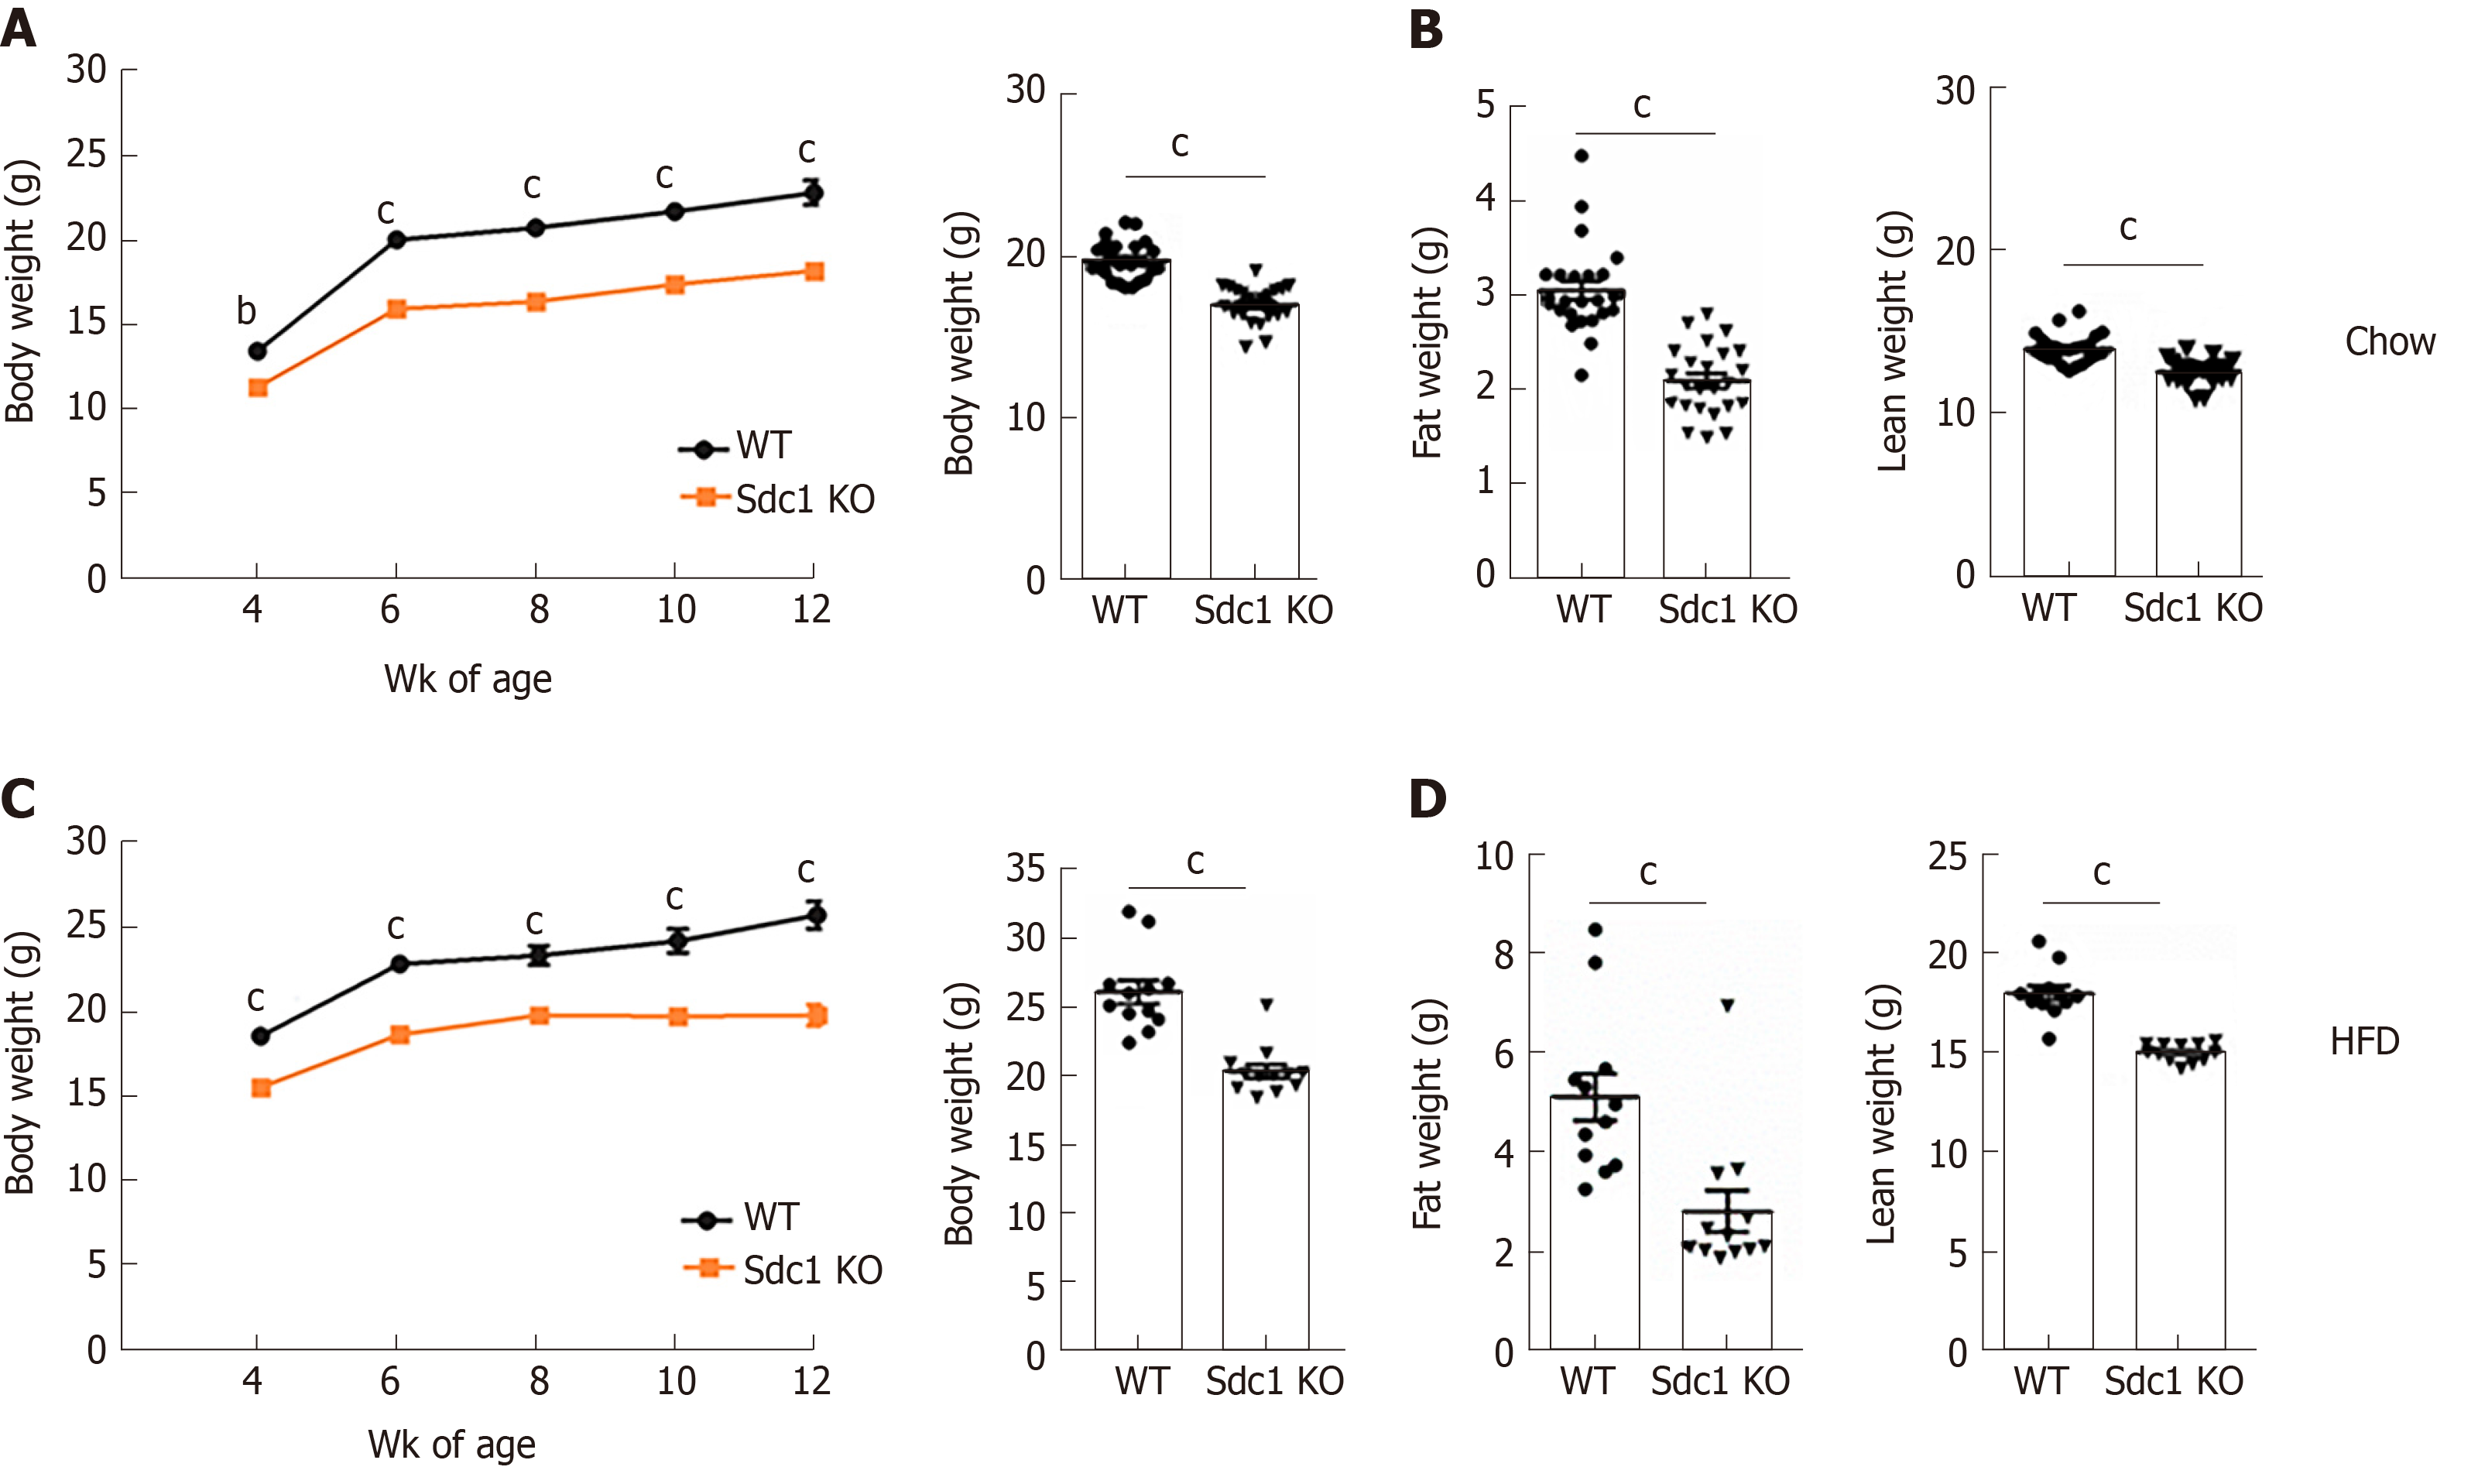
Figure 1 Effect of syndecan-1 deletion on body weight and fat content.
A, B: Age-matched Sdc1 knockout (Sdc1 KO) and wild type (WT) mice were fed either chow diet or high-fat diet for indicated periods. Sdc1 KO mice maintained their body weight overtime than WT mice. There was significant difference in total body weight, fat mass and lean mass of chow-fed Sdc1 KO mice compared with WT mice; C, D: Like, chow diet fed mice, high-fat diet fed mice also maintained the difference in body weight, fat mass and lean mass. Bar graphs show cumulative data from two independent experiment of total 24 female BALB/c mice and represents mean ± SE of 12-24 animals of each genotype. bP < 0.01, cP < 0.001. Sdc1 KO: Sdc1 knockout; HFD: High-fat diet; WT: Wild type.
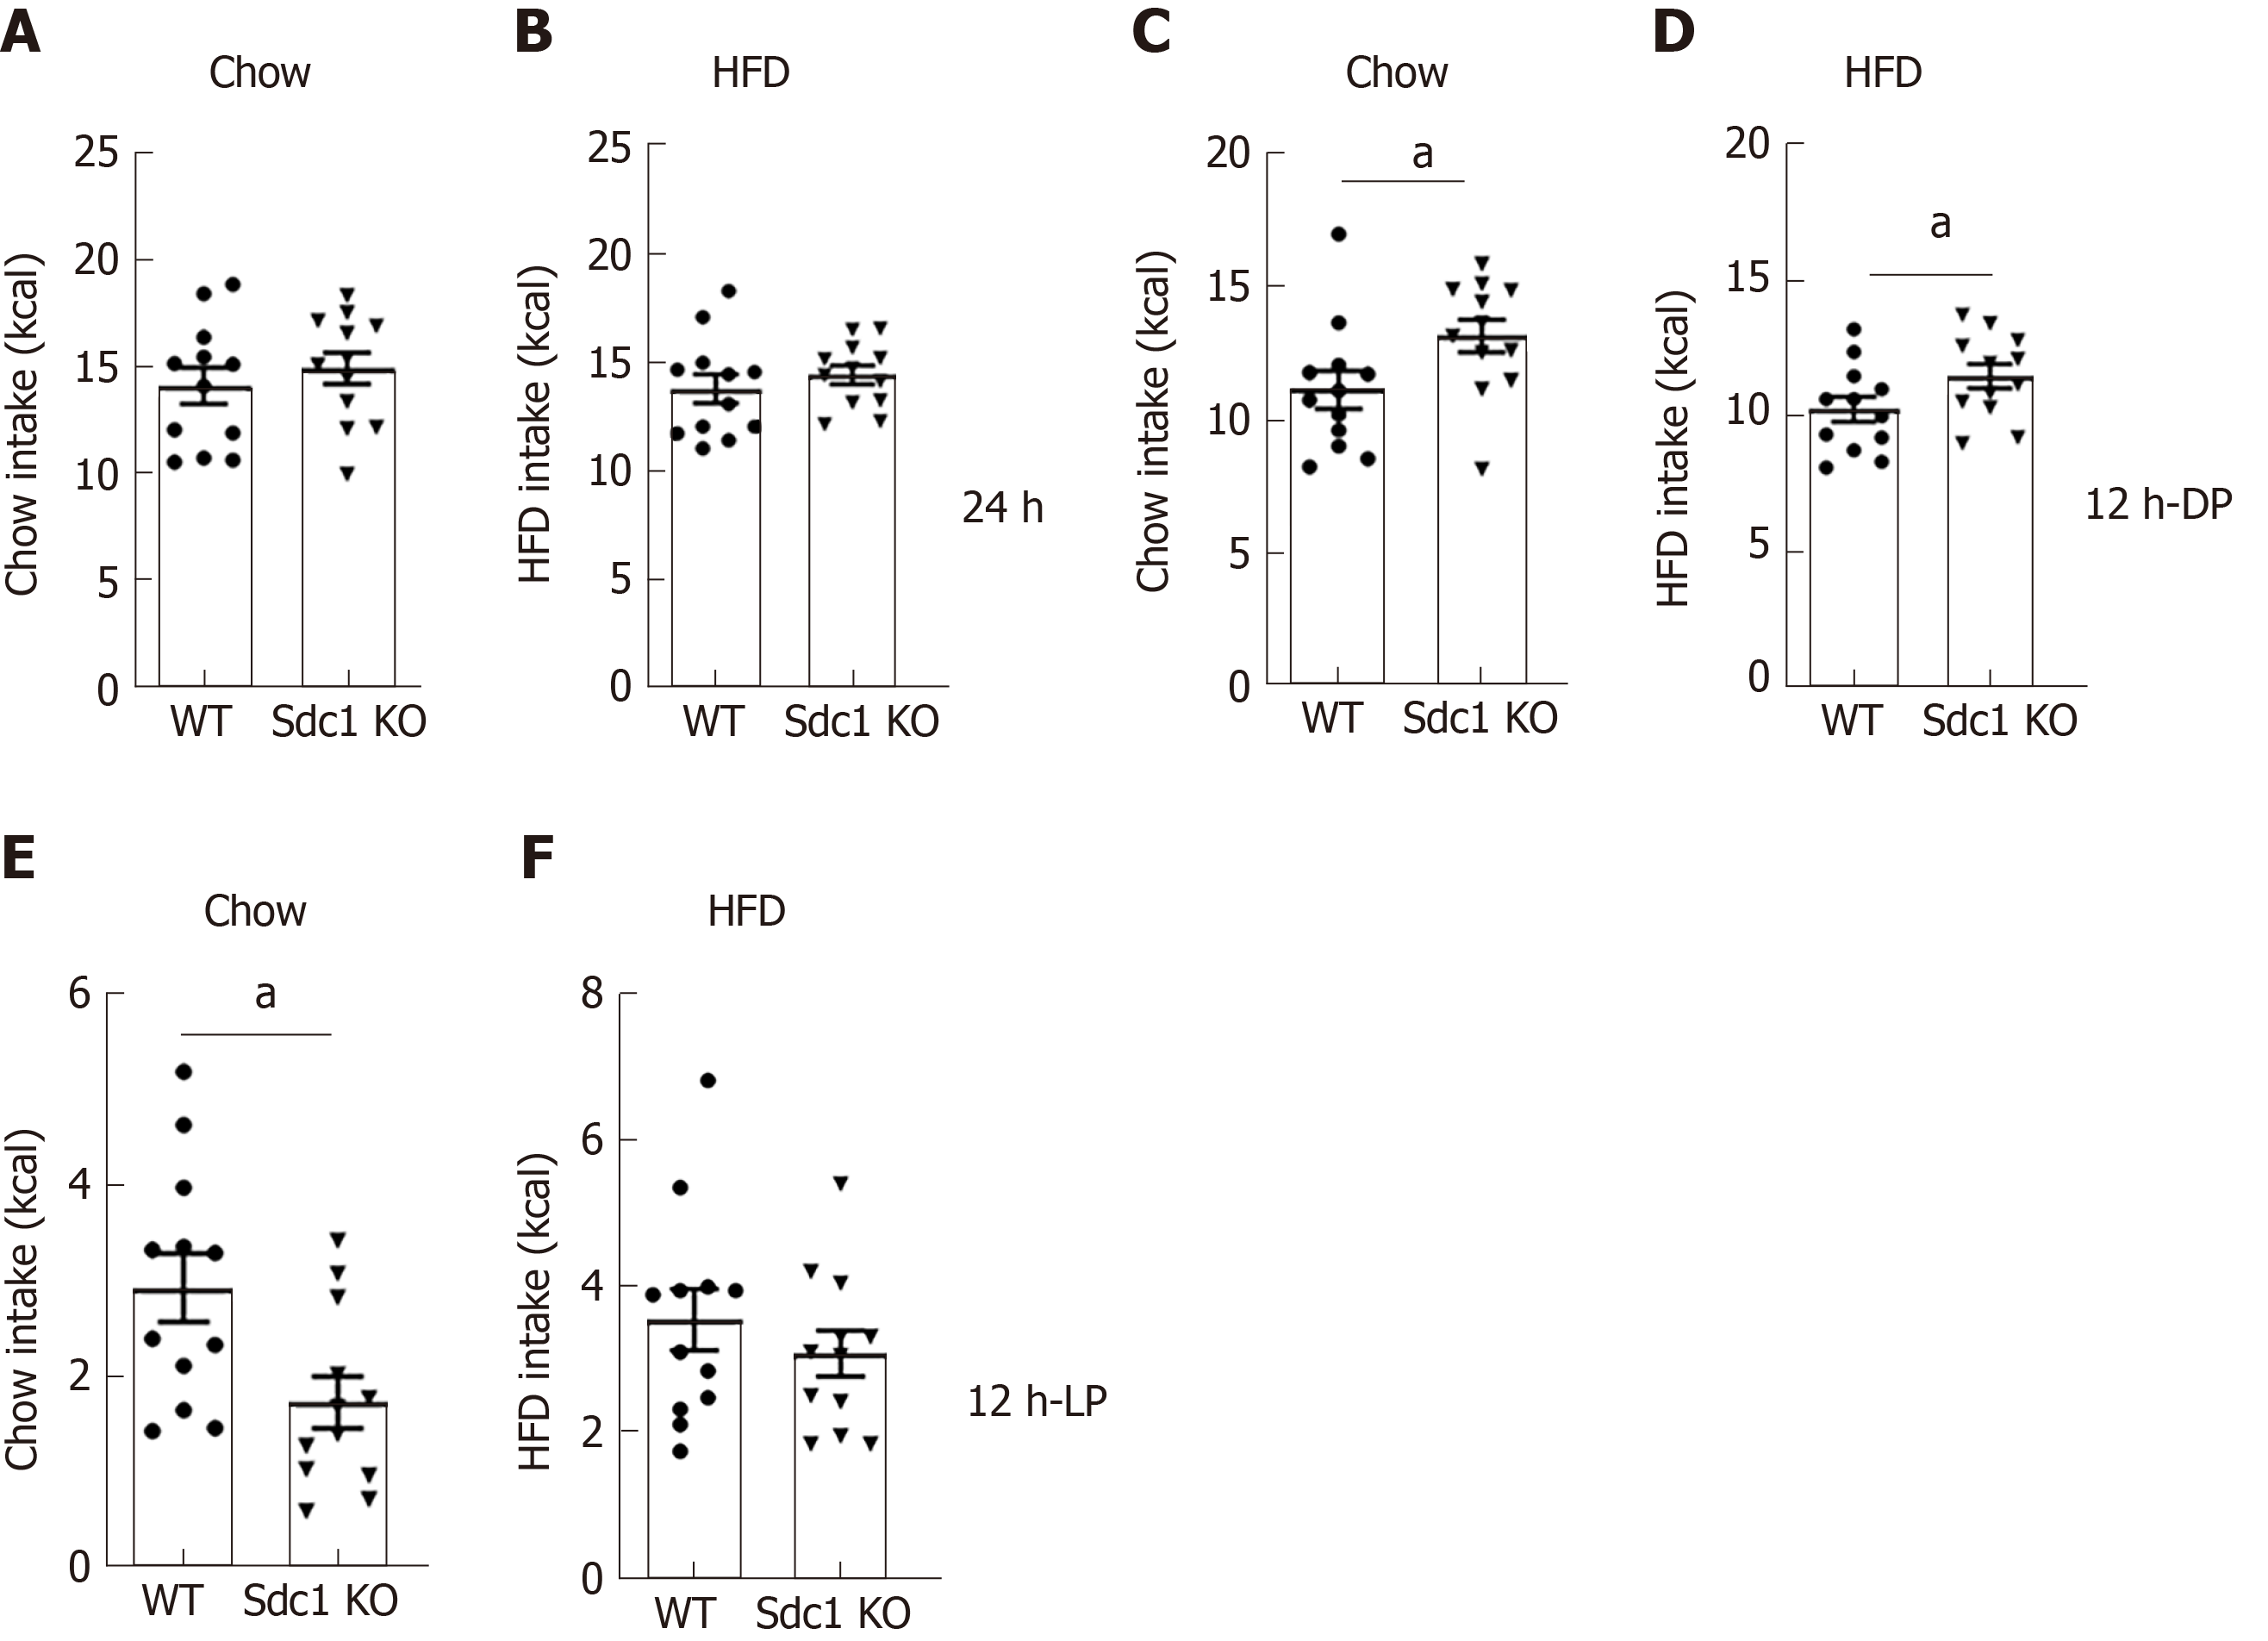
Figure 2 Energy intake on chow-fed and high fat-fed diets.
Age matched Sdc1 knockout (Sdc1 KO), wild type (WT) mice kept on both chow and high-fat diet (HFD) for 8 wk and then indirect calorimetry was performed using the Oxymax/CLAMS system. Daily energy intake and body weight were monitored in each mice of each genotypes. Measurements were performed over 4 consecutive days following a 24-h acclimation period and are shown food intake, normalized to body weight (kcal/g BW) or lean mass (kcal/g lean) measured by QNMRI immediately prior to calorimetry. A, B: Graphs shows cumulative food intake (kcal) measured in Sdc1 KO and WT mice fed with chow and HFD; C, D: Cumulative food intake (kcal) in Sdc1 KO and WT mice on chow and HFD during 12 h dark; E, F: 12 h light phases of day cycle. Data represents mean ± SE of total 12 animals of each genotype. aP < 0.05. Sdc1 KO: Sdc1 knockout; HFD: High-fat diet; WT: Wild type.
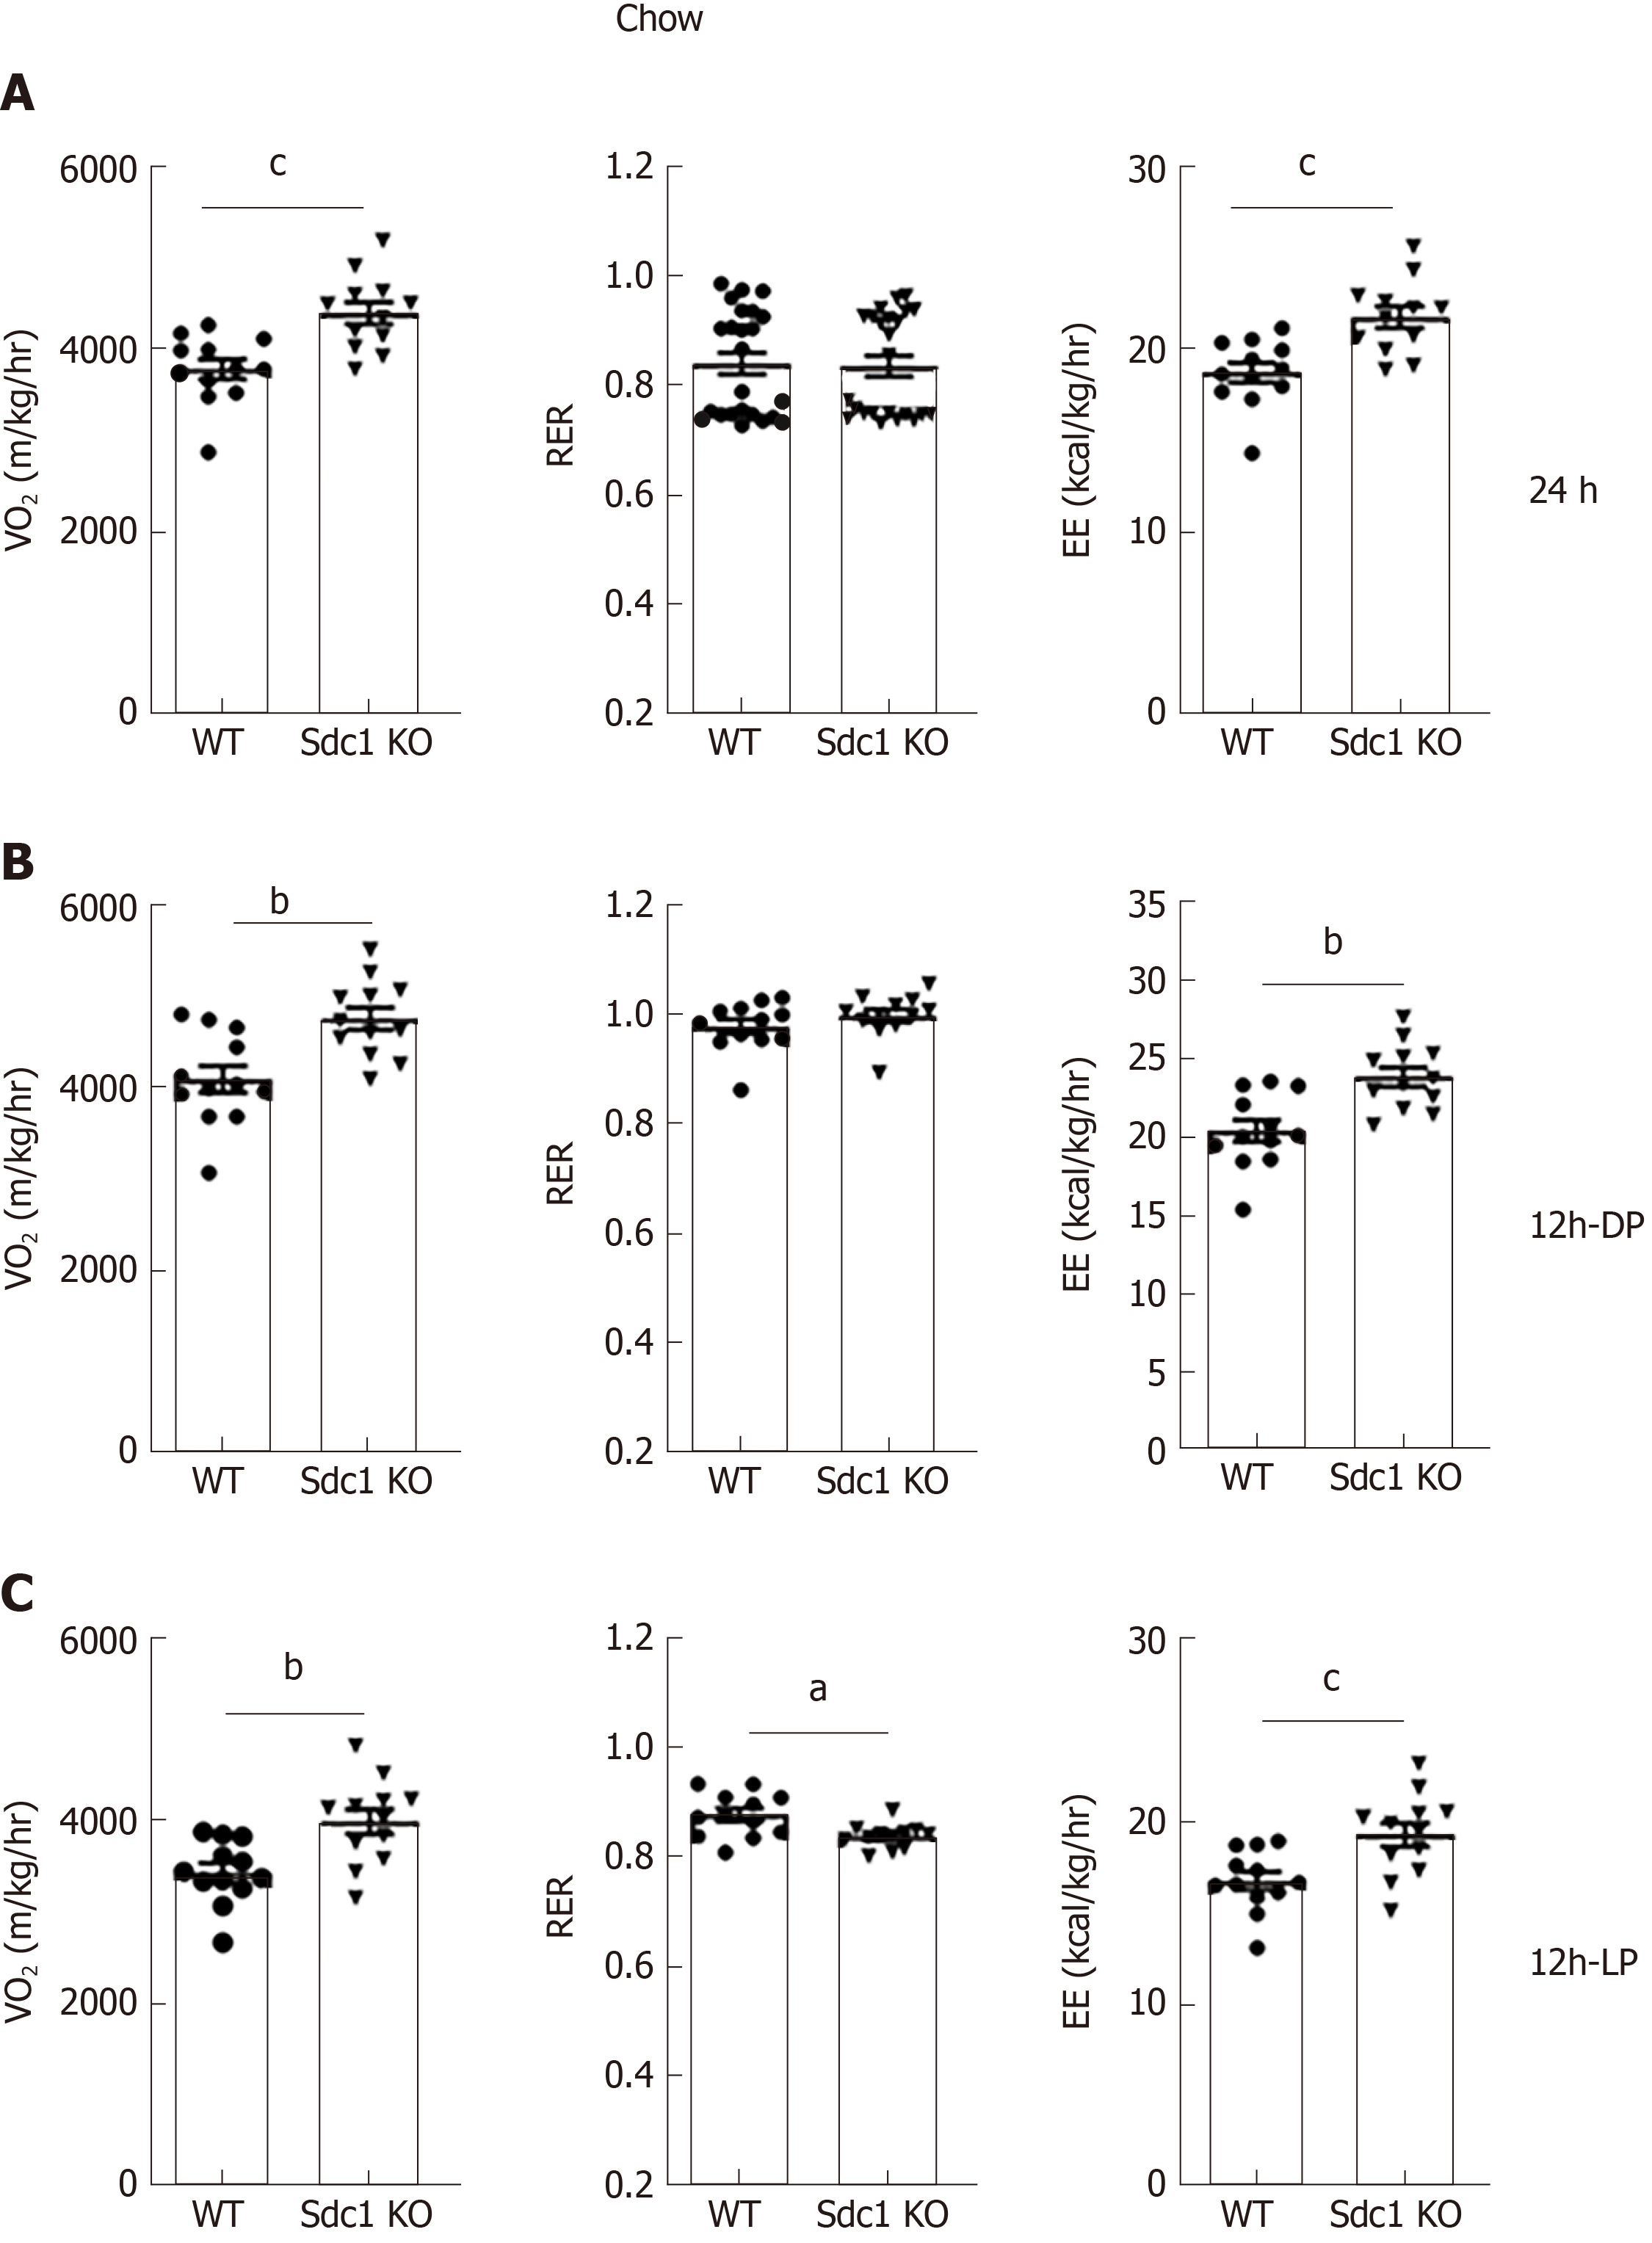
Figure 3 O2 consumption and energy expenditure throughout light and dark phase in syndecan-1 knockout and wild type mice on chow-diet.
Mice on the chow and high-fat diet were kept over 8 wk and then indirect calorimetry was performed using the Oxymax/CLAMS system. Each day O2 consumption (VO2) and energy expenditure was monitored in individual 8-wk-old mice of each genotypes. A: Measurements were performed over 4 consecutive days following a 24-h acclimation period and are shown as total energy expenditure and VO2; B: Respiratory exchange ratio and VO2 is presented as the average for the dark; C: Light phases. Data represents mean ± SE of total 12 animals of each genotype. Statistical analysis was performed using the two-tailed student’s t-test. cP < 0.001, bP < 0.01, aP < 0.05. Sdc1 KO: Sdc1 knockout; WT: Wild type.
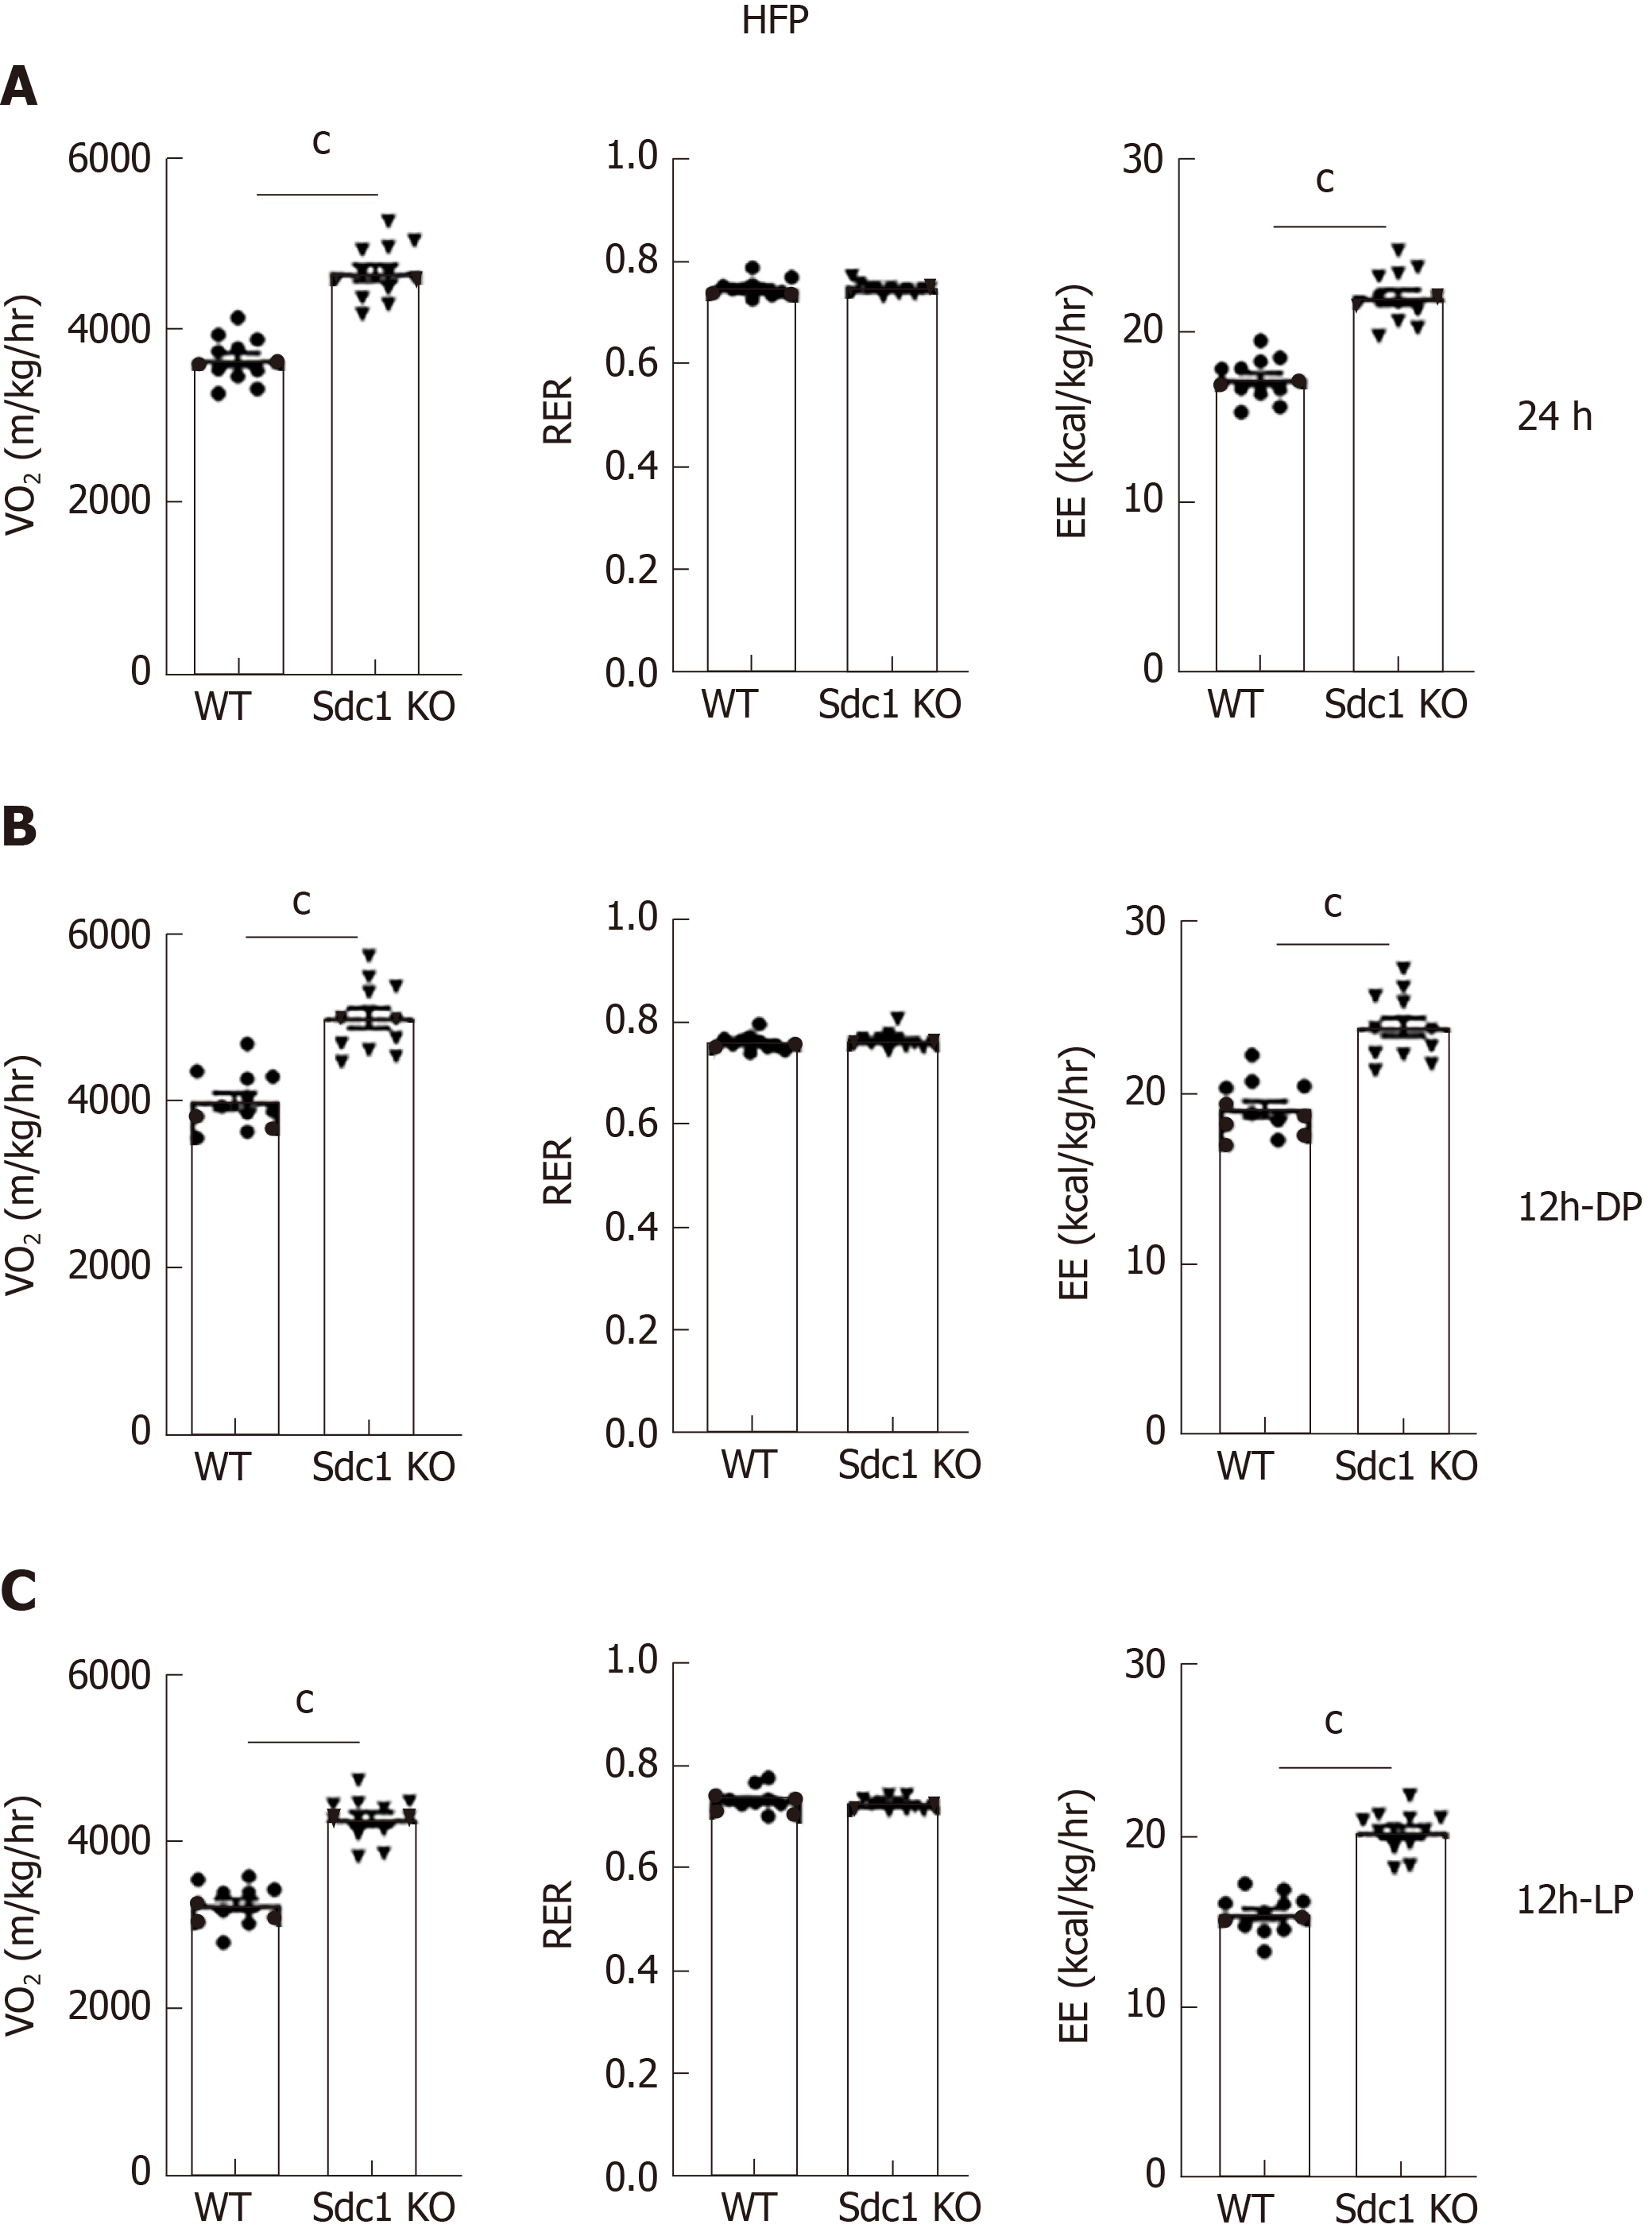
Figure 4 O2 consumption and energy expenditure throughout light in syndecan-1 knockout and wild type mice on high-fat diet.
Like chow-diet, mice were fed with high-fat diet and all parameters were monitored as previously. Data represents mean ± SE of total 12 animals of each genotype. Statistical analysis was performed using the two-tailed student’s t-test. cP < 0.001. Sdc1 KO: Sdc1 knockout; HFD: High-fat diet; WT: Wild type.
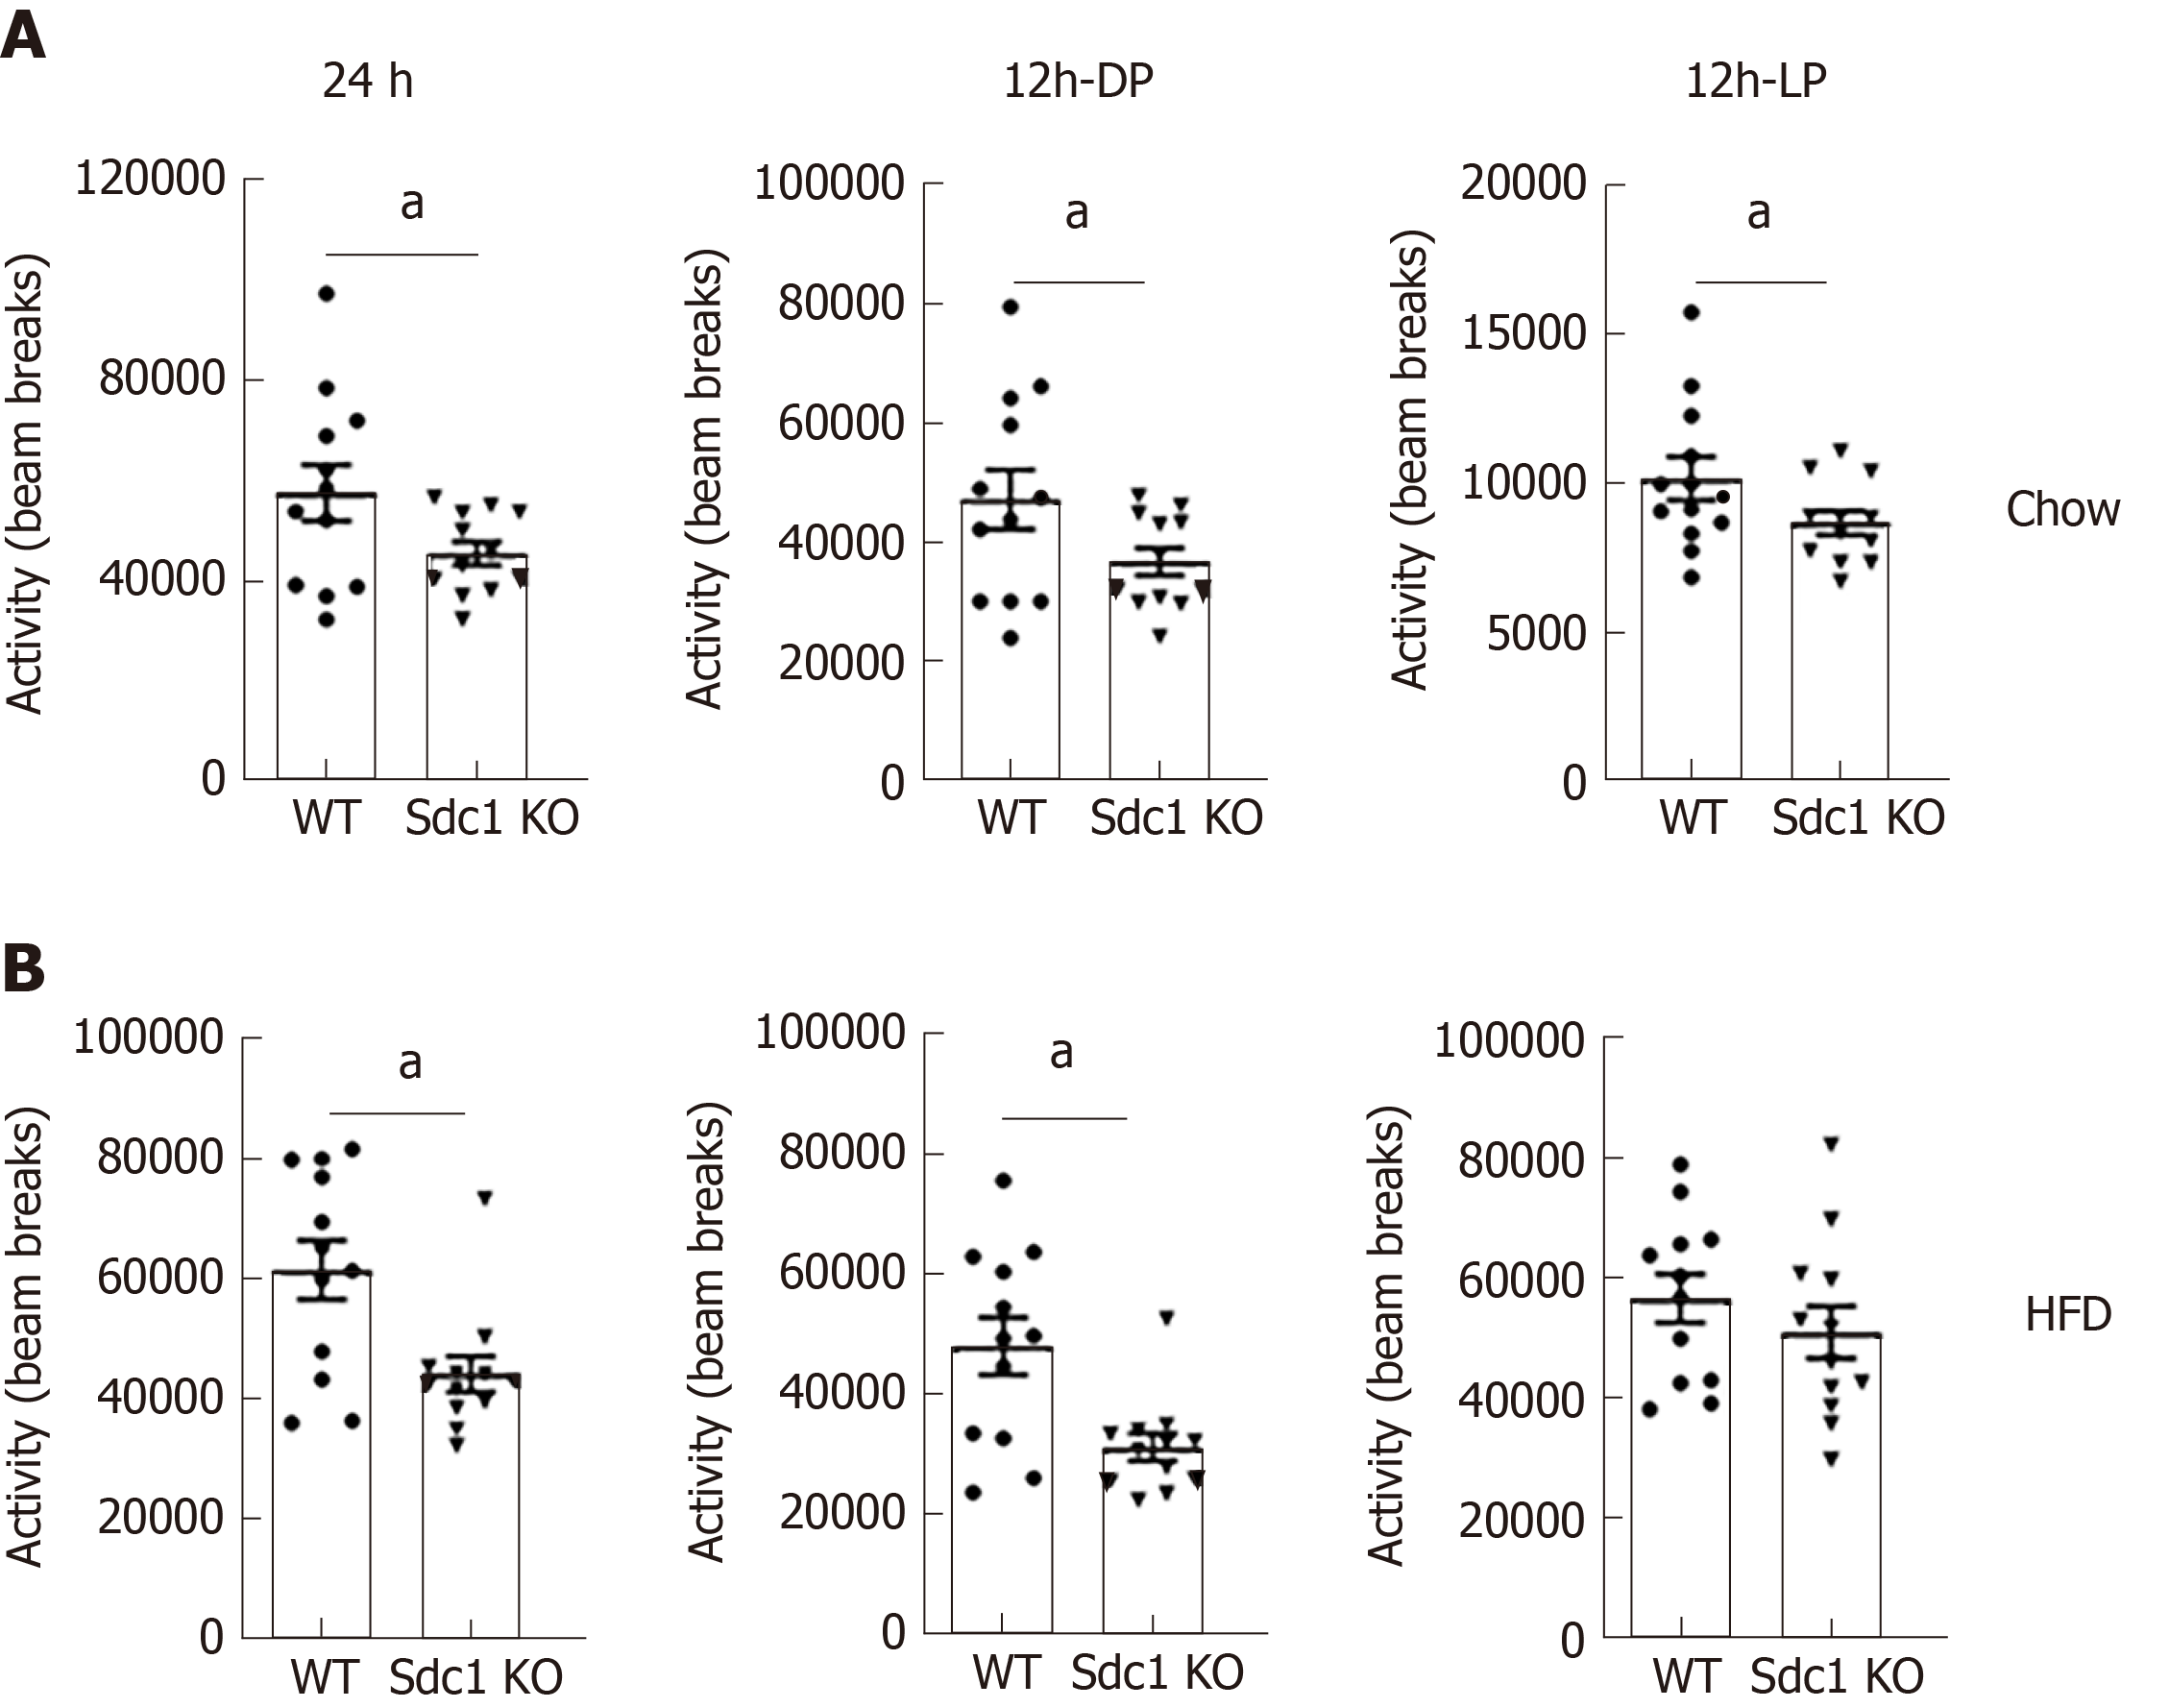
Figure 5 Syndecan-1 knockout mice have decreased locomotor activity.
Mice were fed with chow or high-fat diet as described previously and physical activity (x-axis infrared beam array) was measured using the Oxymax/CLAMS system. A: The data were reported every 25 min throughout the studies, and are presented as 24-h sums; B: Sums for the 12-h dark; C: Light phases. Data represents mean ± SE of total 12 animals of each genotype. Statistical analysis was performed using the two-tailed student’s t-test. aP < 0.05. Sdc1 KO: Sdc1 knockout; HFD: High-fat diet; WT: Wild type.
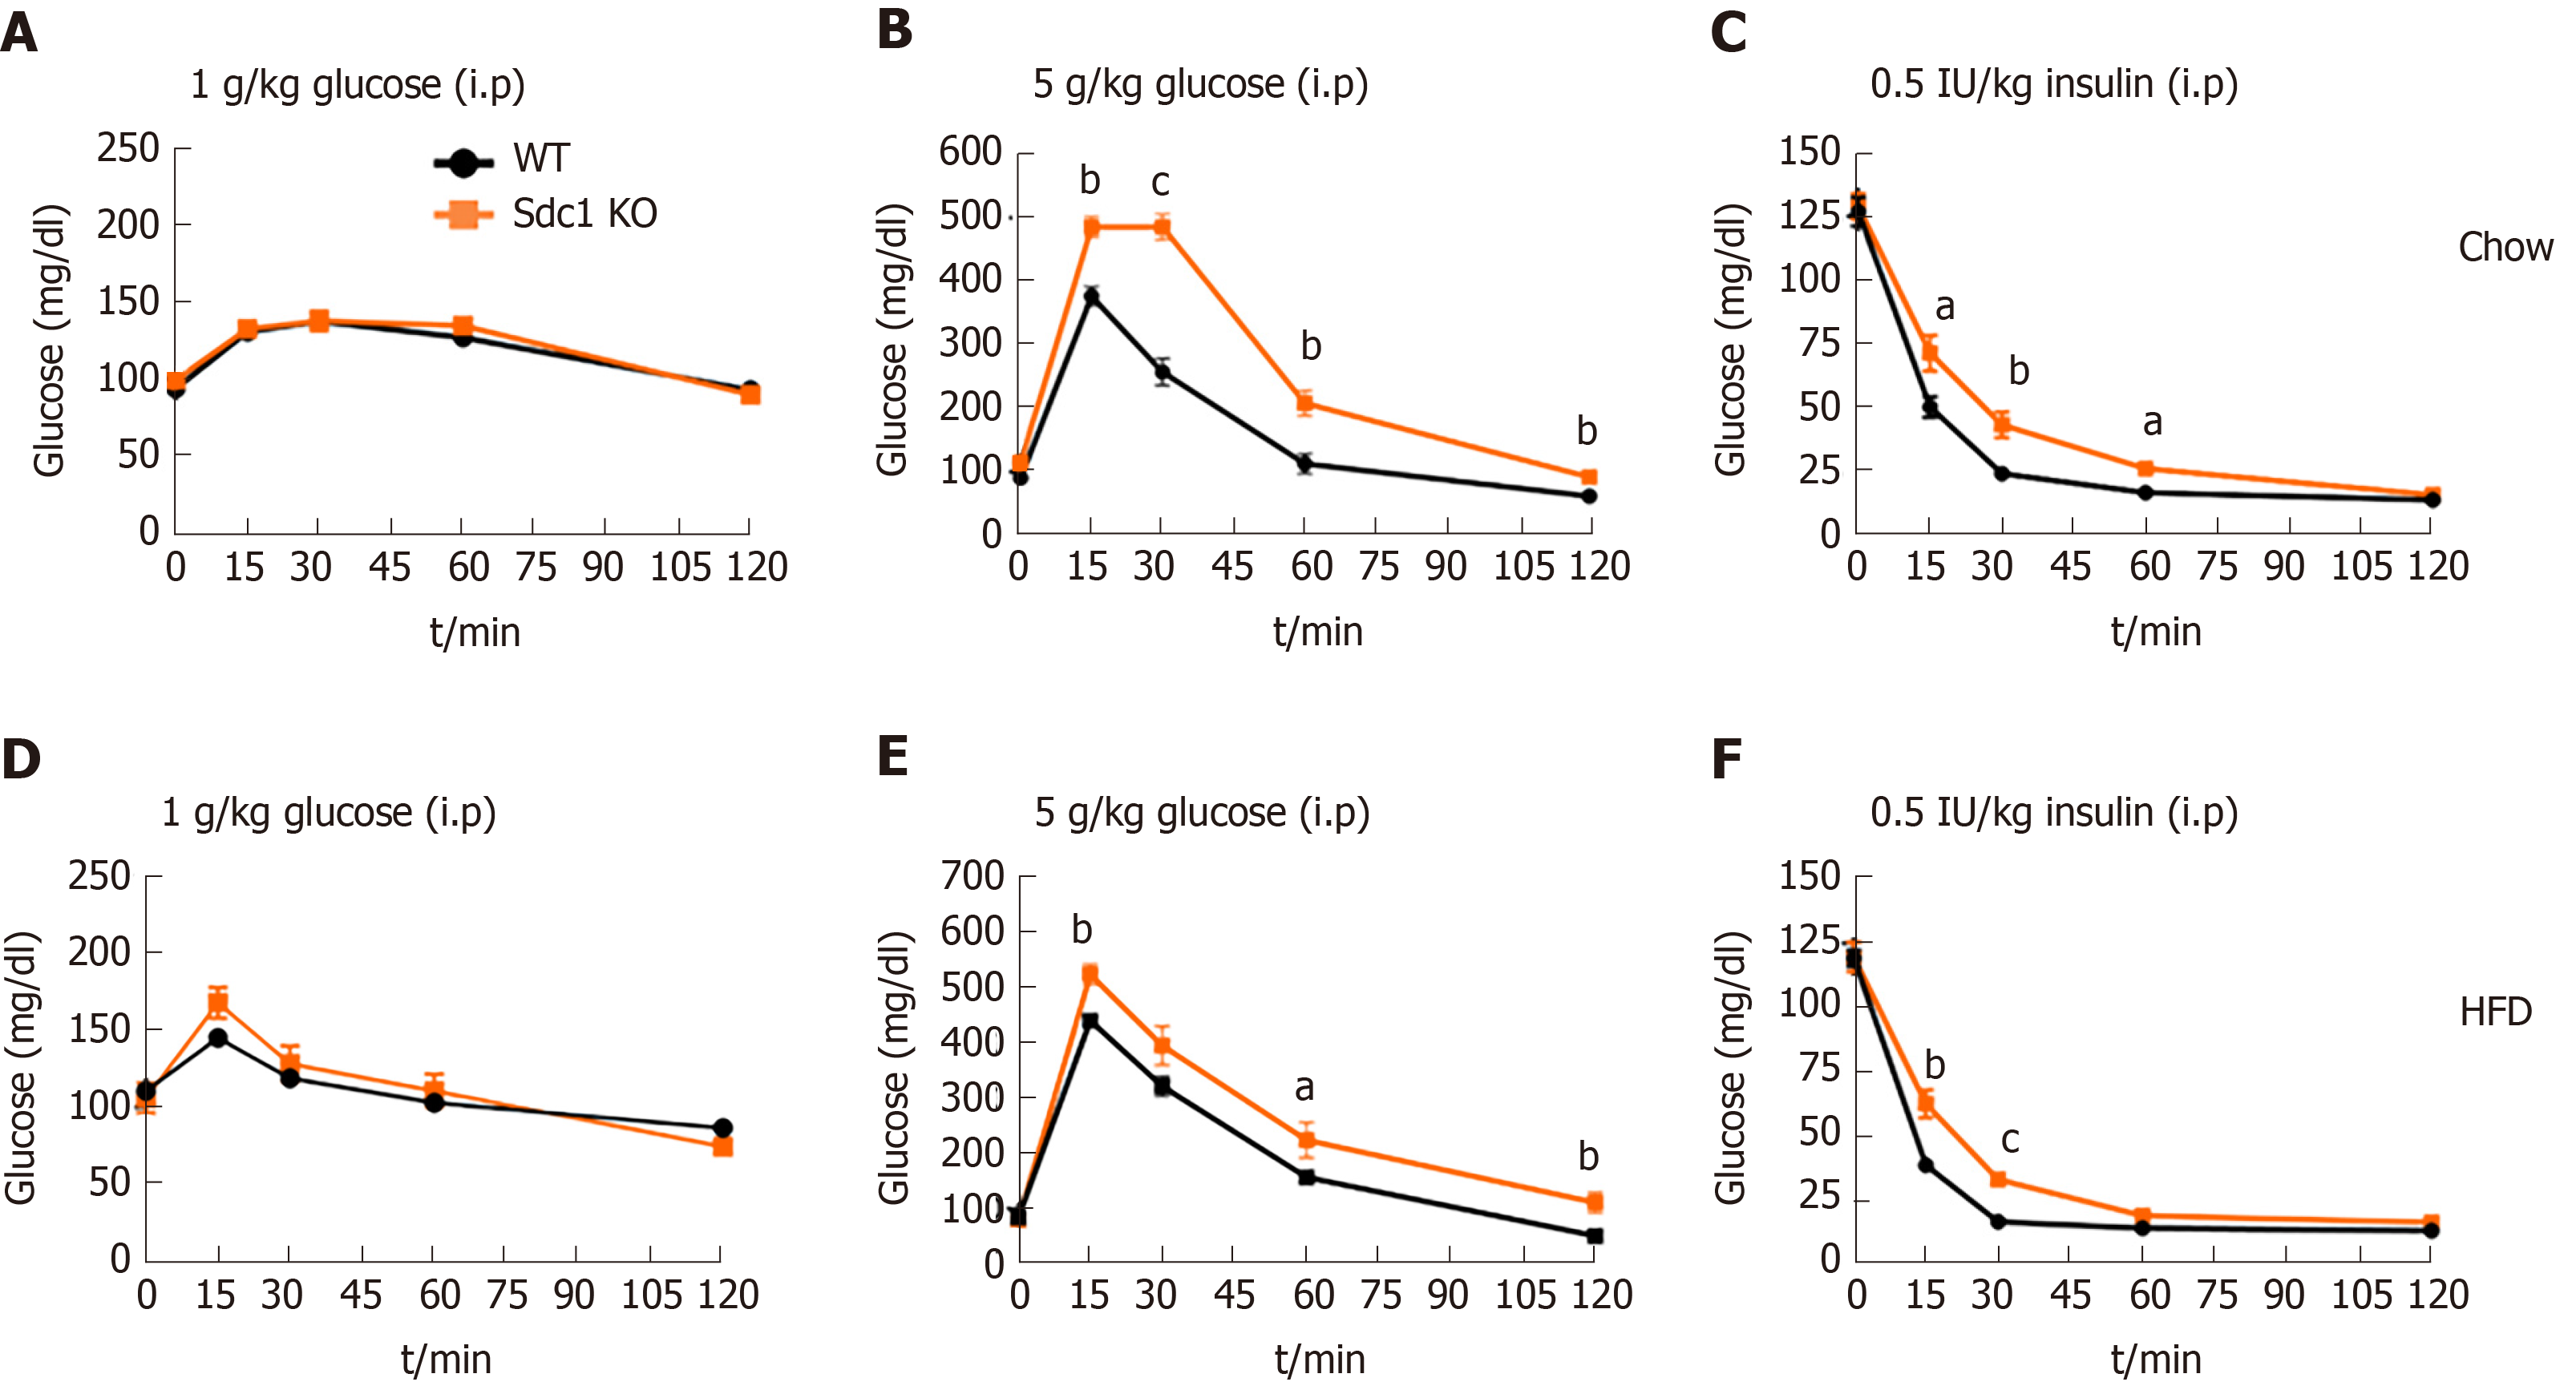
Figure 6 Glucose tolerance test and insulin tolerance test on chow and high-fat diet.
A: Graph shows glucose tolerance pattern in Sdc1 knockout mice and wild type mice, when fed with chow-diet; B: High-fat diet up to 8 wks; C: Insulin tolerance test pattern when mice were fed with chow; D: High-fat diet. Graphs show cumulative data two independent experiments of total 24 female BALB/c mice (mean ± SE). Unpaired t test (Two-tailed); cP < 0.001, bP < 0.01, aP < 0.05. Sdc1 KO: Sdc1 knockout; HFD: High-fat diet; WT: Wild type.
- Citation: Jaiswal AK, Sadasivam M, Aja S, Hamad ARA. Lack of Syndecan-1 produces significant alterations in whole-body composition, metabolism and glucose homeostasis in mice. World J Diabetes 2020; 11(4): 126-136
- URL: https://www.wjgnet.com/1948-9358/full/v11/i4/126.htm
- DOI: https://dx.doi.org/10.4239/wjd.v11.i4.126


