Copyright
©The Author(s) 2020.
World J Diabetes. Mar 15, 2020; 11(3): 52-65
Published online Mar 15, 2020. doi: 10.4239/wjd.v11.i3.52
Published online Mar 15, 2020. doi: 10.4239/wjd.v11.i3.52
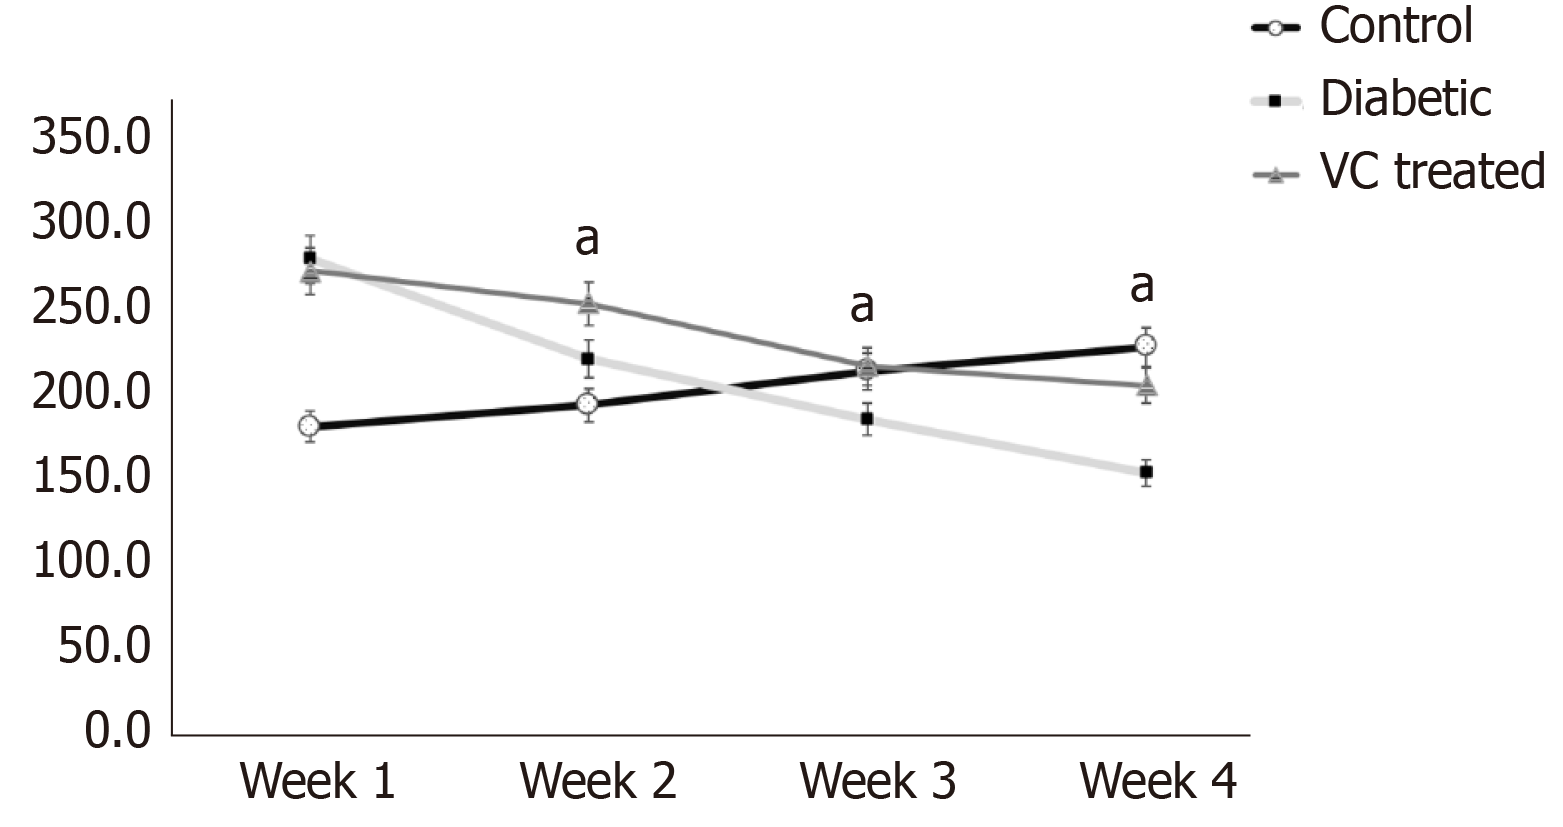
Figure 1 Body weight of diabetic and vitamin C treated rats.
Results are presented as mean ± SE, n = 10. aP < 0.001, significantly different from control. VC: Vitamin C treated.
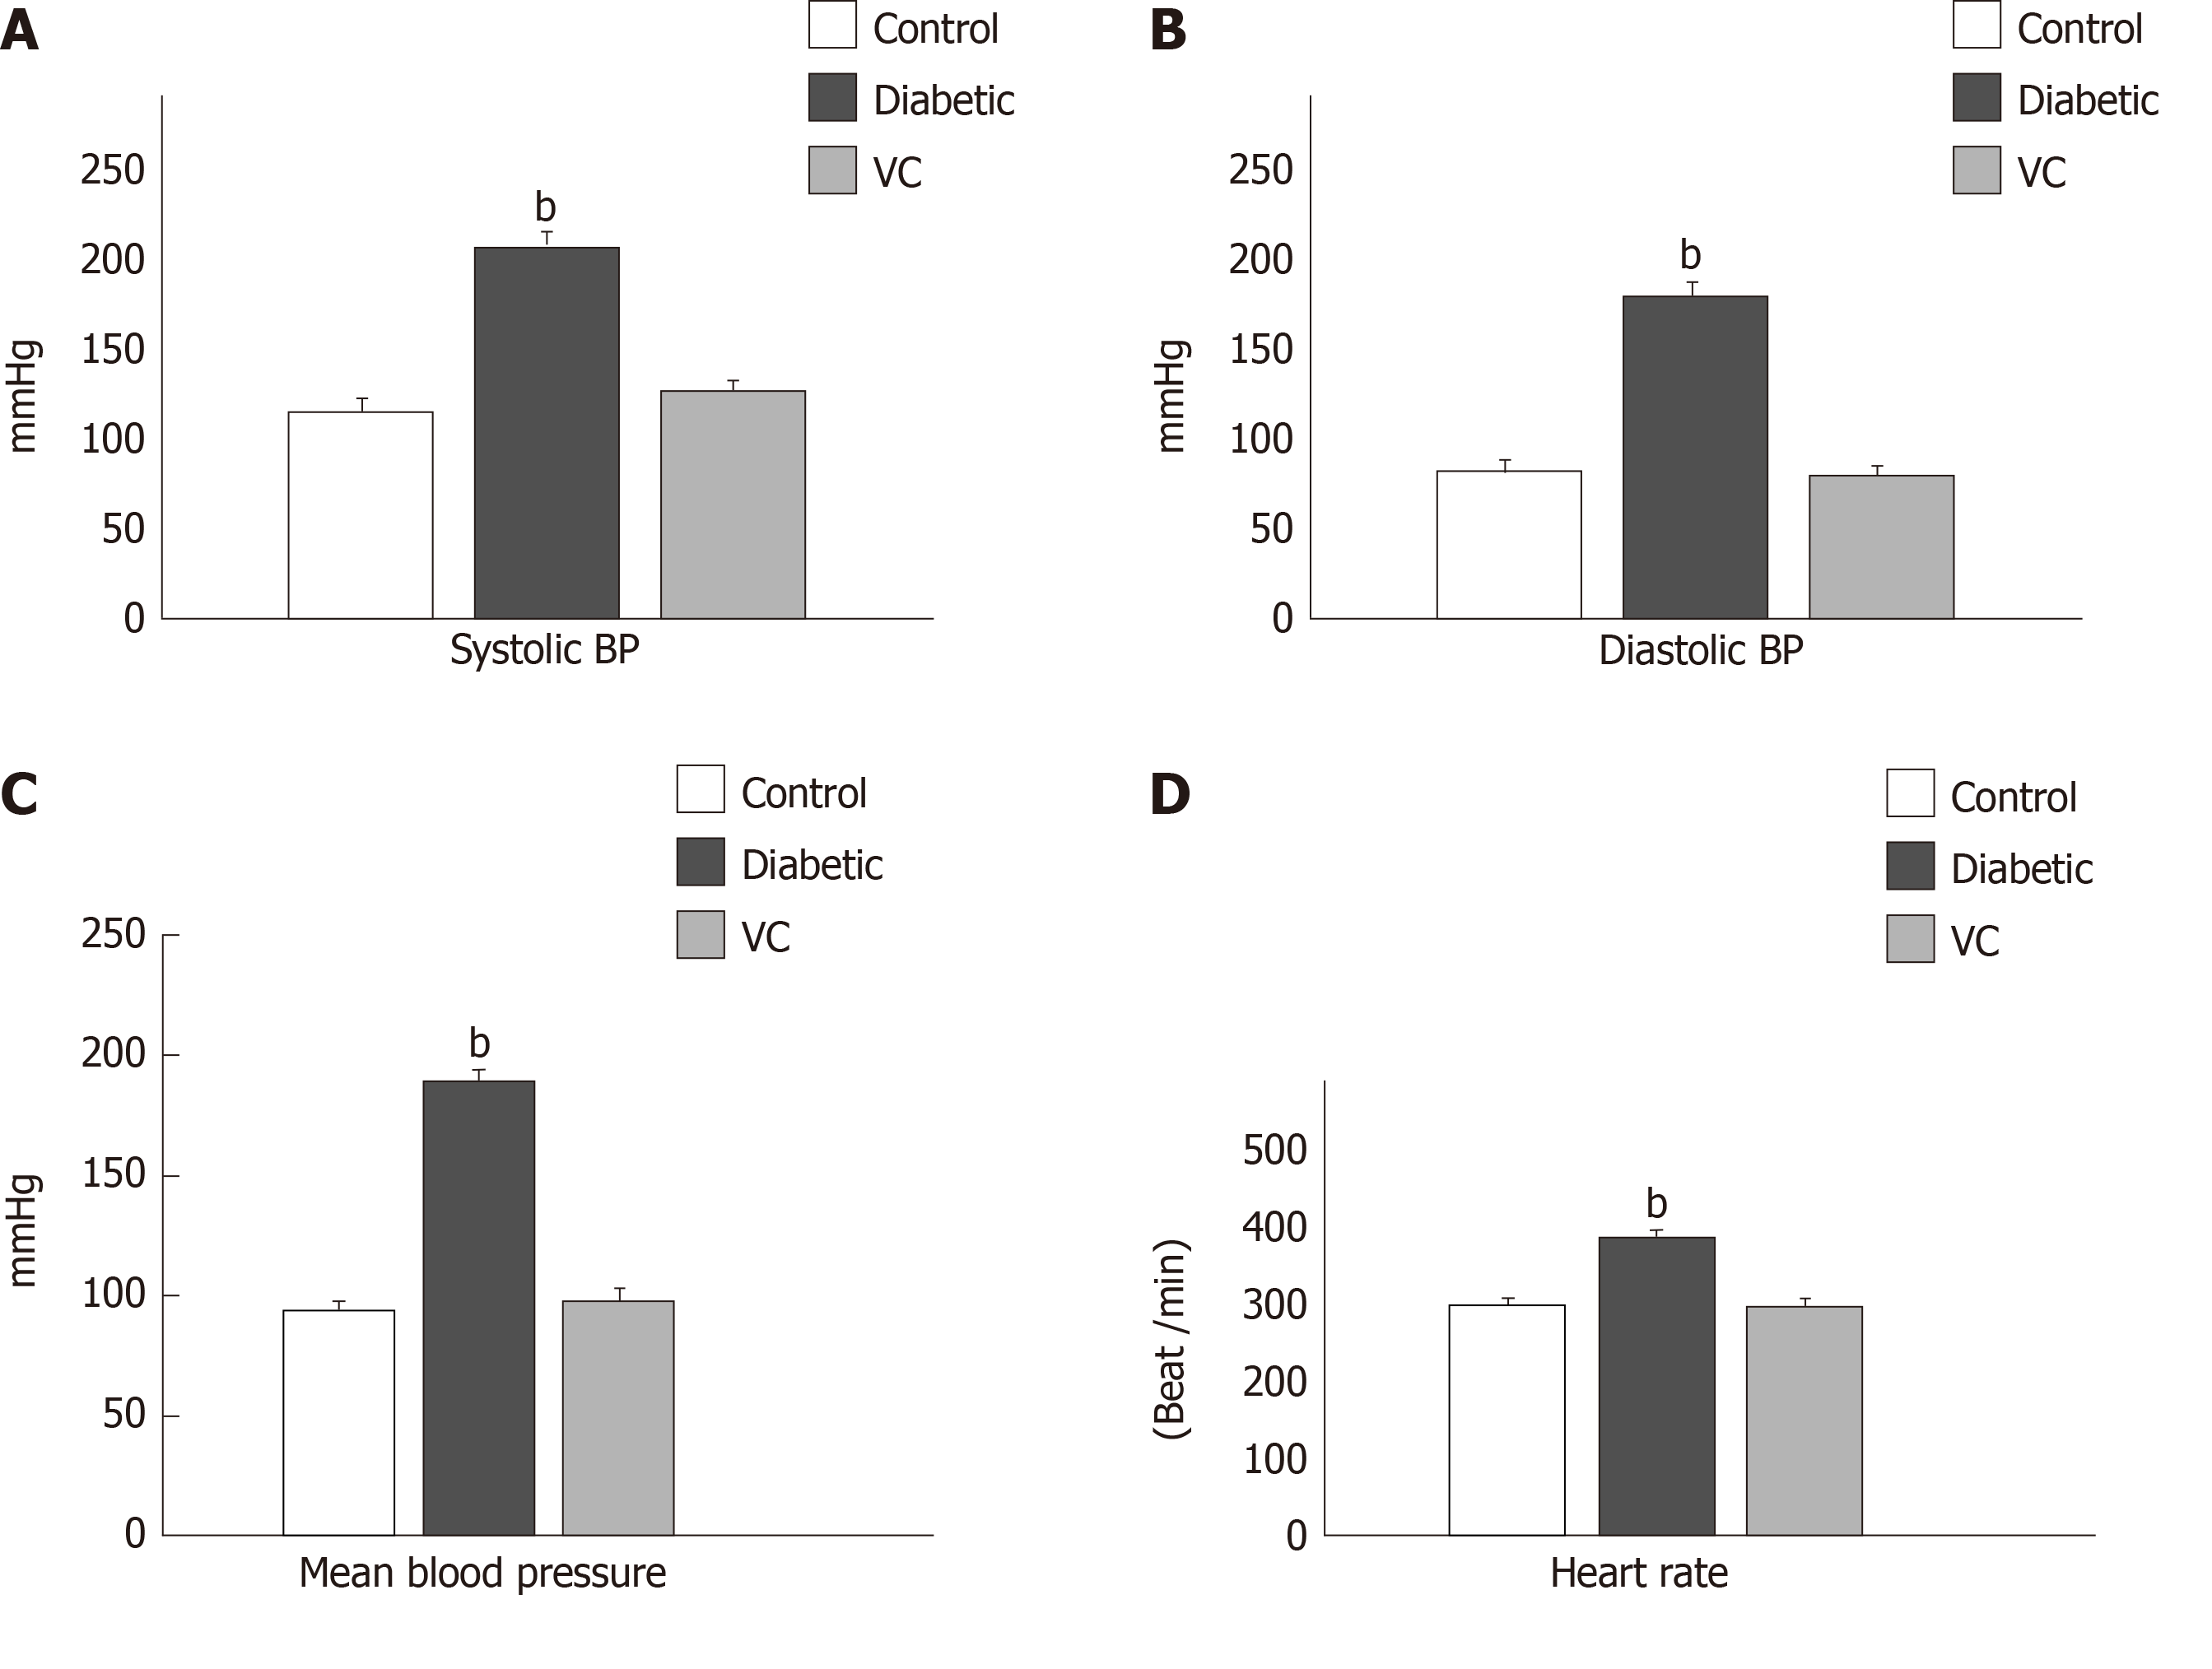
Figure 2 Cardiovascular parameters of diabetic rats after vitamin C treatment.
A: Systolic blood pressure; B: Diastolic blood pressure; C: Mean blood pressure; D: Heart rate. Results are presented as mean ± SE, n = 10; bP < 0.01, significantly different from control.
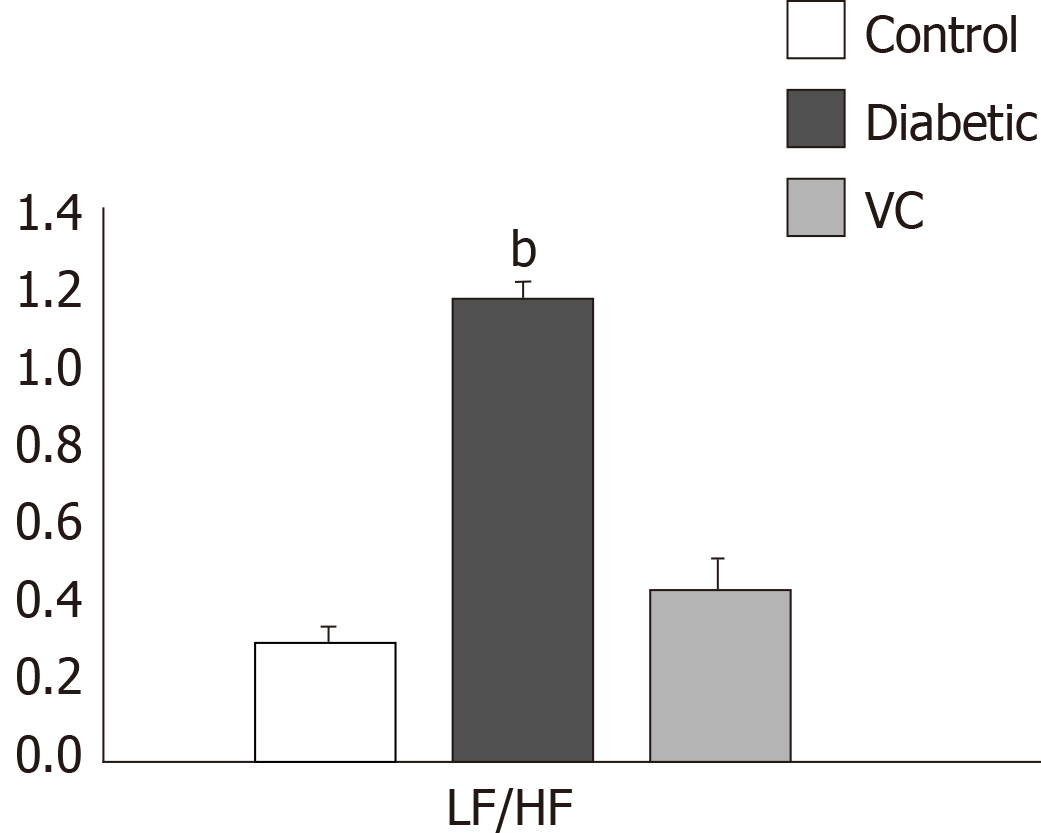
Figure 3 Sympathovagal balance of diabetic and vitamin C treated rats.
Results are presented as mean ± SE, n = 10; bP < 0.001 significantly different from control. LF: Low frequency; HF: High frequency.
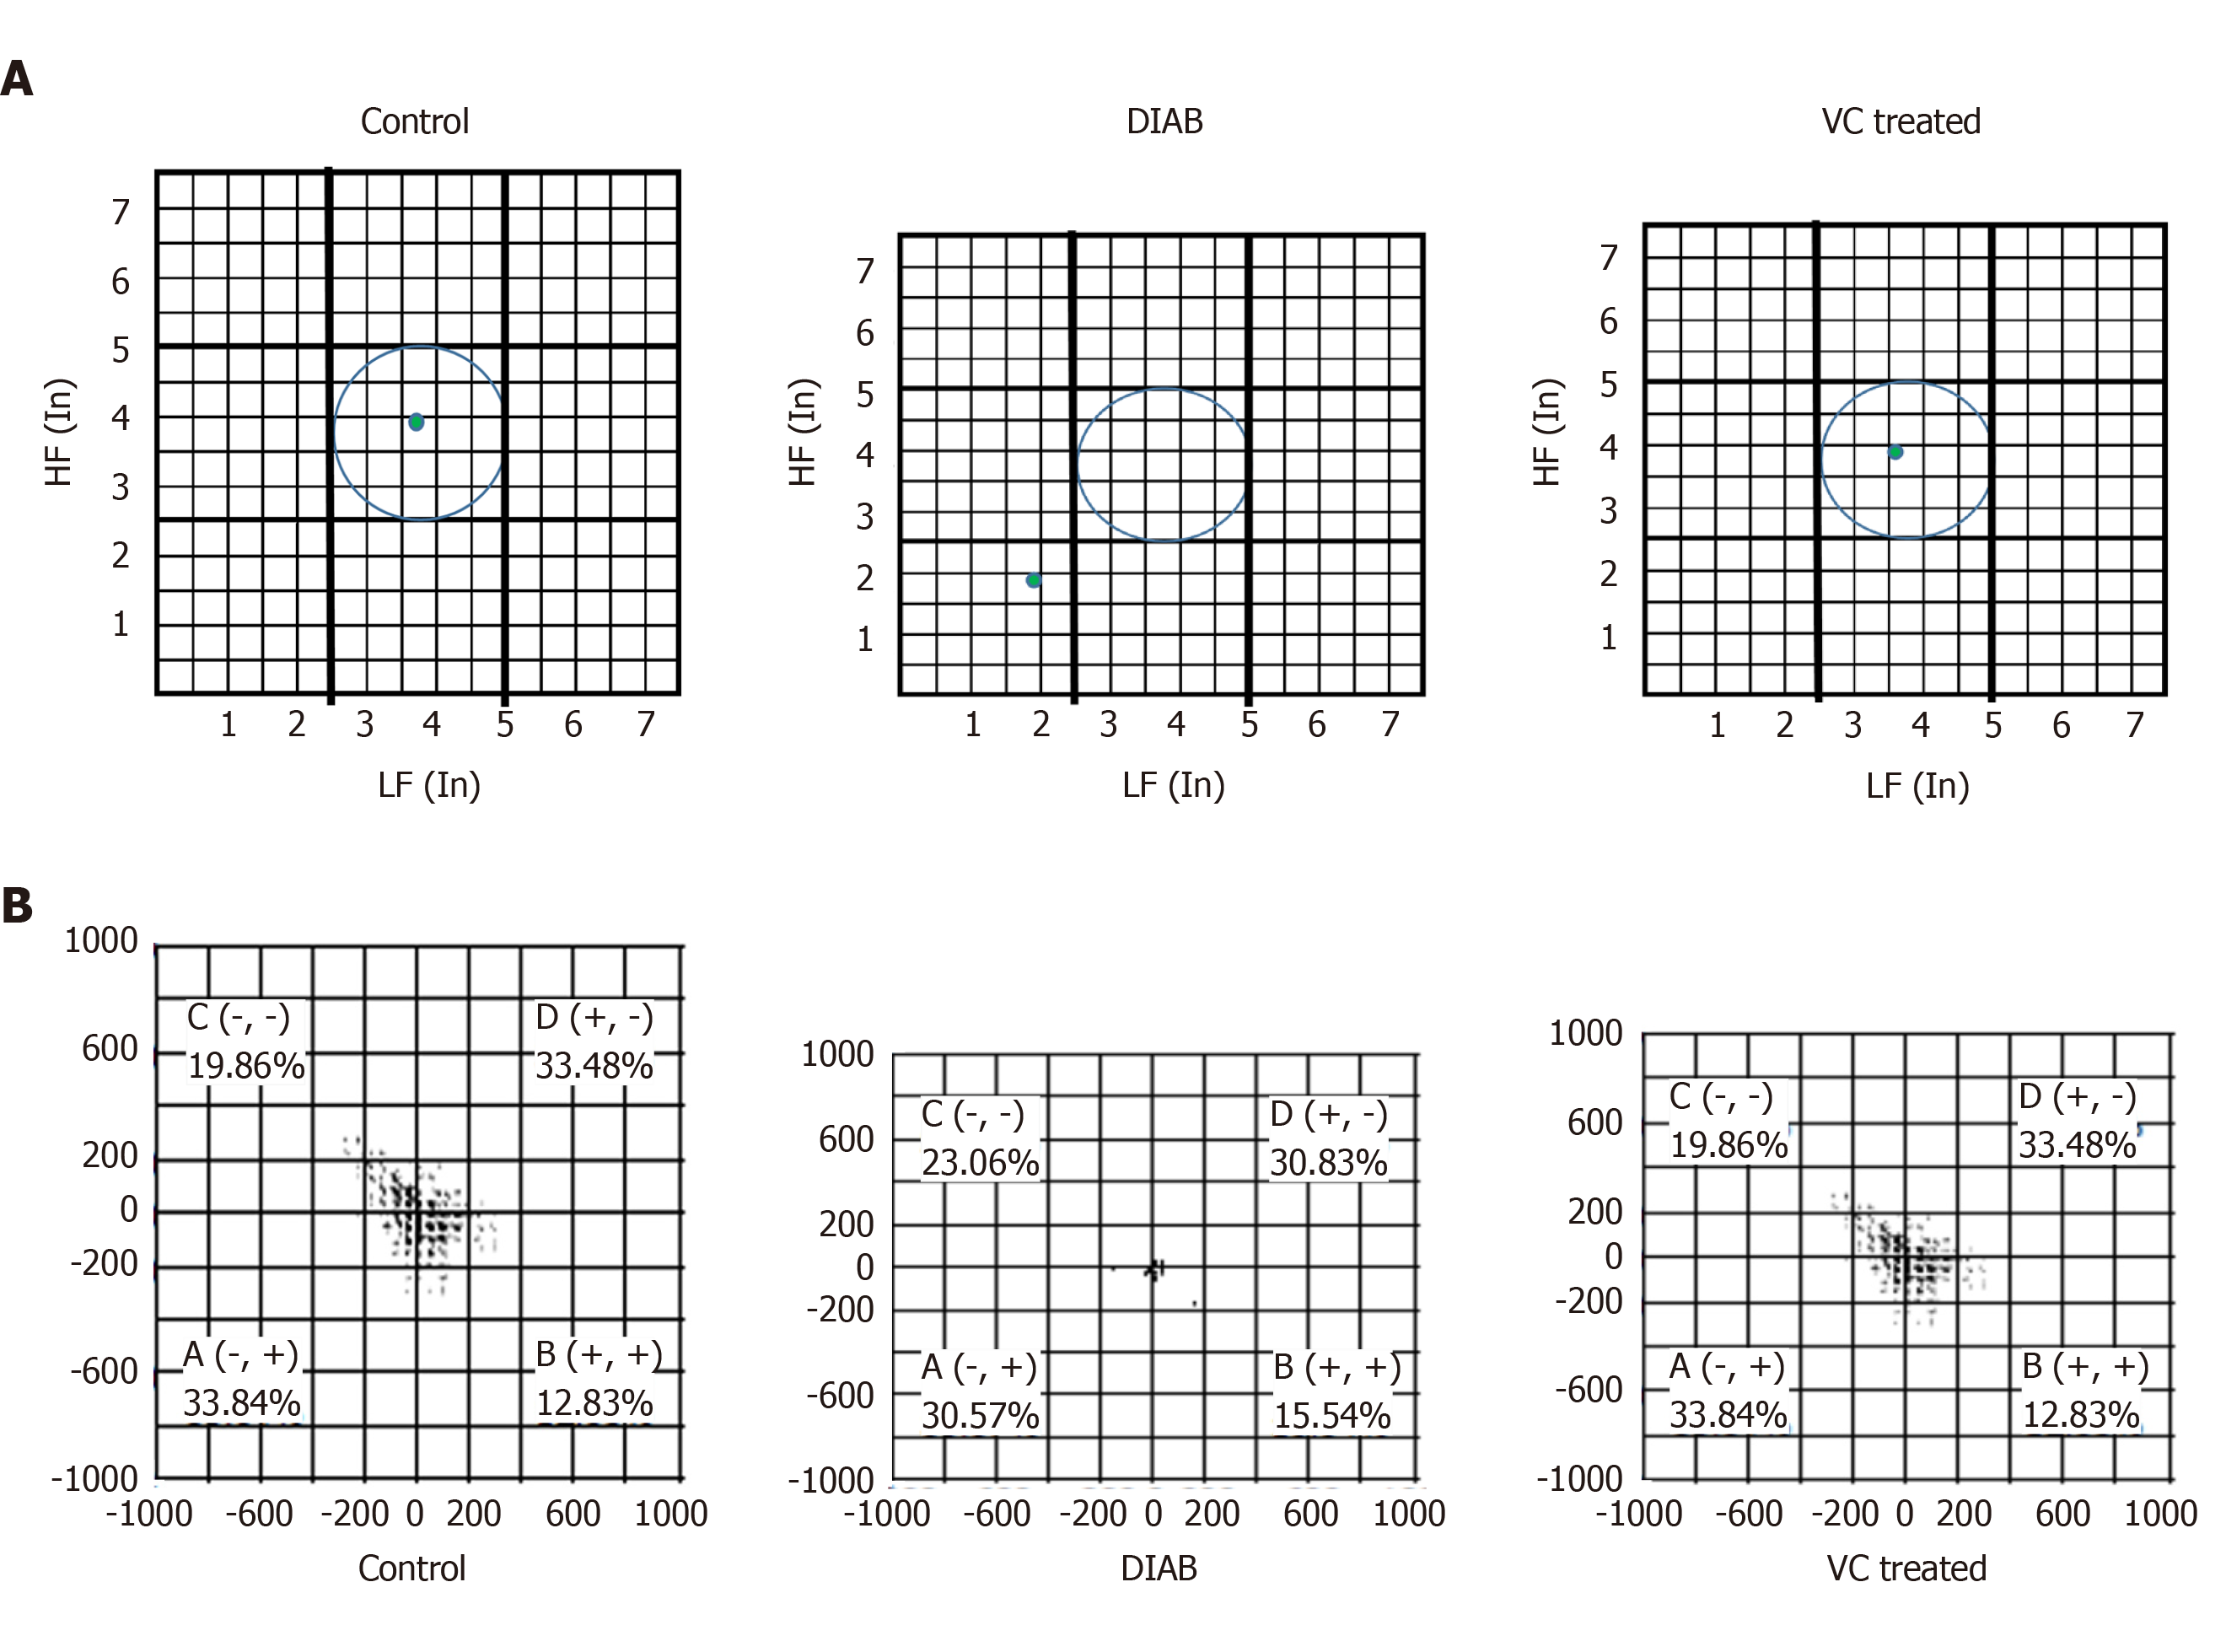
Figure 4 Autonomic imbalance was observed in diabetic rats.
A: Autonomic balance diagram of diabetic rats after vitamin C treatment; B: Poincare plot of diabetic and vitamin C treated rats. DIAB: Diabetic; VC: Vitamin C; LF: Low frequency; HF: High frequency.
Figure 5 Photomicrograph and immunohistochemistry profile of tyrosine hydroxylase antibody stained slices of cardiac tissue of diabetic rats after vitamin C treatment.
A: Photomicrograph; B: Immunohistochemistry profile; C: Shows nuclei count per slice. Magnification: x 400.
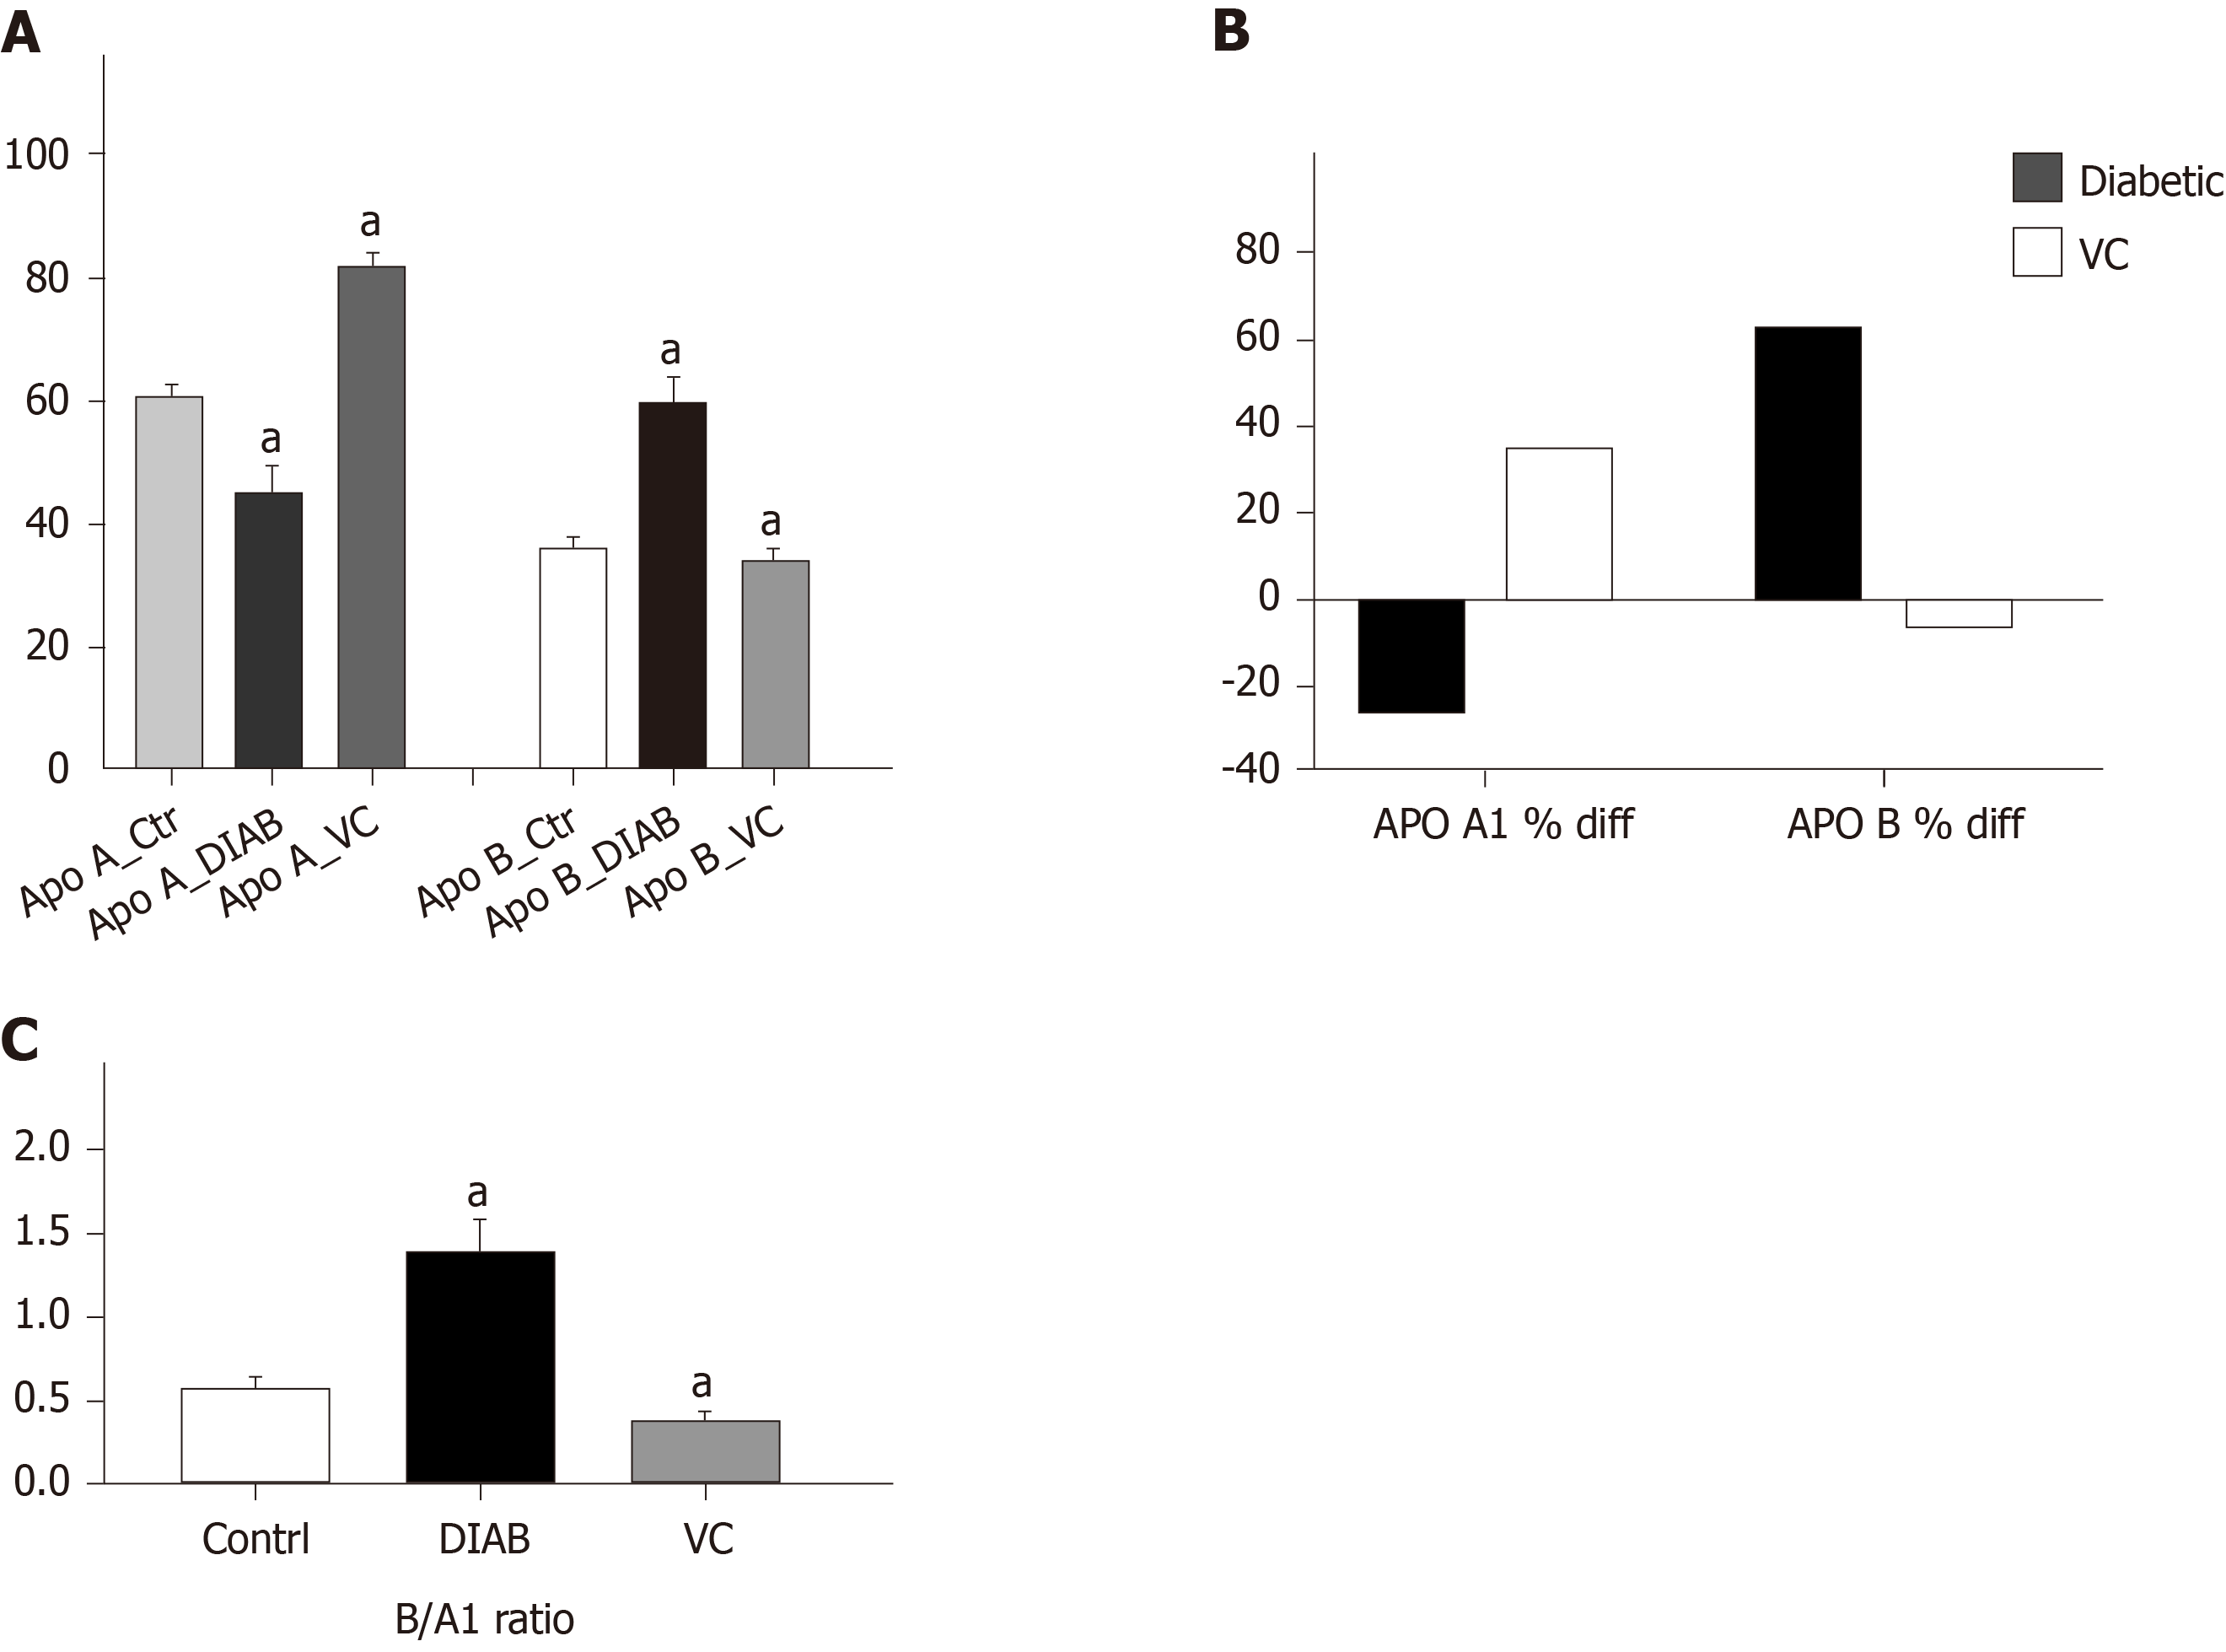
Figure 6 Apolipoprotein A1 and B in serum of diabetic rats after vitamin C treatment.
A: Apolipoproteins B and A1; B: Percentage difference in apolipoprotein level compared with control; C: Apolipoprotein B/A1 ratio. Results are presented as mean ± SE, n = 10. aP < 0.01, significantly different from control.
- Citation: Fabiyi-Edebor TD. Vitamin C ameliorated cardiac autonomic neuropathy in type 2 diabetic rats. World J Diabetes 2020; 11(3): 52-65
- URL: https://www.wjgnet.com/1948-9358/full/v11/i3/52.htm
- DOI: https://dx.doi.org/10.4239/wjd.v11.i3.52


