Copyright
©2014 Baishideng Publishing Group Inc.
World J Gastrointest Oncol. Jul 15, 2014; 6(7): 244-252
Published online Jul 15, 2014. doi: 10.4251/wjgo.v6.i7.244
Published online Jul 15, 2014. doi: 10.4251/wjgo.v6.i7.244
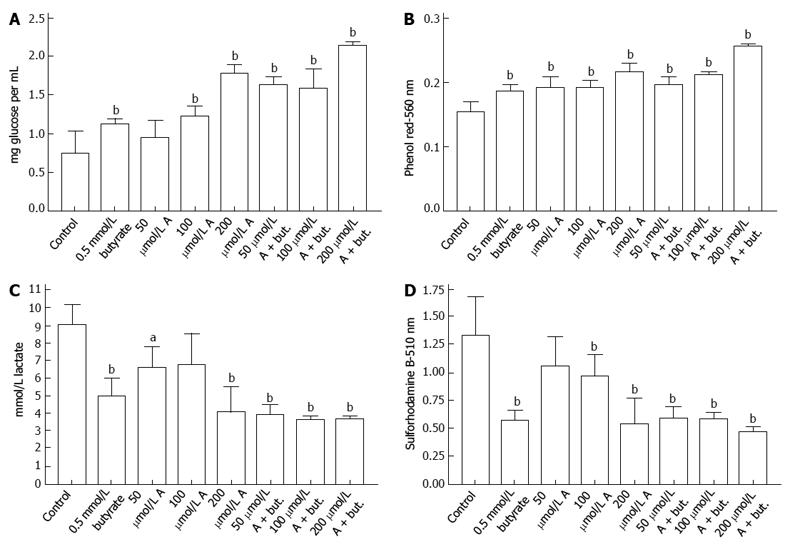
Figure 1 Effects of incubation of HCT116 WT cells for 72 h with butyrate.
A-769662 (A) on glucose concentration of the incubation medium (A), medium pH (B), medium lactate concentration (C), and cell proliferation (D). aP < 0.05, bP < 0.01 vs control group.
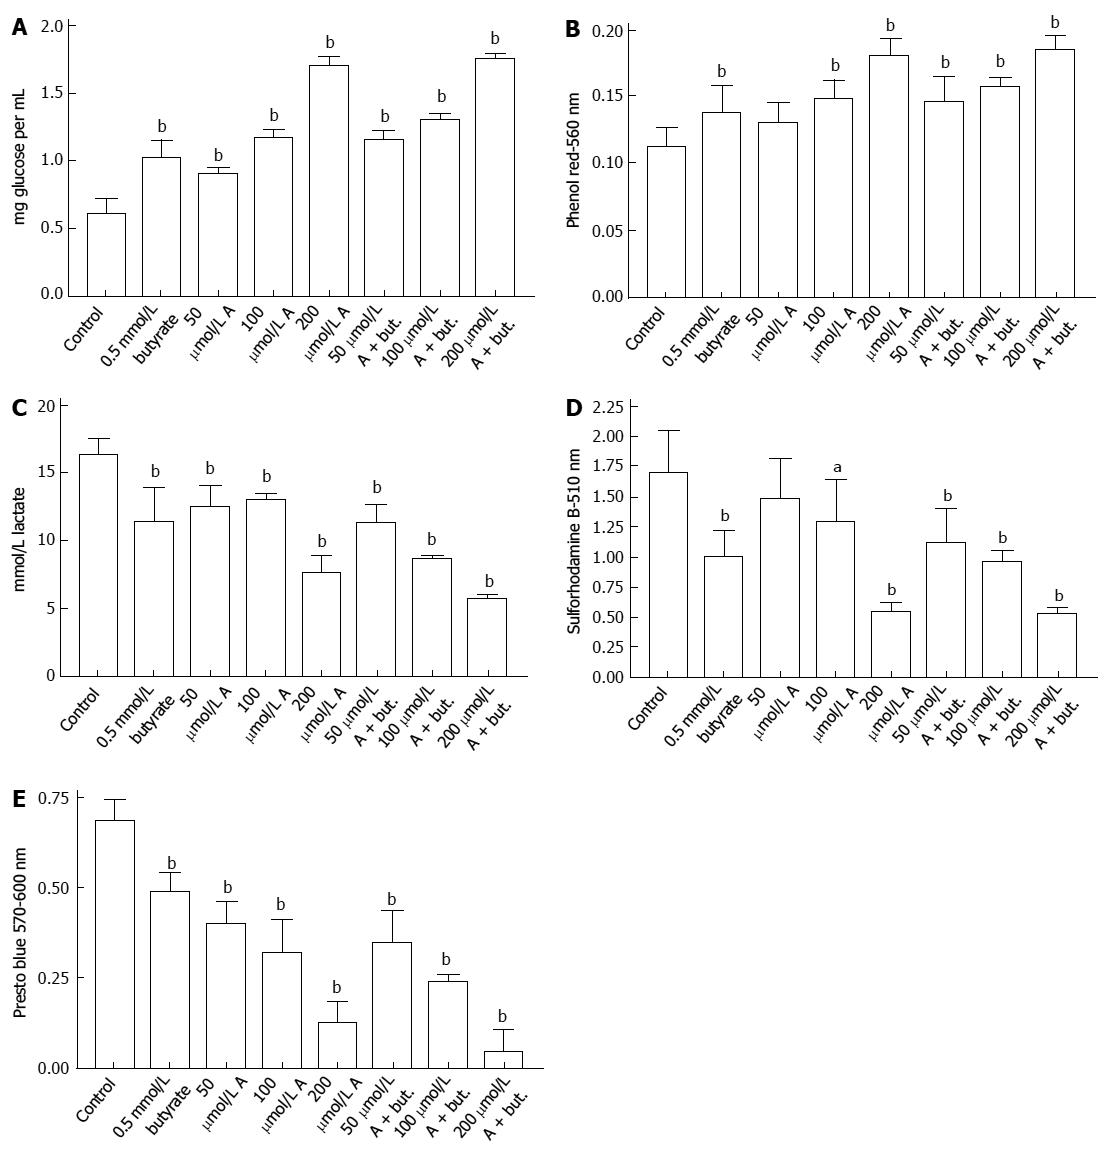
Figure 2 Effects of incubation of HT29 cells for 72 h with butyrate.
A-769662 (A) on medium glucose concentration (A), medium pH (B), medium lactate concentration (C), cell proliferation (D) and reduction of Presto Blue (E). aP < 0.05, bP < 0.01 vs control group.
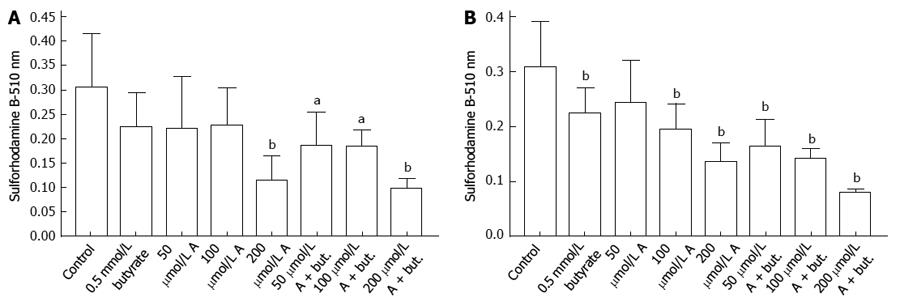
Figure 3 Effects of incubation of Caco-2 cells (A) and SW1116 cells (B) for 72 h with butyrate (but) and A-769662 (A) on cell proliferation.
aP < 0.05, bP < 0.01 vs control group.
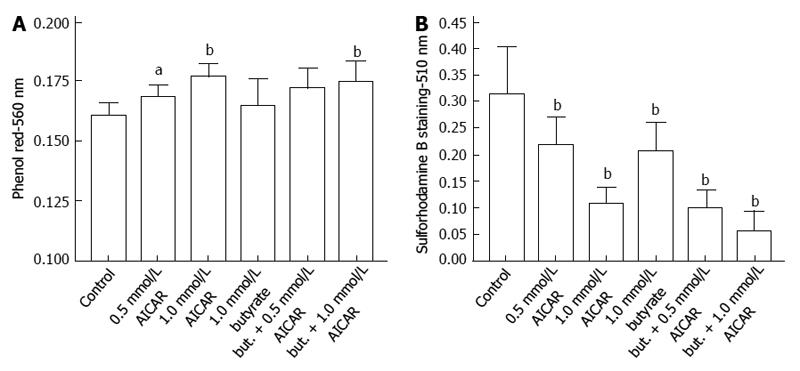
Figure 4 Effects of incubation of Caco-2 cells for 72 h with butyrate (but) and AICAR on medium acidification (A) and cell proliferation (B).
aP < 0.05, bP < 0.01 vs control group.
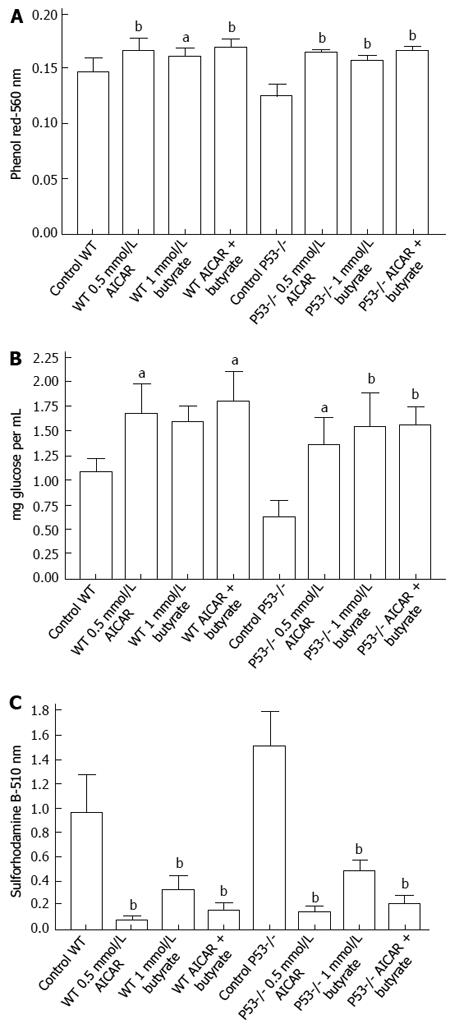
Figure 5 Effects of incubation of HCT116 wild type or p53 null cells.
Effects of incubation of HCT116 wild type or p53 null cells for 72 h with butyrate and AICAR on acidification of the incubation medium (A), medium glucose concentration (B) and cell proliferation (C). aP < 0.05, bP < 0.01 vs control group.
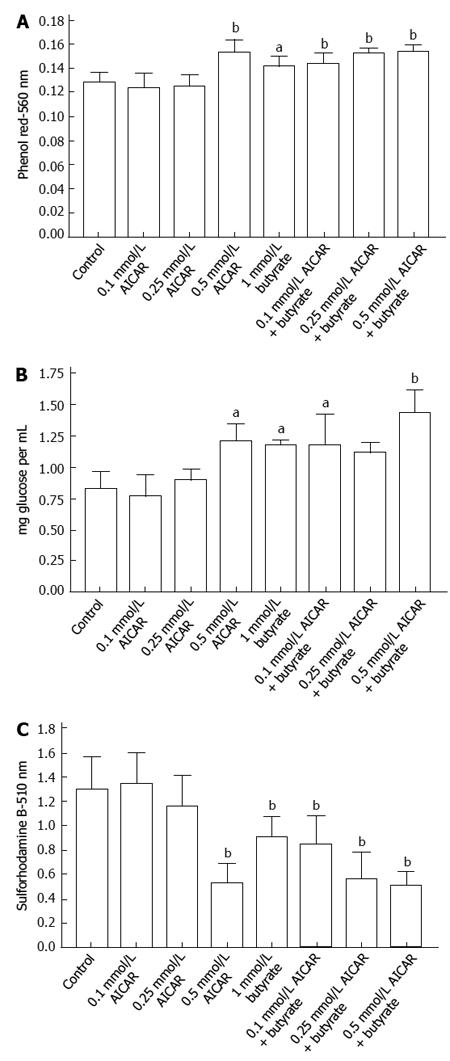
Figure 6 Effects of incubation of HT29 cells.
Effects of incubation of HT29 cells for 72 h with butyrate and AICAR on acidification of the incubation medium (A), medium glucose concentration (B) and cell proliferation (C). aP < 0.05, bP < 0.01 vs control group.
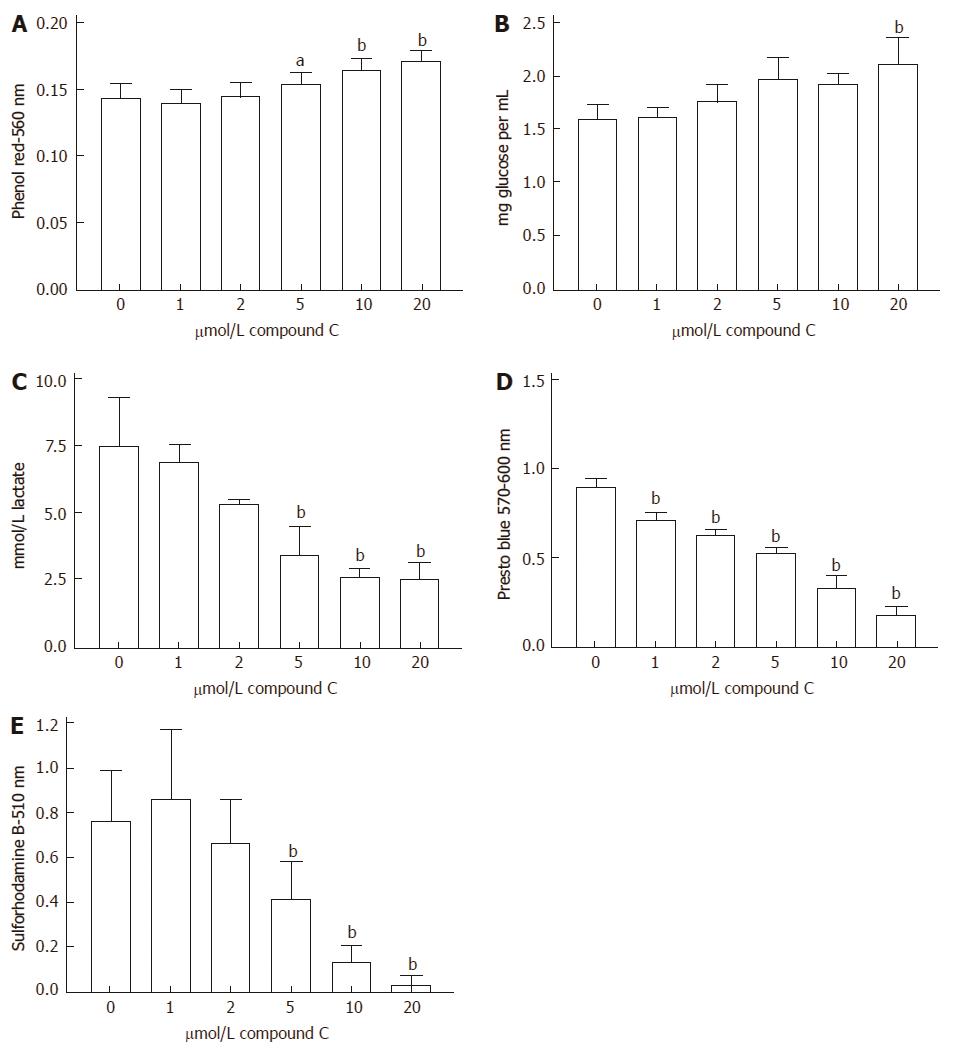
Figure 7 Effects of incubation of HCT116 WT cells.
Effects of incubation of HCT116 WT cells for 72 h with compound C on acidification of the incubation medium (A), glucose concentration of the incubation medium (B), medium lactate concentration (C), reduction of Presto blue (D) and cell proliferation (E). aP < 0.05, bP < 0.01 vs control group.
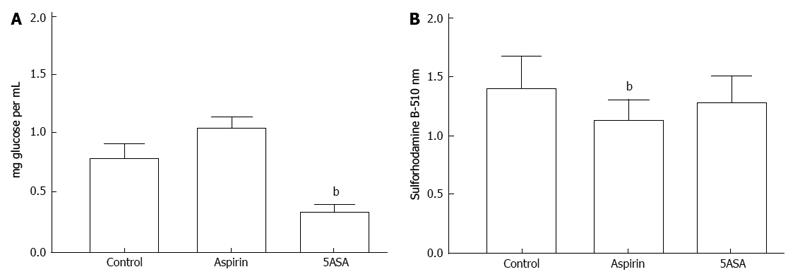
Figure 8 Effect of incubation of HT29 cells.
Effect of incubation of HT29 cells for 72 h with 1 mmol/L acetylsalicylic acid (aspirin) and 1 mmol/L 5-aminosalicylic acid (5ASA) on glucose concentration of the incubation medium (A) and cell proliferation (B). bP < 0.01 vs control group.
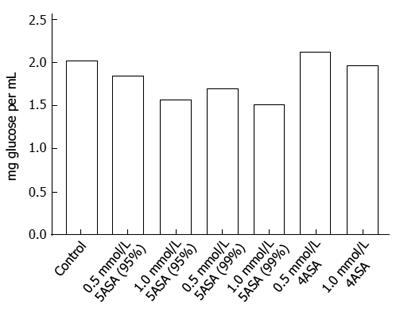
Figure 9 Effect of 5-aminosalicylic acid and 4-aminosalicylic acid.
Effect of 5-aminosalicylic acid (5ASA) and 4-aminosalicylic acid (4ASA) on the assay of glucose in the RPMI 1640 medium that had not been incubated with colon cancer cells.
- Citation: Lea MA, Pourat J, Patel R, desBordes C. Growth inhibition of colon cancer cells by compounds affecting AMPK activity. World J Gastrointest Oncol 2014; 6(7): 244-252
- URL: https://www.wjgnet.com/1948-5204/full/v6/i7/244.htm
- DOI: https://dx.doi.org/10.4251/wjgo.v6.i7.244


