Copyright
©2013 Baishideng Publishing Group Co.
World J Gastrointest Oncol. Jul 15, 2013; 5(7): 115-126
Published online Jul 15, 2013. doi: 10.4251/wjgo.v5.i7.115
Published online Jul 15, 2013. doi: 10.4251/wjgo.v5.i7.115
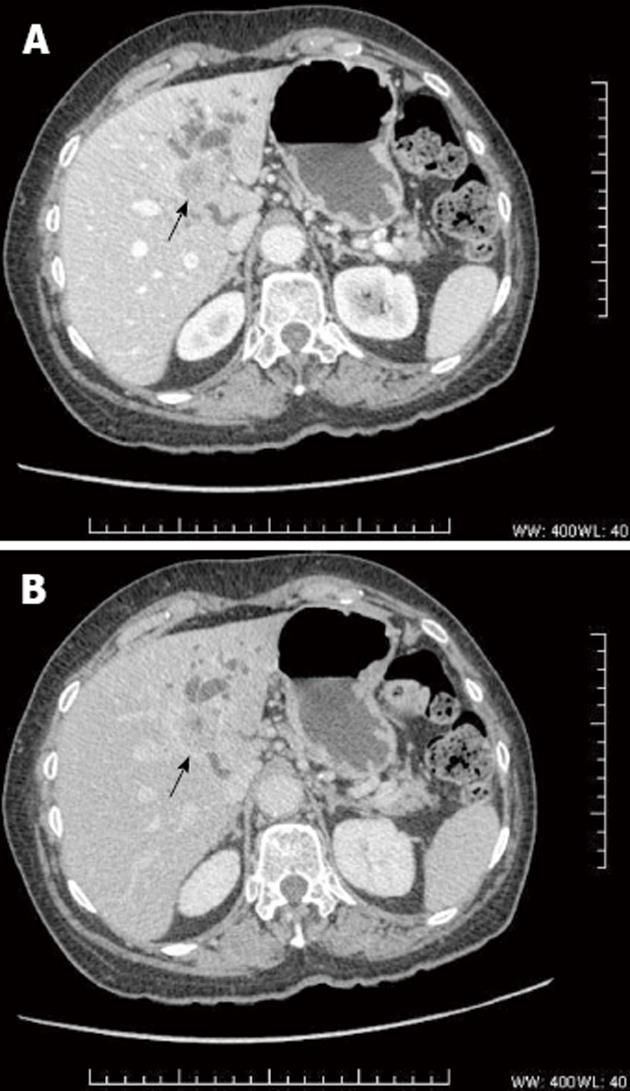
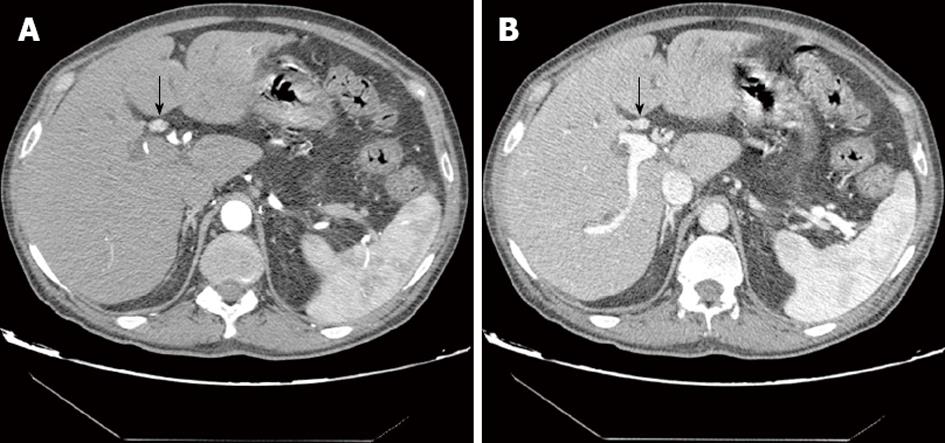
Figure 1 Mass forming cholangiocarcinoma.
Axial computed tomography scan in the portal phase (A) and in delayed phase (B) shows a heterogeneous hypovascular mass (arrow) with rim-like peripheral enhancement. The lesion is associated with ductal infiltration and biliary dilation.
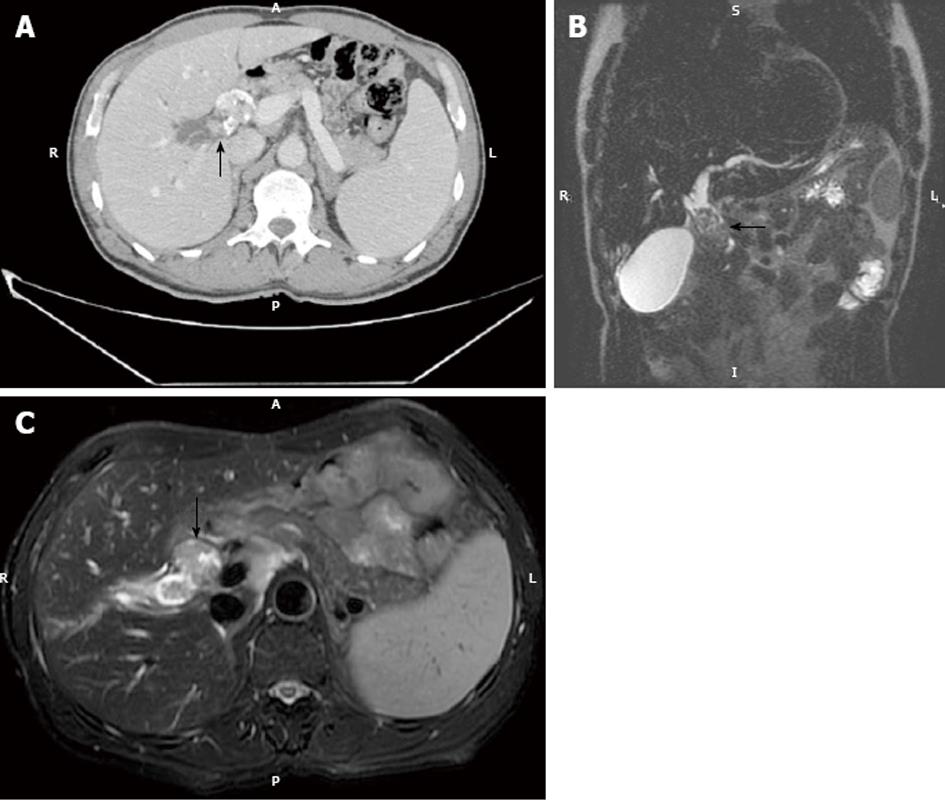
Figure 2 Intraductal growing cholangiocarcinoma.
A: Axial computed tomography in the portal phase in a 52-year-old male shows a heterogeneously enhancing endoluminal lesion with dysmorphic calcifications (arrow). Note biliary dilatation upstream; B: Coronal thin-slab (echo spacing 4.2 ms, effective echo time 183 ms, image matrix 272 x 512, FOV 385 mm) T2-W sequence shows marked dilatation of the common hepatic duct and a hypointense endoluminal mass (arrow); C: Axial thin-slab (echo spacing 4.2 ms, effective echo time 183 ms, image matrix 272 x 512, FOV 385 mm) T2-W sequence shows a hypointense filling defect consistent with polypoid cholangiocarcinoma in the common hepatic duct (arrow).
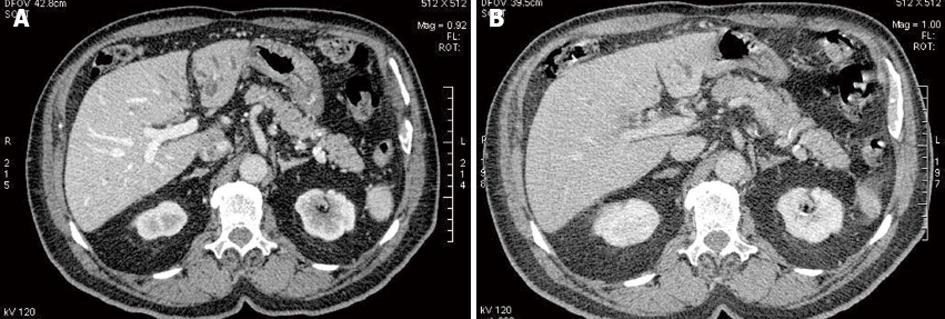
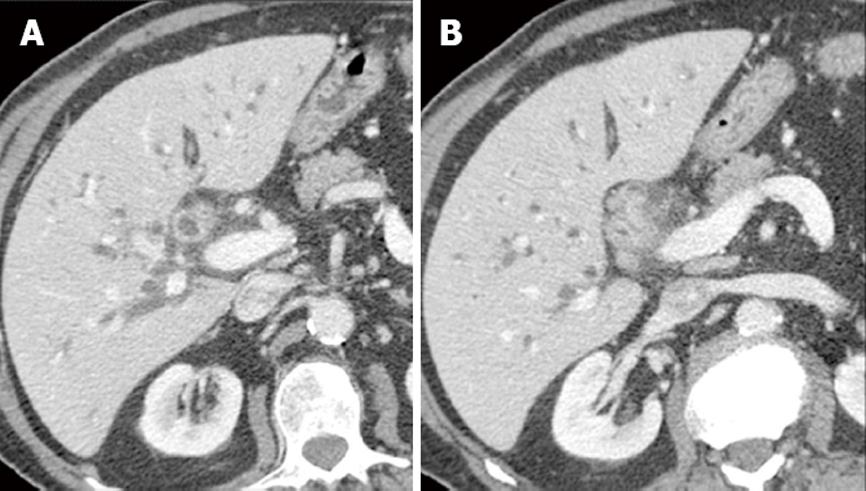
Figure 3 Periductal cholangiocarcinoma multidetector computed tomography.
A: Multidetector computed tomography (MDCT) in the portal phase at the level of the hepatic hilus shows an irregular periductal thickening completely obstructing the common hepatic duct consistent with periductal cholangiocarcinoma (arrow). The lesion is hypoenhancing in the portal phase; B: Delayed phase MDCT at the same level shows marked hyper-enhancement of the tumoral lesion (arrow).
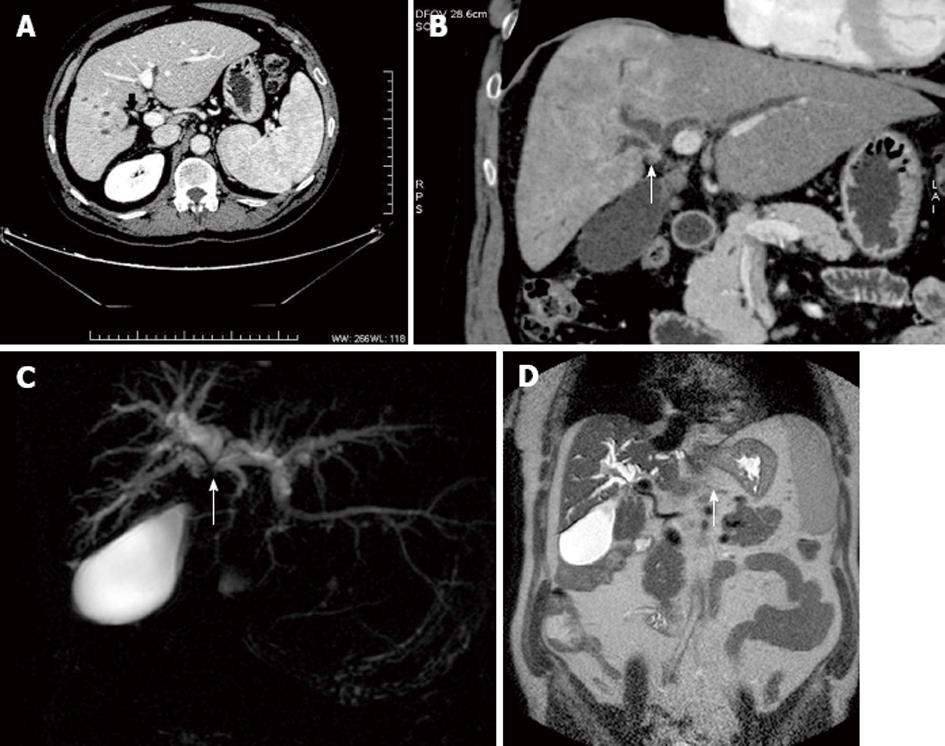
Figure 4 Periductal cholangiocarcinoma multidetector computed tomography and magnetic resonance cholangiopancreatography.
A: Multidetector computed tomography in the portal phase shows periductal cholangiocarcinoma (arrow) producing complete biliary obstruction and atrophy of the right liver; B: Coronal reconstruction shows to a better advantage the scirrhous infiltrating cholangiocarcinoma slightly hyperenhancing (arrow) and the dilated bile ducts upstream; C: Coronal thick-slab (echo spacing 8.3 ms, effective echo time 1000 ms, image matrix 512 x 512, FOV 350 mm) MRCP T2-W sequence in the same patient shows marked dilatation of intrahepatic bile ducts and a signal void (arrow) at the level of the hepatic convergence and common hepatic duct consistent with malignant obstruction by cholangiocarcinoma; D: Matrix (272 x 512, FOV 385 mm) T2-W sequence shows marked dilatation of the intrahepatic ducts and a narrow stenosis at the hepatic bifurcation (arrow).
Figure 5 Hypervascular periductal cholangiocarcinoma.
A: Multidetector computed tomography shows periductal cholangiocarcinoma with brisk arterial enhancement in the arterial phase (arrow); B: Portal phase multidetector computed tomography at the same level shows mild tumoral enhancement (arrow).
Figure 6 Lymphoplasmacytic cholangiopathy multidetector computed tomography.
A: Multidetector computed tomography (MDCT) in the portal phase shows marked intrahepatic dilatation and marked irregular thickening of the common hepatic duct; B: MDCT in the same patient more caudally shows abrupt stenosis and obliteration of the bile duct lumen. Surgical exploration confirmed lymphoplasmacytic cholangiopathy.
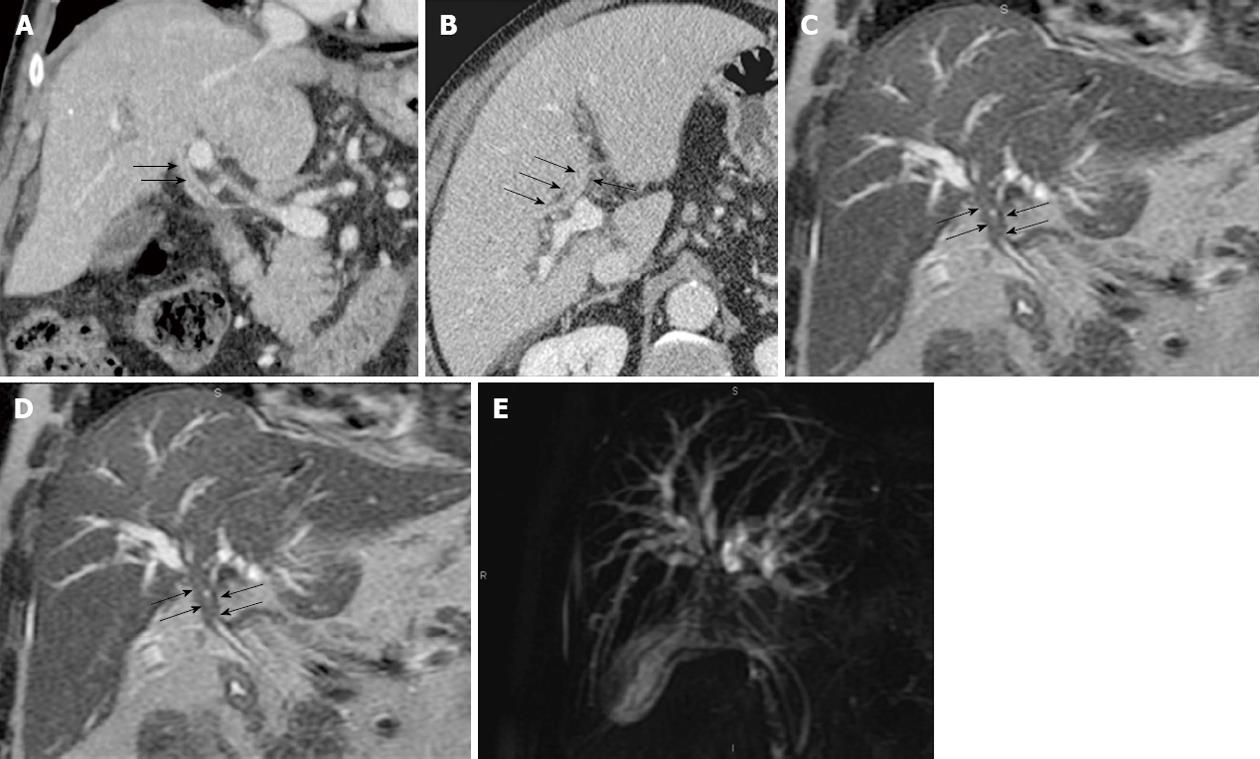
Figure 7 Lymphoplasmacytic cholangiopathy multidetector computed tomography and magnetic resonance cholangiopancreatography.
A, B: Coronal reconstructed and axial multidetector computed tomography in the portal phase show periductal thickening of the common hepatic duct and hepatic bifurcation (arrows); C: Coronal thin-slab (echo spacing 4.2 ms, effective echo time 183 ms, image matrix 272 x 512, FOV 385 mm) T2-W sequence shows marked intrahepatic biliary dilatation and an abrupt stenosis of the coronary heart disease and biliary bifurcation (arrows); D: Coronal thick-slab (echo spacing 8.3 ms, effective echo time 1000 ms, image matrix 512 x 512, FOV 350 mm) magnetic resonance cholangiopancreatography T2-W sequence in the same patient shows marked dilatation of intrahepatic bile ducts and a signal void in the hepatic bifurcation mimicking Klatskin tumor. Surgical exploration and histological study confirmed lymphoplasmacytic cholangiopathy.
Figure 8 Endobiliary metastases.
Sixty eight-year-old patient with obstructive jaundice. The patient had been operated on for liver metastases of colorectal cancer 3 years ago (right hepatectomy). A, B: Portal phase computed tomography shows left intrahepatic biliary dilatation (arrowheads) and a solid slightly hyperenhancing endoluminal mass in the left hepatic duct; C: Coronal reconstruction shows to a better advantage the fluid density of dilated bile ducts and the solid density of the endobiliary tumor (arrows). Percutaneous fine-needle aspiration biopsy confirmed endobiliary metastasis.
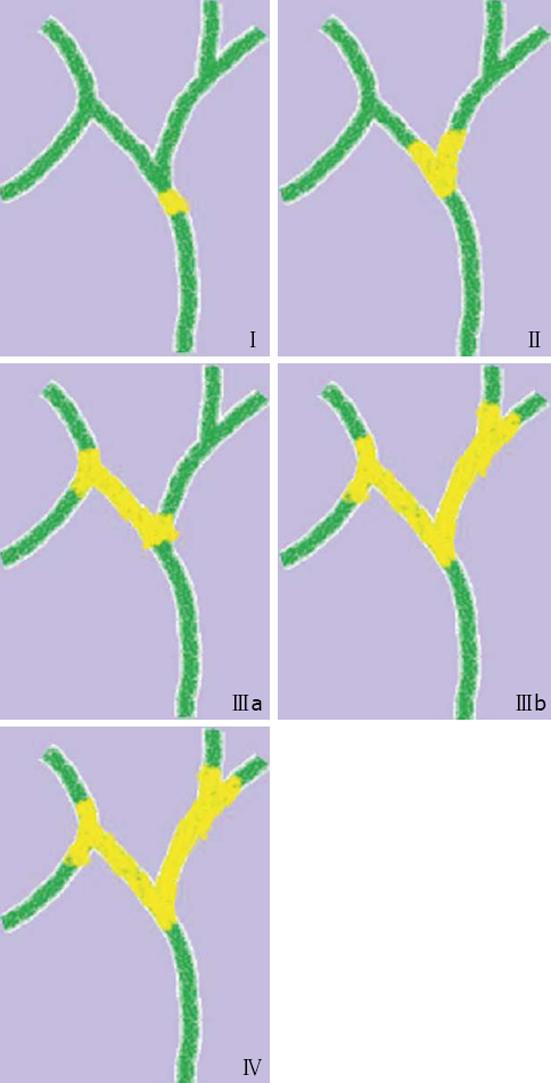
Figure 9 Bismuth-Corlette classification.
Figure 10 Liver infiltration of cholangiocarcinoma.
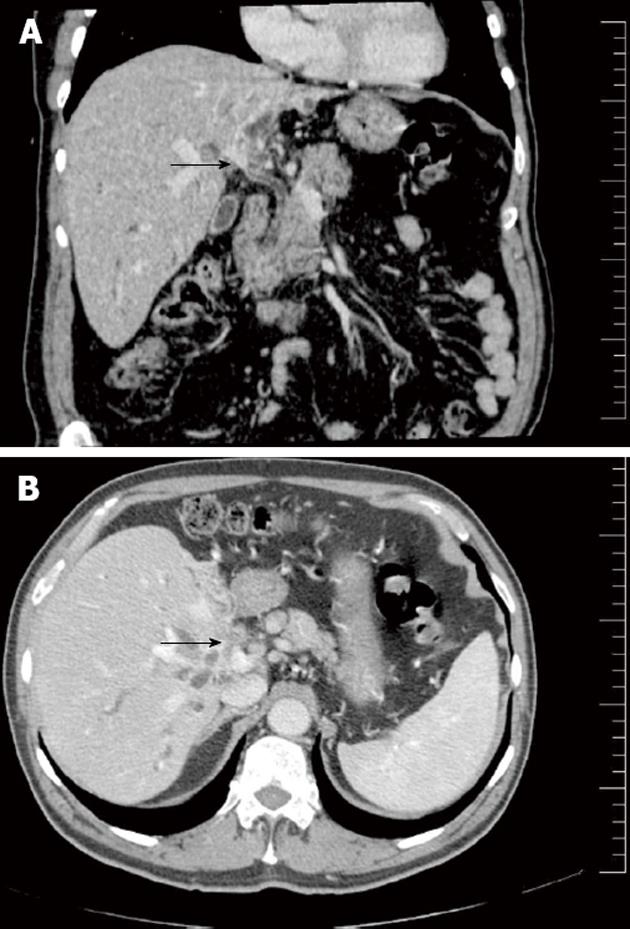
A: Coronal reconstructed multidetector computed tomography shows a periductal mass at the hepatic confluence consistent with cholangiocarcinoma (arrow); B: Axial computed tomography of the same patient shows a hypoenhancing mass involving the liver parenchyma and hilar vessels (arrow) consistent with tumoral infiltration by cholangiocarcinoma.
Figure 11 Portal infiltration of cholangiocarcinoma.
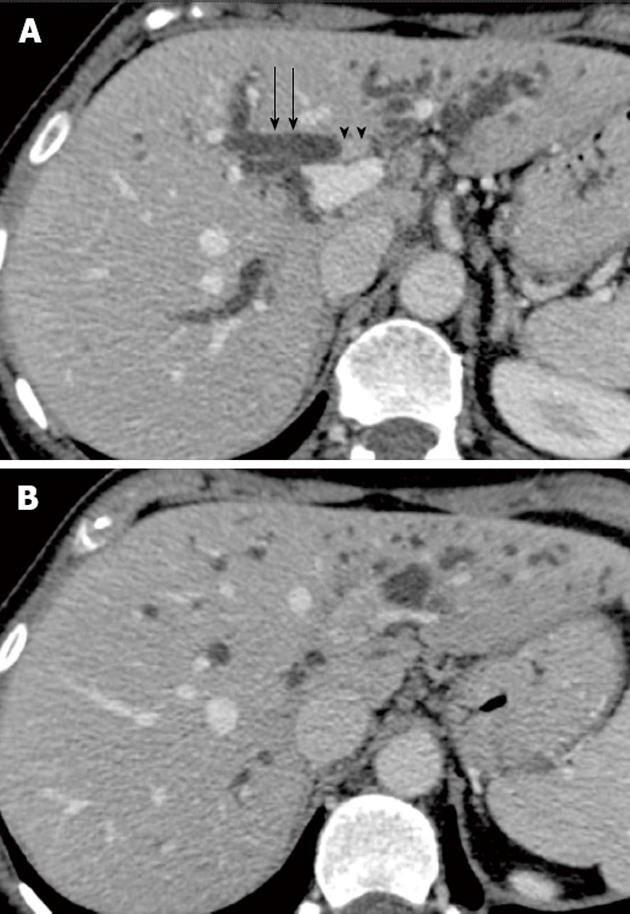
A: Axial computed tomography in the portal phase shows a periductal mass in the portal confluence (arrowheads) producing biliary dilatation (arrows); B: The mass extends cranially and shows encasement and infiltration of the left portal vein.
Figure 12 Arterial infiltration of cholangiocarcinoma.
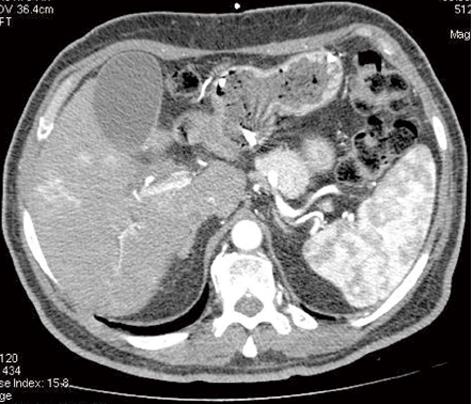
Multidetector computed tomography in the arterial phase shows a periductal mass in the hepatic hilus completely surrounding the right hepatic artery consistent with tumor infiltration.
- Citation: Valls C, Ruiz S, Martinez L, Leiva D. Radiological diagnosis and staging of hilar cholangiocarcinoma. World J Gastrointest Oncol 2013; 5(7): 115-126
- URL: https://www.wjgnet.com/1948-5204/full/v5/i7/115.htm
- DOI: https://dx.doi.org/10.4251/wjgo.v5.i7.115


