Copyright
©2010 Baishideng.
World J Gastrointest Oncol. Feb 15, 2010; 2(2): 85-97
Published online Feb 15, 2010. doi: 10.4251/wjgo.v2.i2.85
Published online Feb 15, 2010. doi: 10.4251/wjgo.v2.i2.85
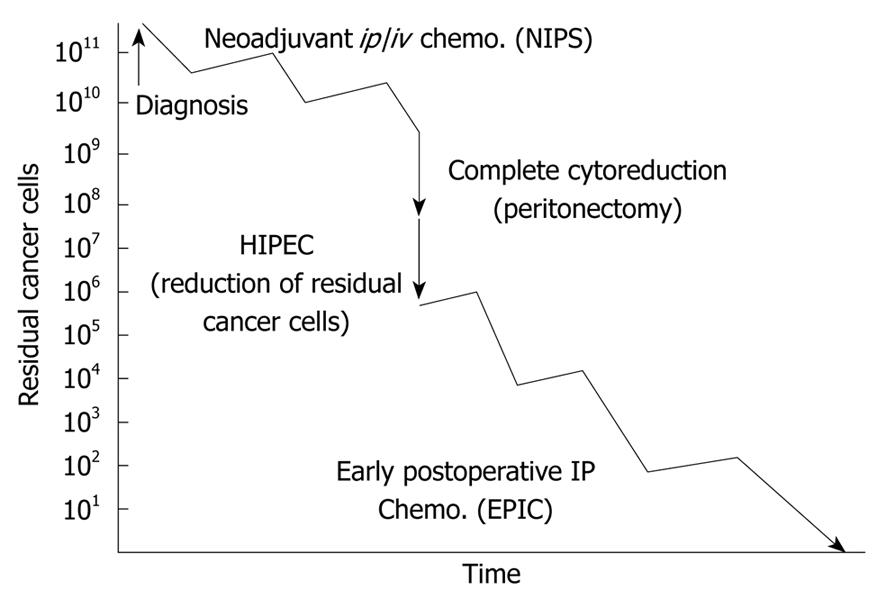
Figure 1 Treatment strategy for PC from gastric cancer.
PC: Peritoneal carcinomatosis; NIPS: Neoadjuvant intraperitoneal-systemic chemotherapy protocol; HIPEC: Hyperthermic intraperitoneal chemoperfusion; EPIC: Early postoperative intraperitoneal chemotherapy.
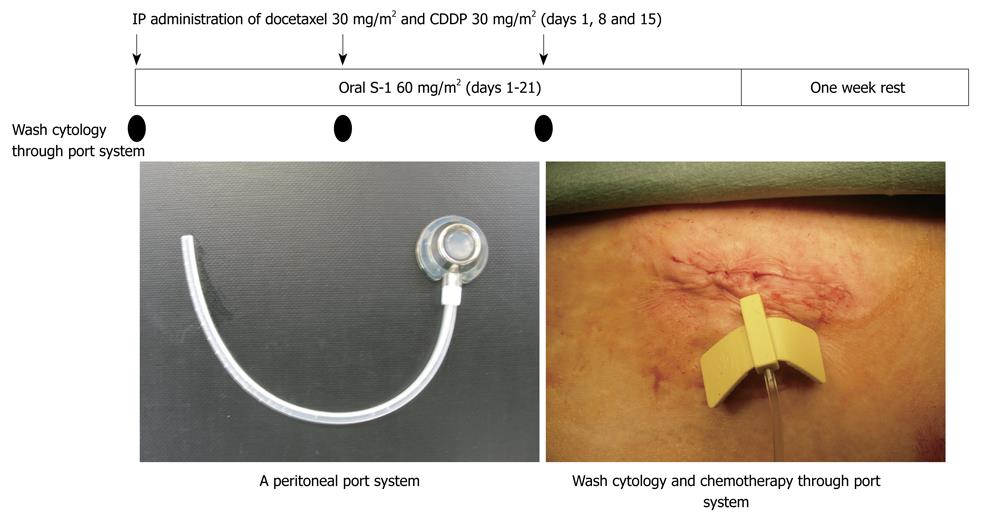
Figure 2 Bidirectional chemotherapy for peritoneal carcinomatosis from gastric cancer.
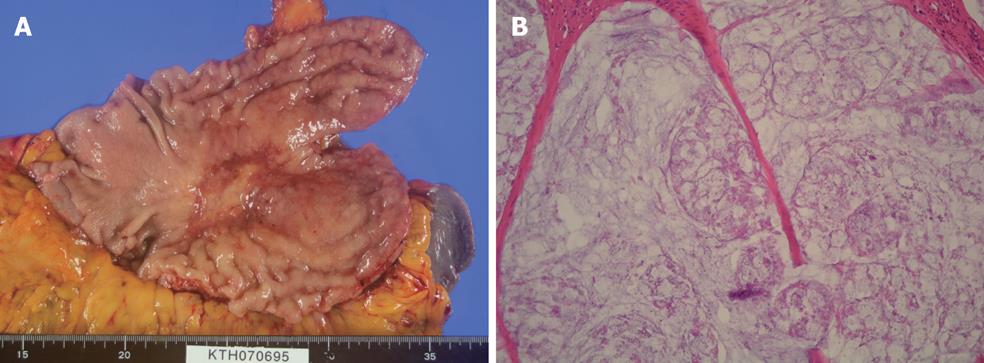
Figure 3 A 34-year old female patient with PC from type 4 gastric cancer treated with NIPS.
A: Macroscopic finding of resected stomach of patients treated with NIPS; B: Histologic finding of resected stomach of patient treated with NIPS. Almost all cancer cells disappear and mucin alone was depicted in the primary tumor (histological grade 3).
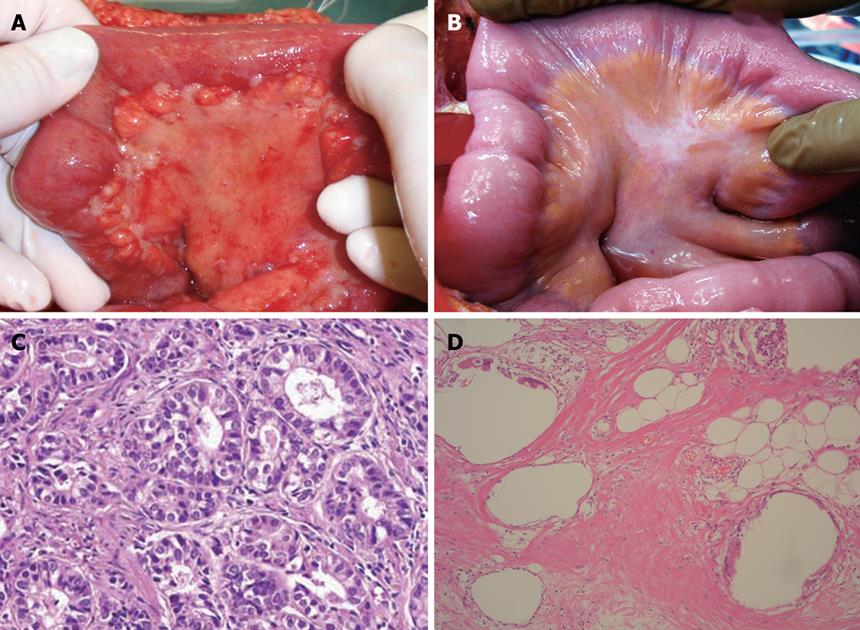
Figure 4 A 48-year old male patient with PC from gastric cancer treated with NIPS.
A: Macroscopic finding of PC on bowel mesentery; B: After 2 courses of NIPS, PC nodules shows fibrotic changes; C: Histologic findings of PC nodule obtained at the first operation of Figure 4A; D: Complete degeneration of cancer cells in PC nodule obtained at second look operation after NIPS.
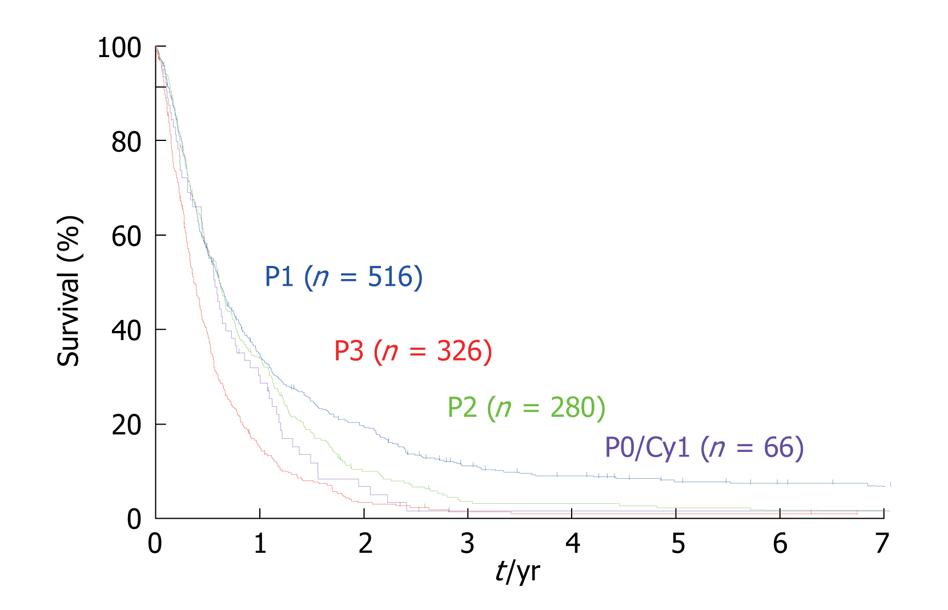
Figure 5 Survival curves of patients with PC, according to the Japanese classification.
P1 vs P2: P < 0.025, χ2 = 4.979; P1 vs P3: P < 0.001, χ2 = 61.13; P0/Cy1 vs P2, P3: Not significant.
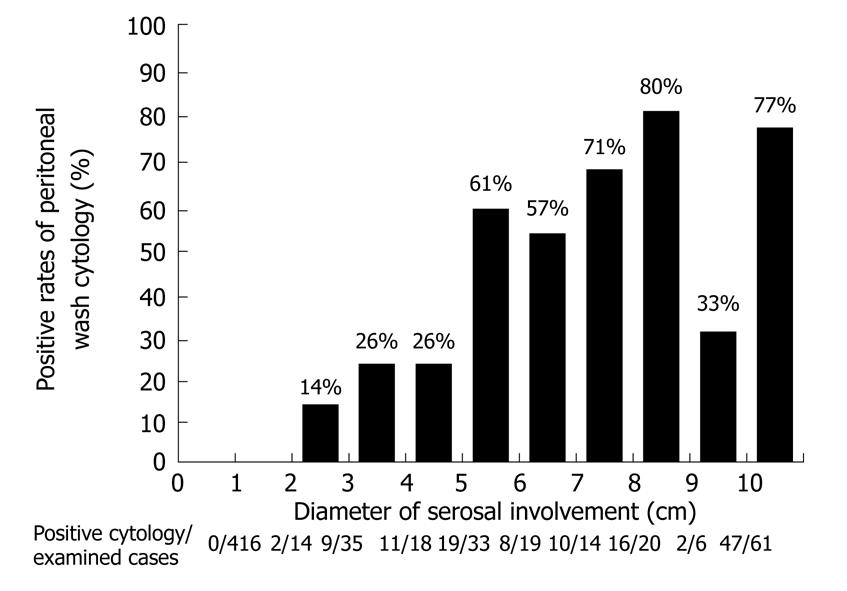
Figure 6 Positive rates of peritoneal wash cytology according to the diameter of serosal involvement of primary tumor.
Intraoperative cytological examination of the peritoneal wash solution using 200 mL of saline in 637 patients who had no macroscopic PC.
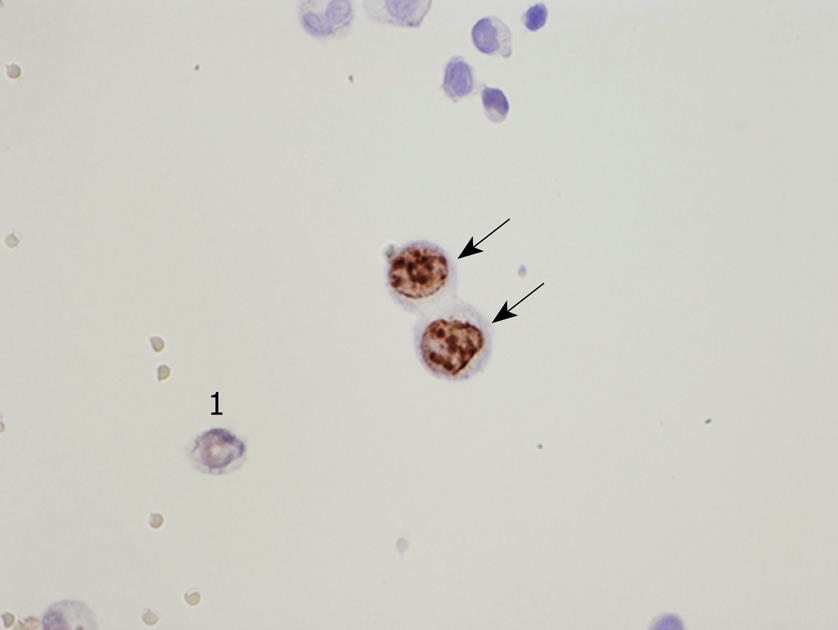
Figure 7 Ki-67 expression in PFCCs (immunocytochemical staining using MIB-1).
1Cancer cell without expression of Ki-67. Arrows indicate Ki-67 positive PFCCs with proliferative activity.
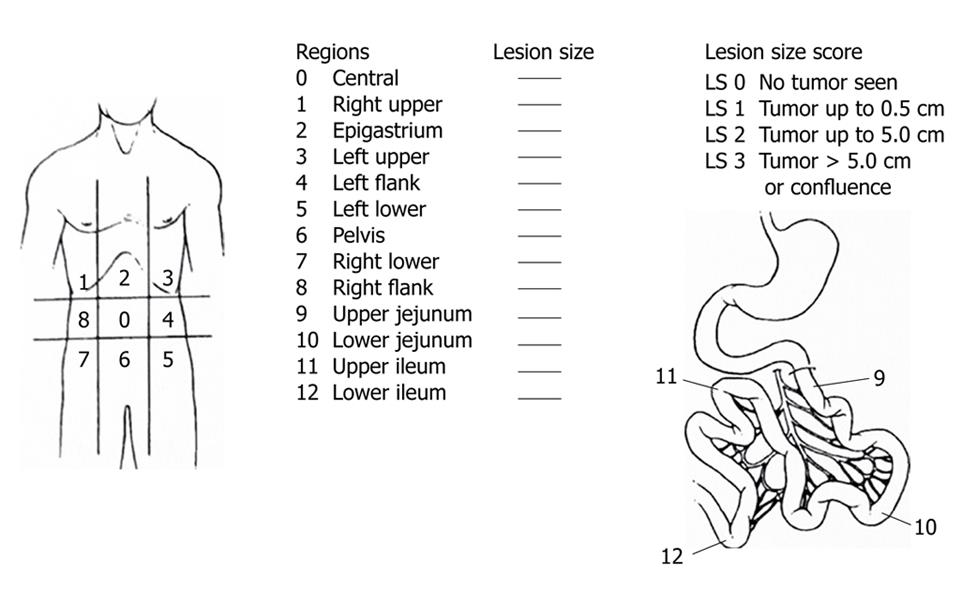
Figure 8 Peritoneal cancer index (PCI).
Peritoneal cavity is divided into 13 parts, which ranges from 0 to 12. Accurate measurement of each region is scored as lesion size 0 through 3. LS 0: No implants. LS 1 refers to implants up to 0.5 cm in diameter; LS 2 refers to implants greater than 0.5 cm and up to 5 cm; and SL3 refers to those 5 cm or greater in diameter.
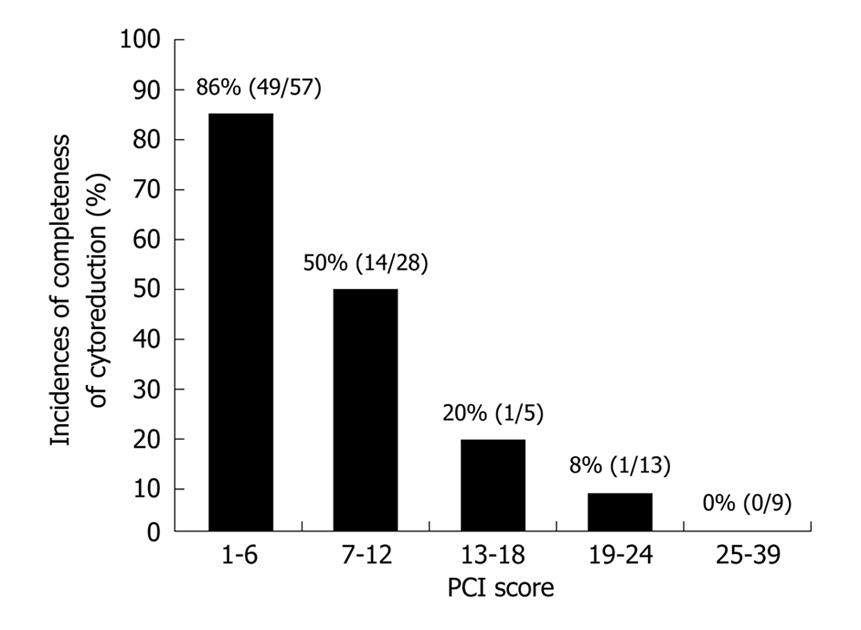
Figure 9 PCI scores and completeness of cytoreduction in 92 gastric cancer with PC, who underwent CRS.
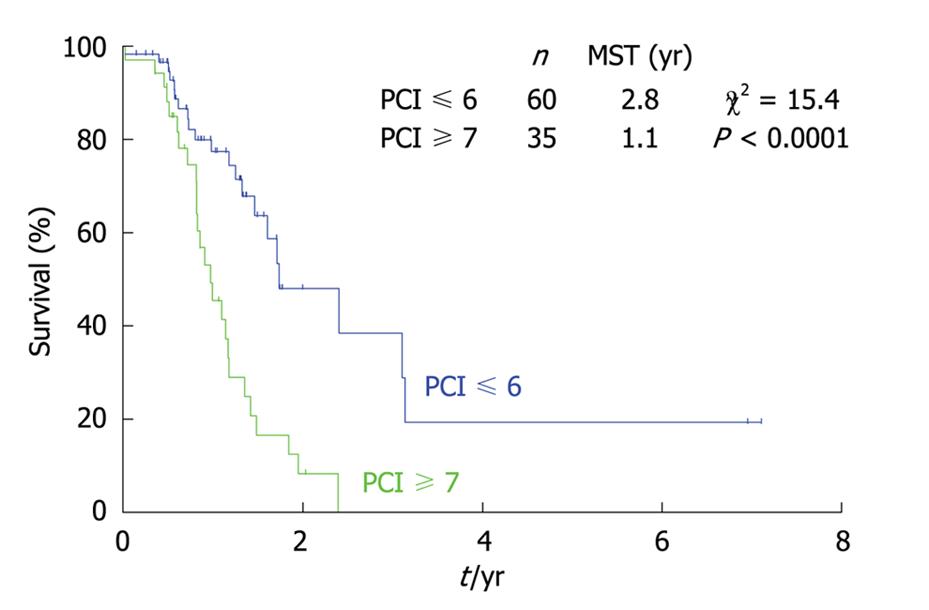
Figure 10 Survival differences of gastric cancer patients with PC, according to the PCI score.
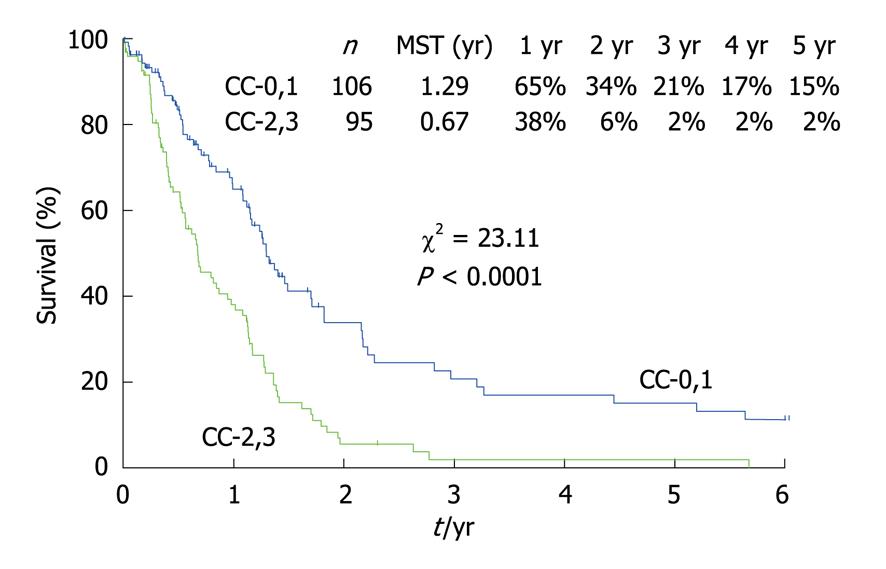
Figure 11 Survival curves of gastric cancer patients with PC after cytoreductive surgery and HIPEC using the CC score.
The assessment of the CC is classified into 3 categories. CC-0: The complete cytoreduction with no residual macroscopic nodule; CC-1: No macroscopic tumor but positive margin histologically or suspicious residual nodules less than 5 mm; CC-2: Apparent macroscopic residual tumors greater than 5 mm but up to 5 cm; and CC-3: Residual PC greater than 5 cm in diameter.
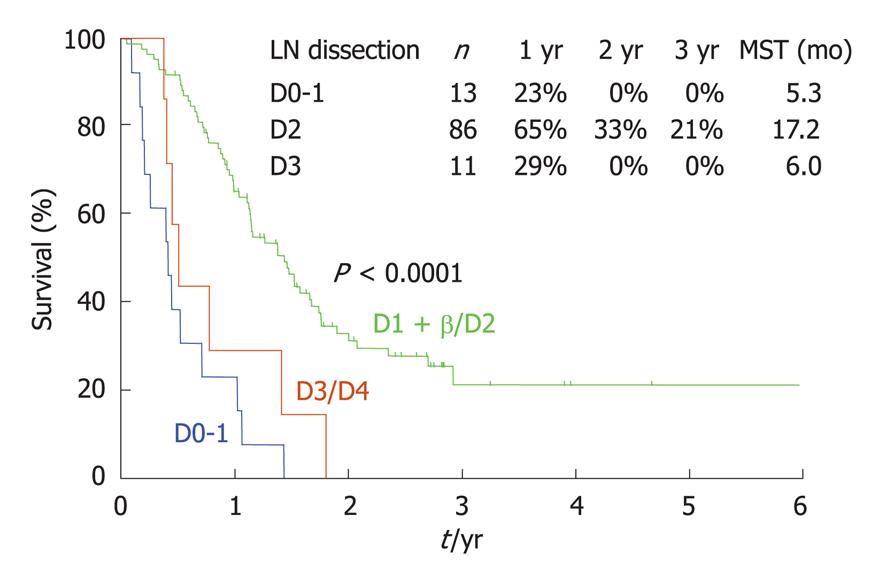
Figure 12 Survival curves of P0/Cy1 patients without distant metastasis, according to the extent of lymph node dissection.
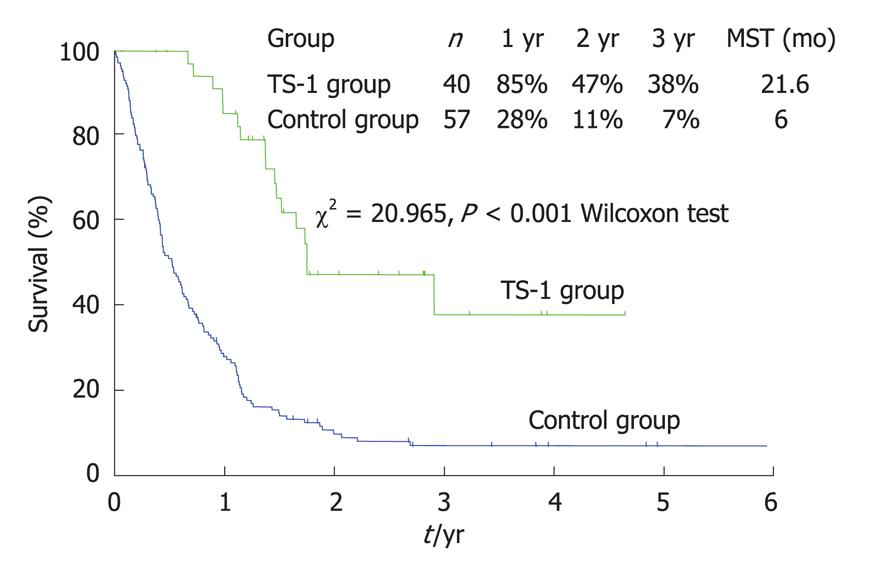
Figure 13 Survival of P0, Cy1 patients treated with gastrectomy+ postoperative TS-1 therapy and gastrectomy alone.
- Citation: Yonemura Y, Elnemr A, Endou Y, Hirano M, Mizumoto A, Takao N, Ichinose M, Miura M, Li Y. Multidisciplinary therapy for treatment of patients with peritoneal carcinomatosis from gastric cancer. World J Gastrointest Oncol 2010; 2(2): 85-97
- URL: https://www.wjgnet.com/1948-5204/full/v2/i2/85.htm
- DOI: https://dx.doi.org/10.4251/wjgo.v2.i2.85


