Copyright
©2010 Baishideng.
World J Gastrointest Oncol. Feb 15, 2010; 2(2): 85-97
Published online Feb 15, 2010. doi: 10.4251/wjgo.v2.i2.85
Published online Feb 15, 2010. doi: 10.4251/wjgo.v2.i2.85
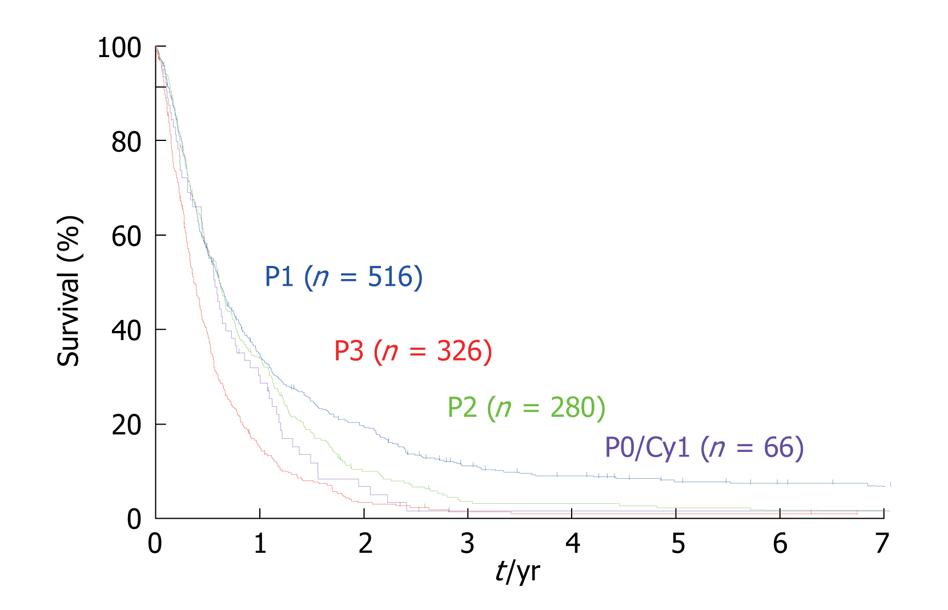
Figure 5 Survival curves of patients with PC, according to the Japanese classification.
P1 vs P2: P < 0.025, χ2 = 4.979; P1 vs P3: P < 0.001, χ2 = 61.13; P0/Cy1 vs P2, P3: Not significant.
- Citation: Yonemura Y, Elnemr A, Endou Y, Hirano M, Mizumoto A, Takao N, Ichinose M, Miura M, Li Y. Multidisciplinary therapy for treatment of patients with peritoneal carcinomatosis from gastric cancer. World J Gastrointest Oncol 2010; 2(2): 85-97
- URL: https://www.wjgnet.com/1948-5204/full/v2/i2/85.htm
- DOI: https://dx.doi.org/10.4251/wjgo.v2.i2.85


