Copyright
©The Author(s) 2025.
World J Gastrointest Oncol. Aug 15, 2025; 17(8): 109245
Published online Aug 15, 2025. doi: 10.4251/wjgo.v17.i8.109245
Published online Aug 15, 2025. doi: 10.4251/wjgo.v17.i8.109245
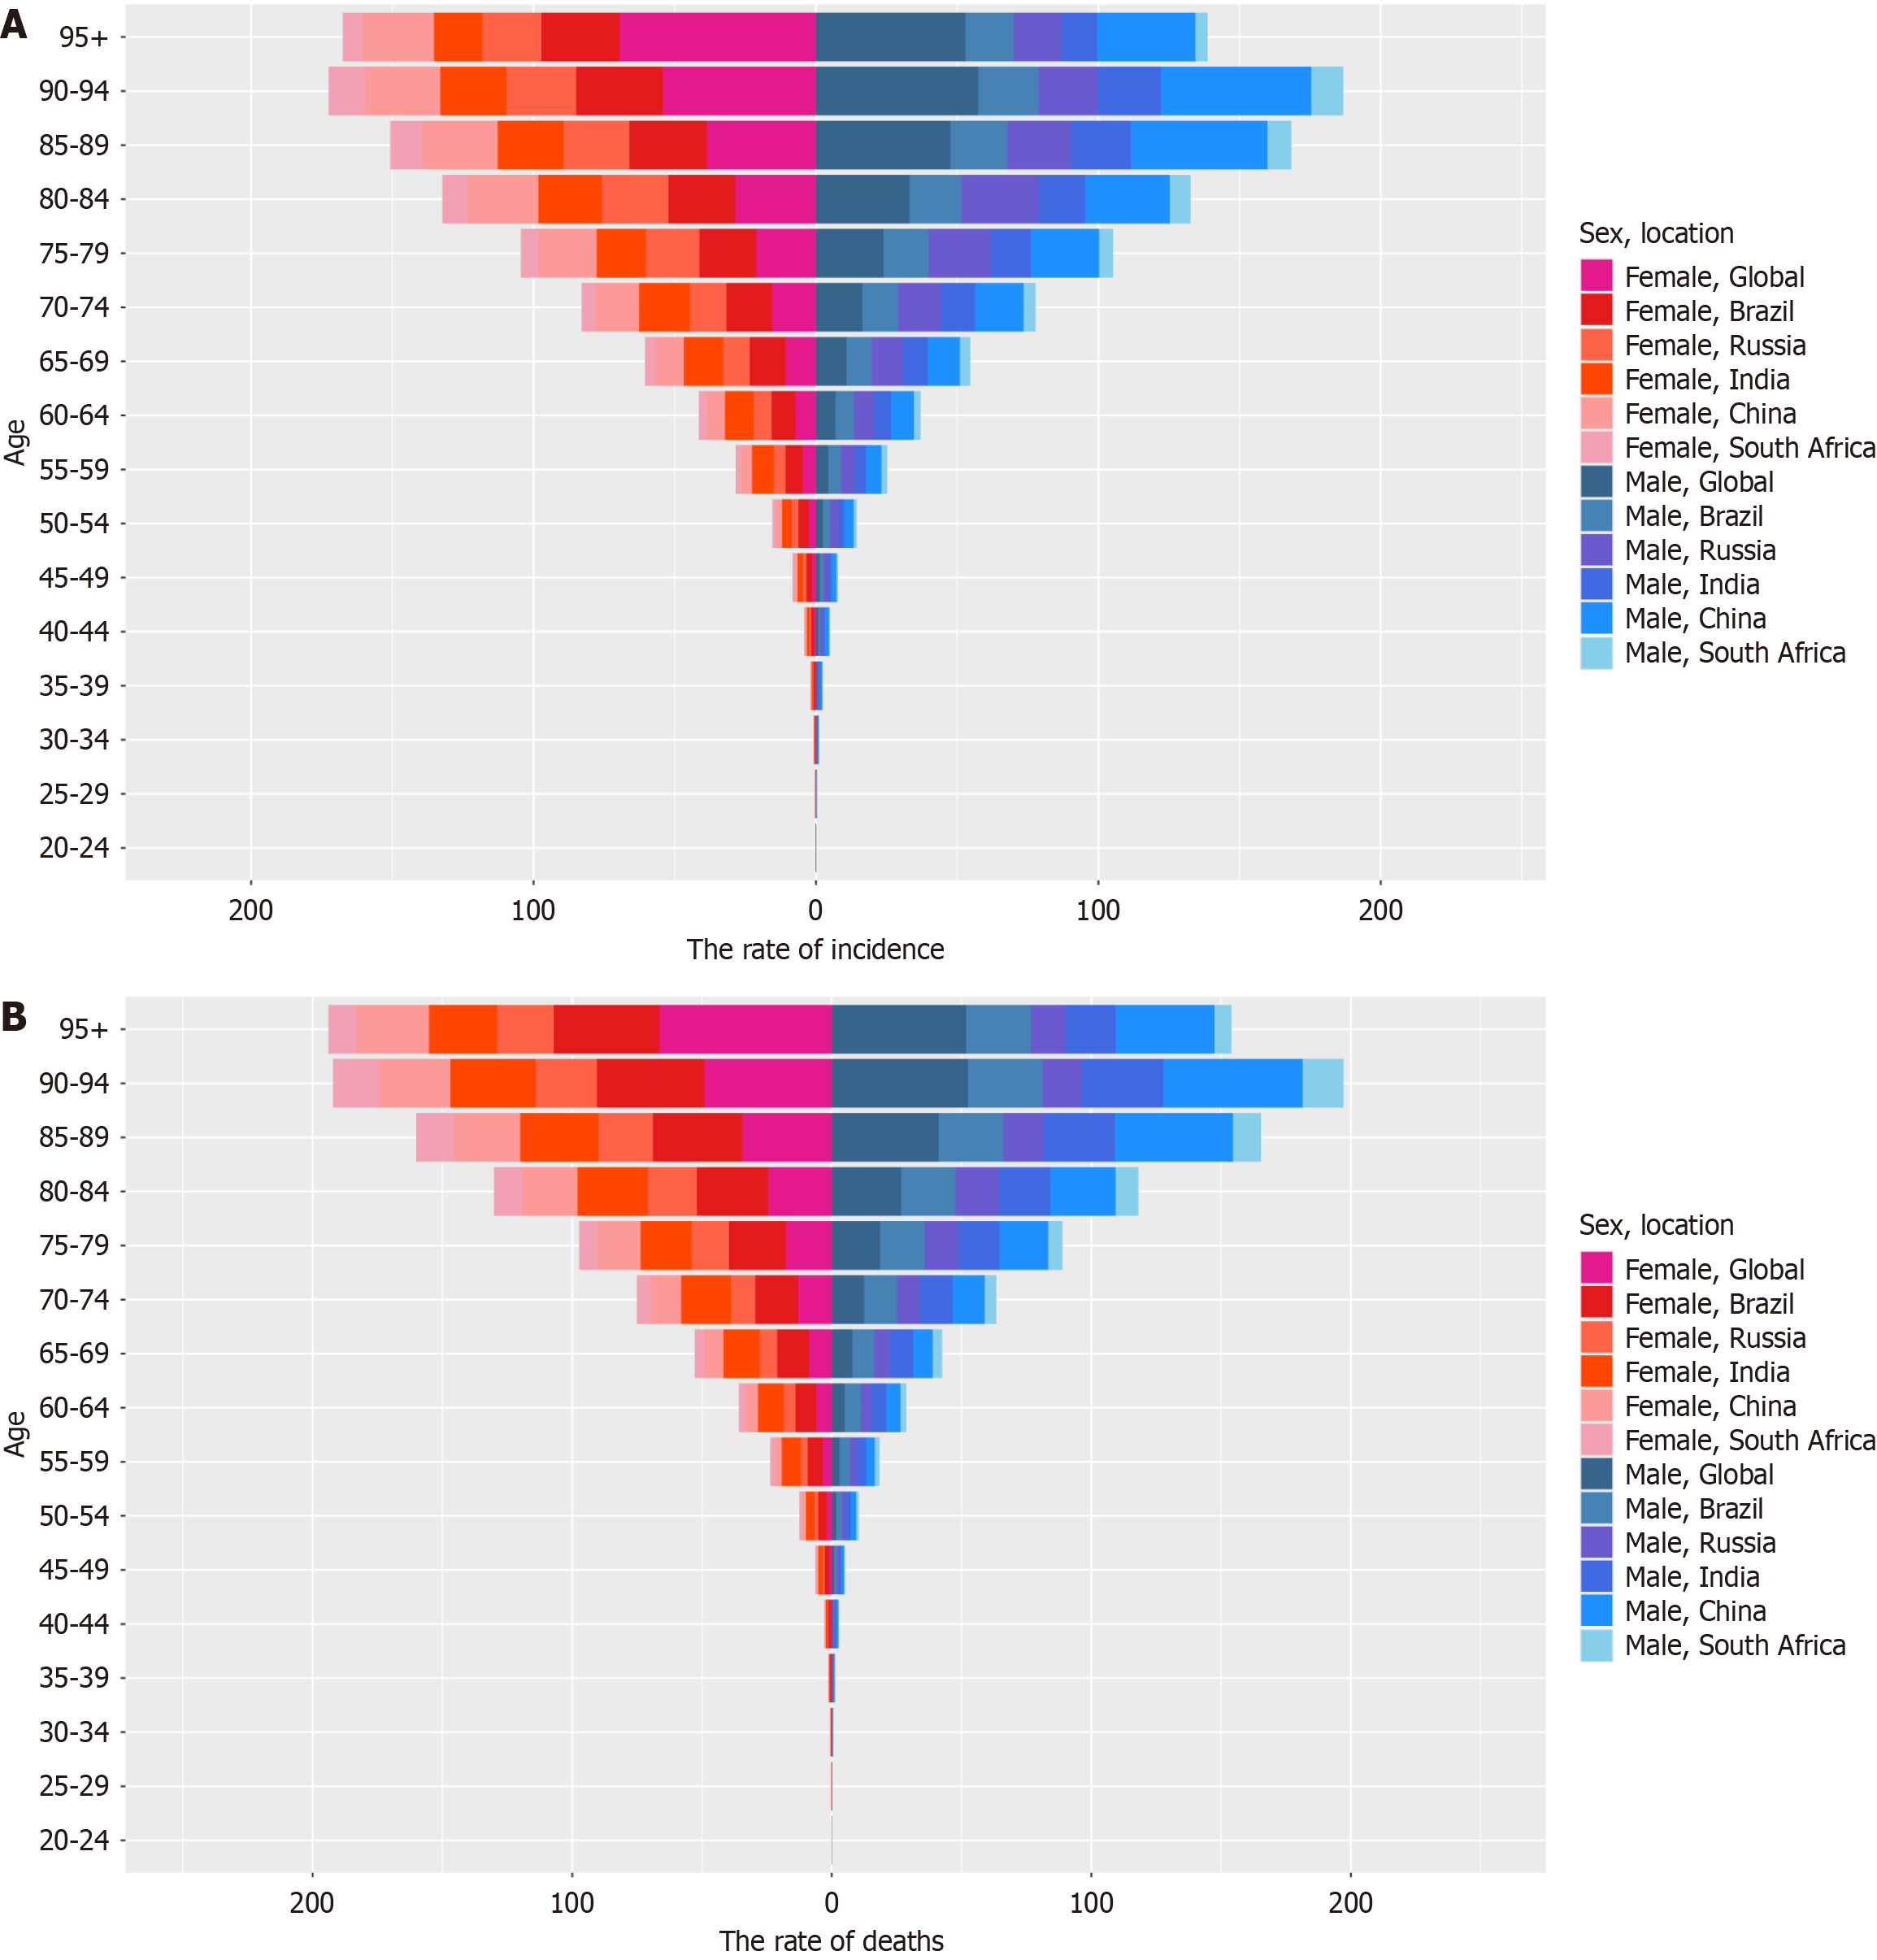
Figure 1 Incidence and mortality of gallbladder and biliary tract cancer.
A and B: Comparison of the rate of incidence (A), comparison of the rate of mortality (B) of gallbladder and biliary tract cancer between males and females in different age groups globally and in Brazil, Russian Federation, India, China and South Africa nations in 2021.
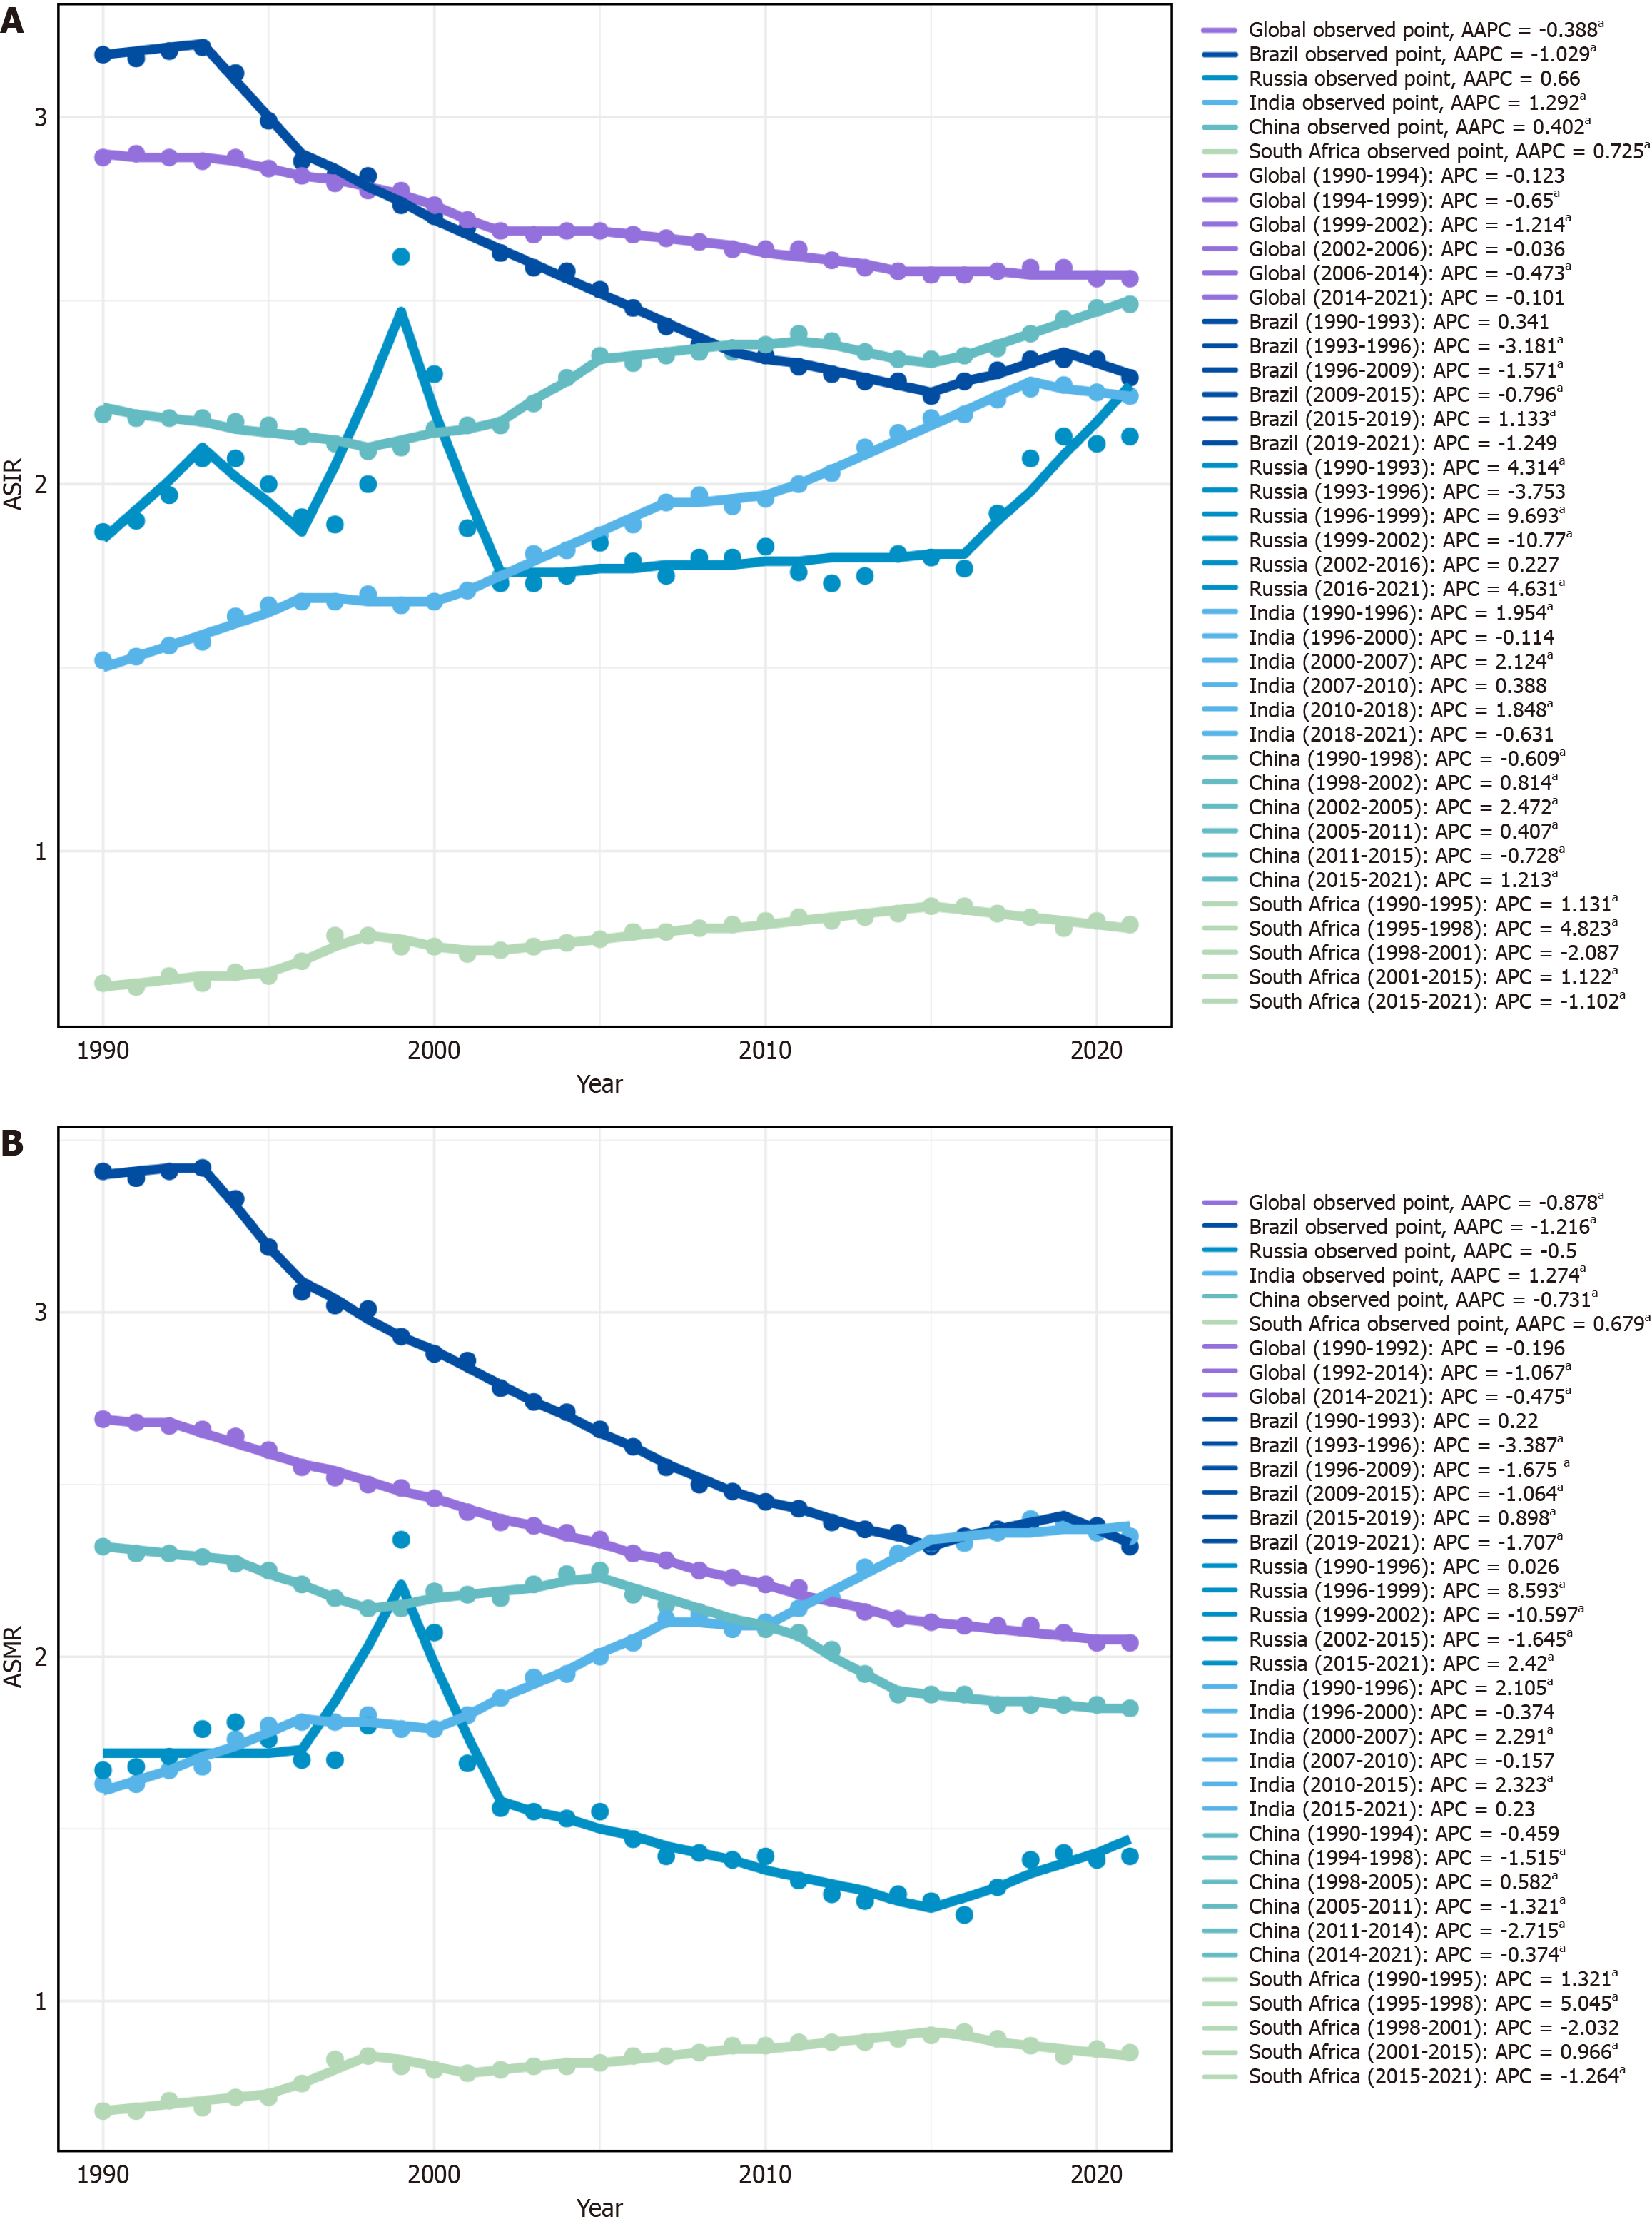
Figure 2 Joinpoint regression analysis of the age-standardized incidence rate and age-standardized mortality rate for gallbladder and biliary tract cancer globally and in Brazil, Russian Federation, India, China and South Africa nations from 1990 to 2021.
A: Age-standardized incidence rate; B: Age-standardized mortality rate. ASIR: Age-standardized incidence rate; APC: Annual percentage change; AAPC: Average annual percentage change. aP < 0.05, indicating statistically significant changes in annual percentage change and average annual percentage change.
Figure 3 Age-period-cohort effect of burden for the incidence of gallbladder and biliary tract cancer globally and in Brazil, Russian Federation, India, China and South Africa nations from 1990 to 2021.
A: Longitudinal age curve; B: Period rate ratio curve; C: Cohort rate ratio curve; D: Local drifts curve with net drifts.
Figure 4 Age-period-cohort effect of burden for mortality of gallbladder and biliary tract cancer globally and in Brazil, Russian Federation, India, China and South Africa nations from 1990 to 2021.
A: Longitudinal age curve; B: Period rate ratio curve; C: Cohort rate ratio curve; D; Local drifts curve with net drifts.
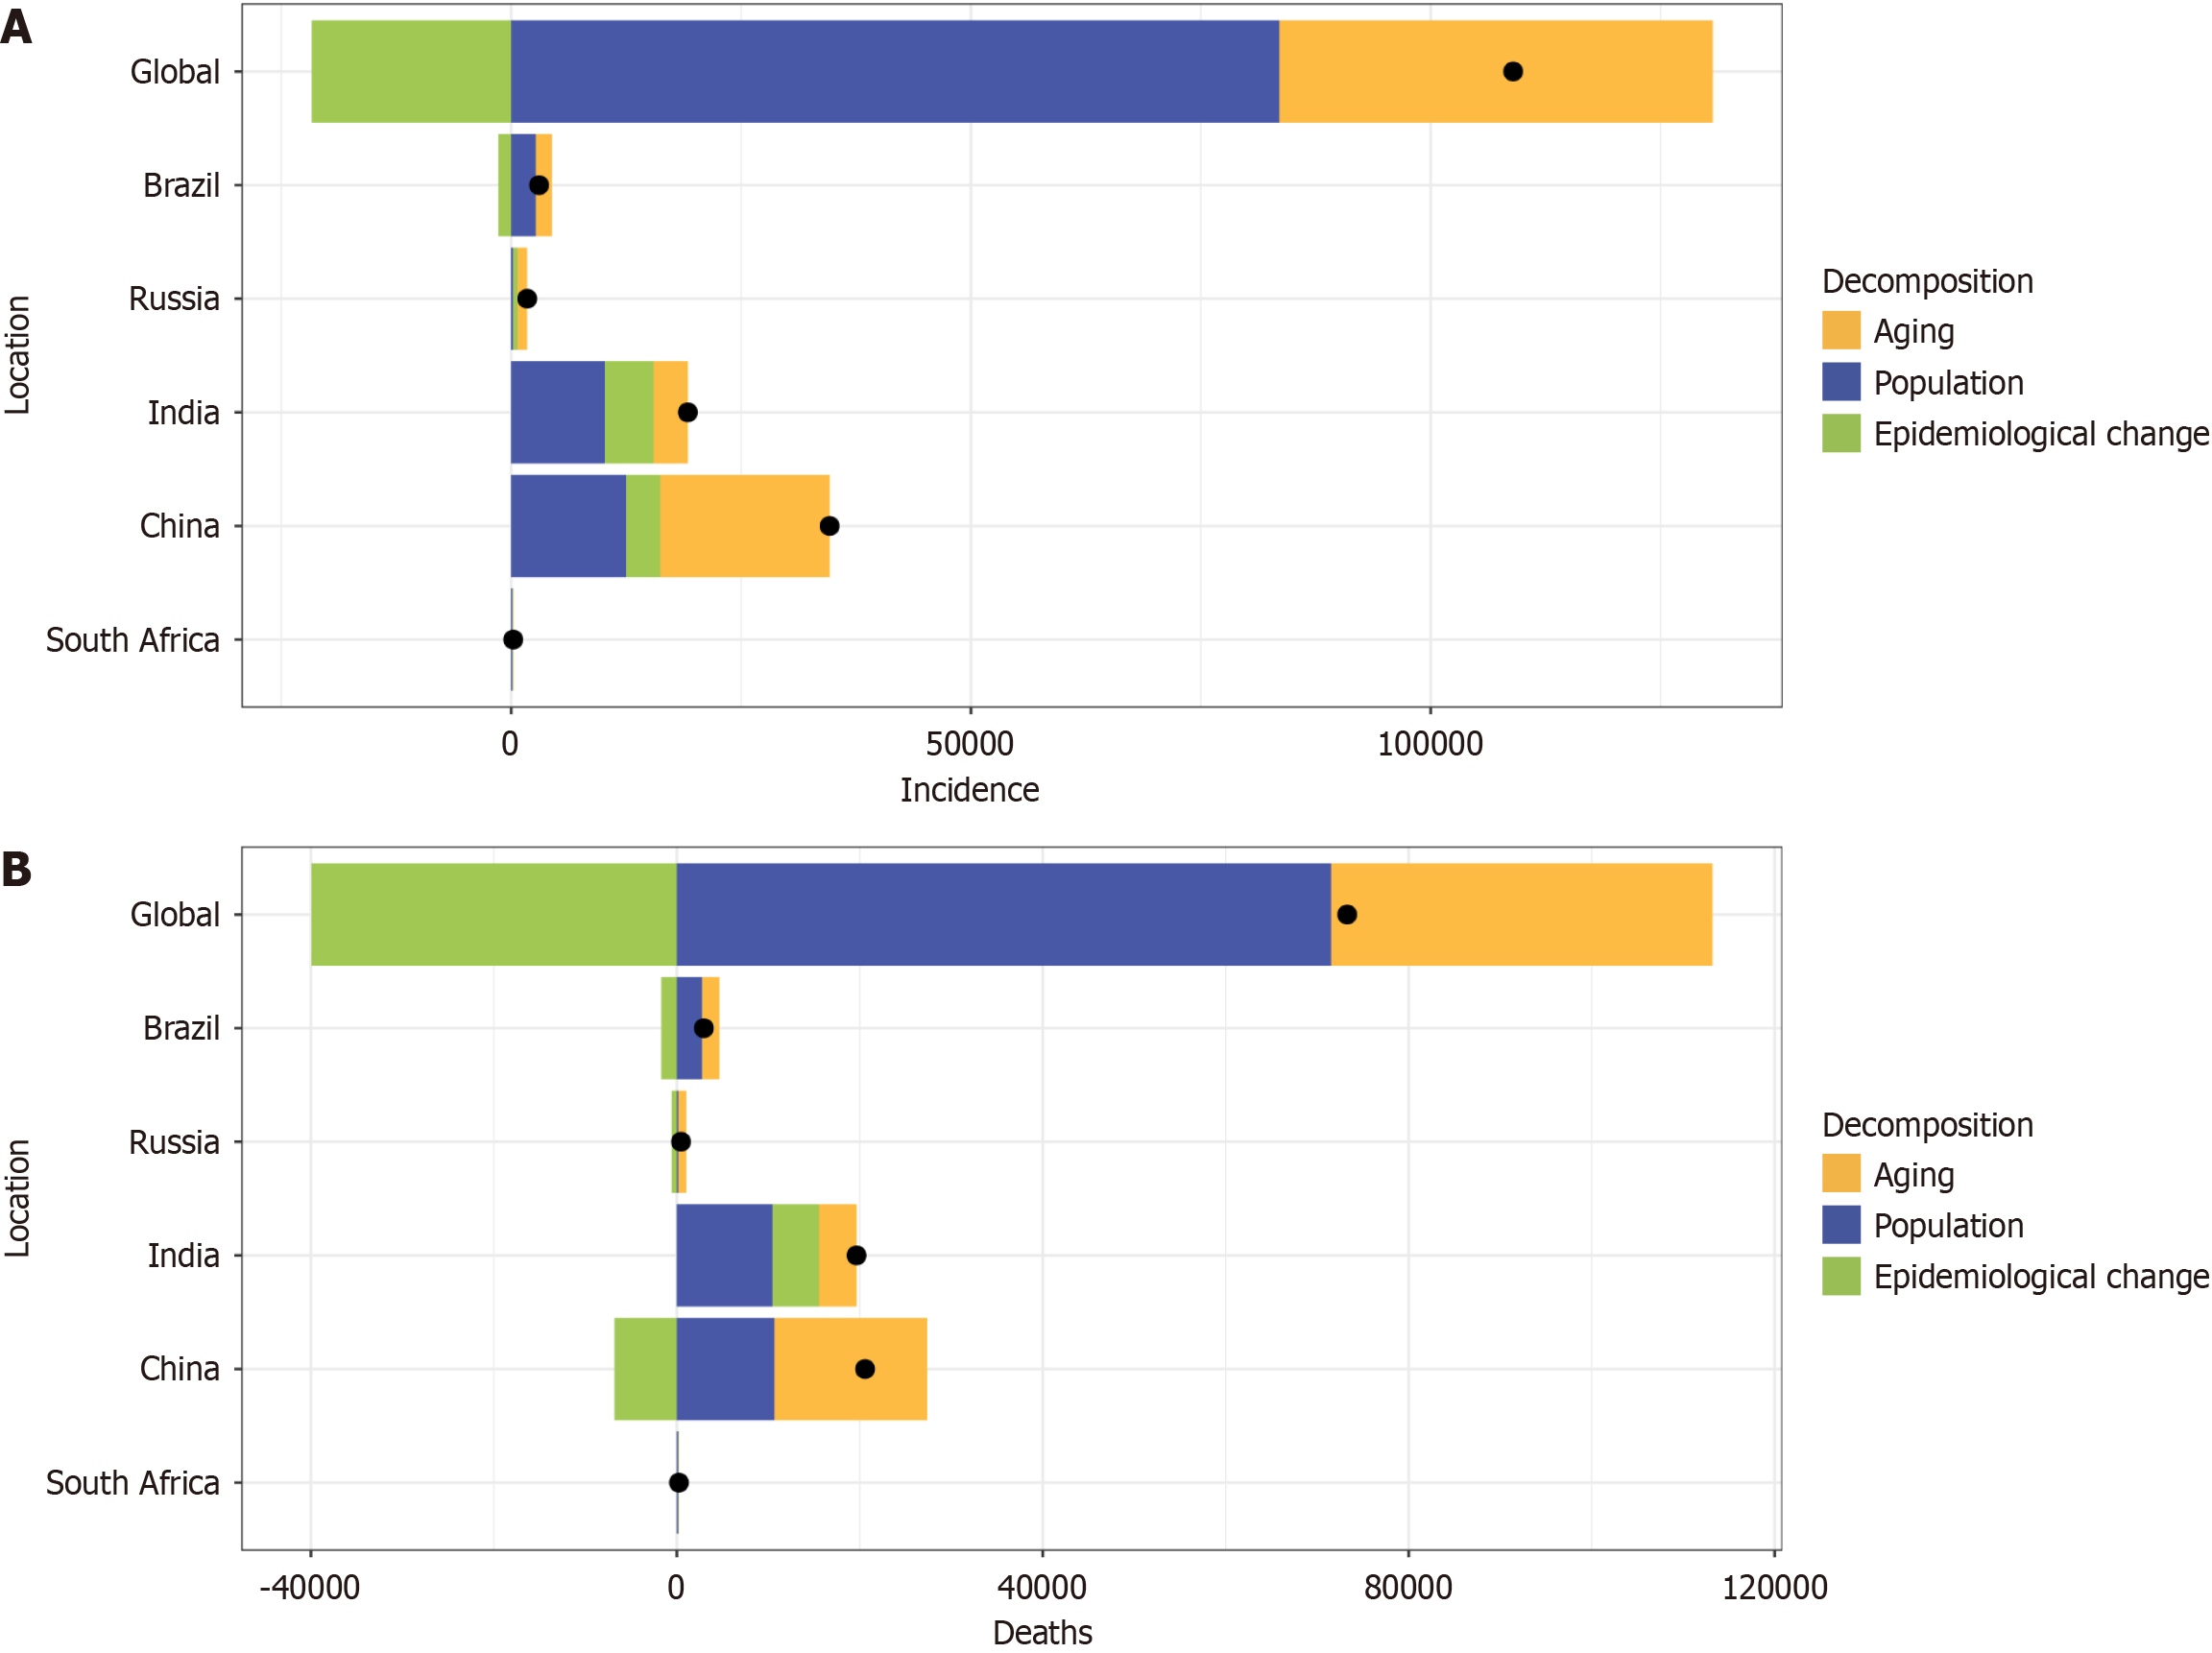
Figure 5 Relative contributions of population aging, population growth and epidemiological changes to gallbladder and biliary tract cancer globally and in Brazil, Russian Federation, India, China and South Africa nations from 1990 to 2021.
A: Incidence; B: Deaths.
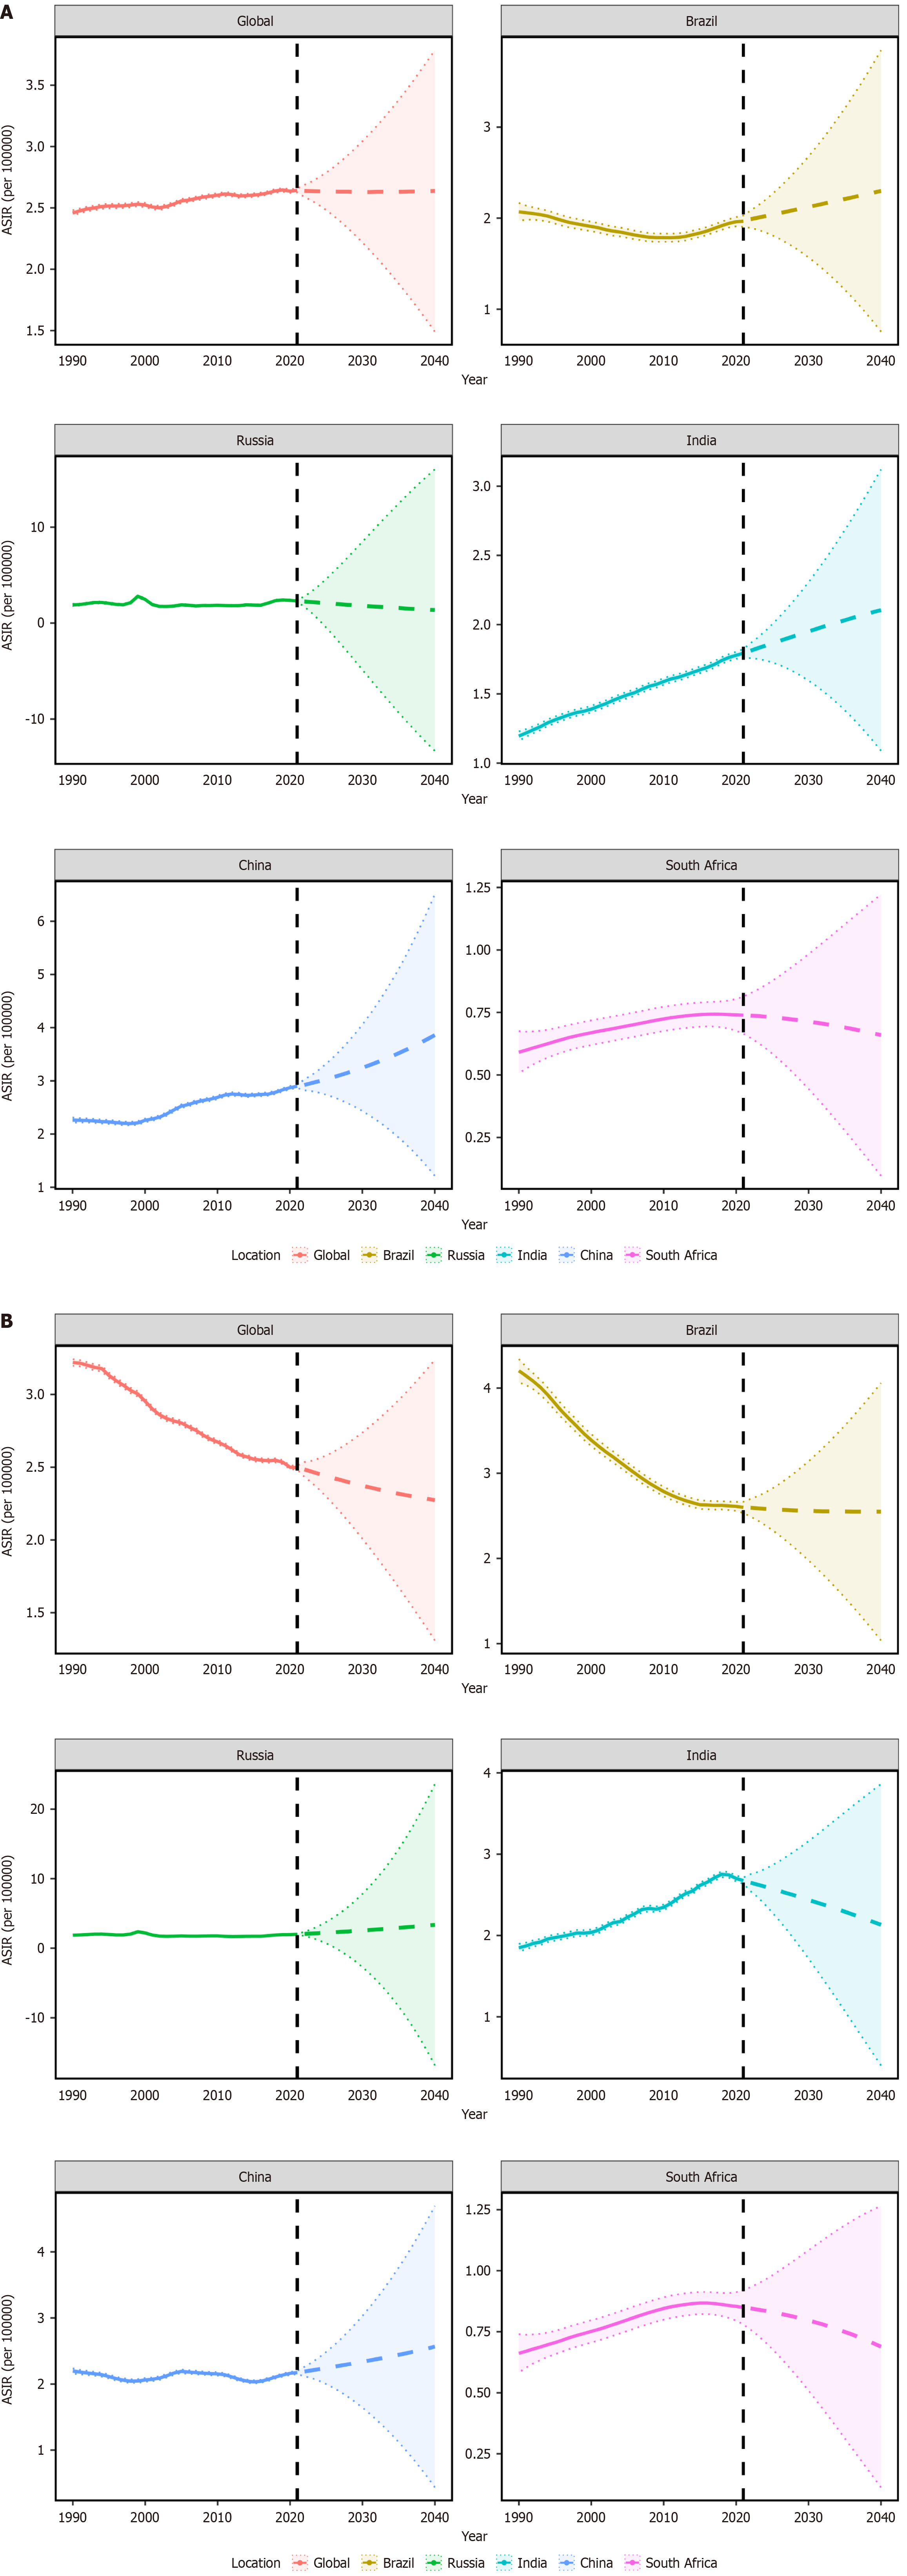
Figure 6 Observed and predicted trends of the age-standardized incidence rate of gallbladder and biliary tract cancer globally and in Brazil, Russian Federation, India, China and South Africa nations from 2022 to 2040 using the Bayesian age-period-cohort model.
A: Male; B: Female. The shadow in the figure represents uncertainty intervals, suggesting that mortality could fluctuate dramatically as the corresponding rates rise or fall by 1% per year, with each shade corresponding to a change of 1%. ASIR: Age-standardized incidence rate.
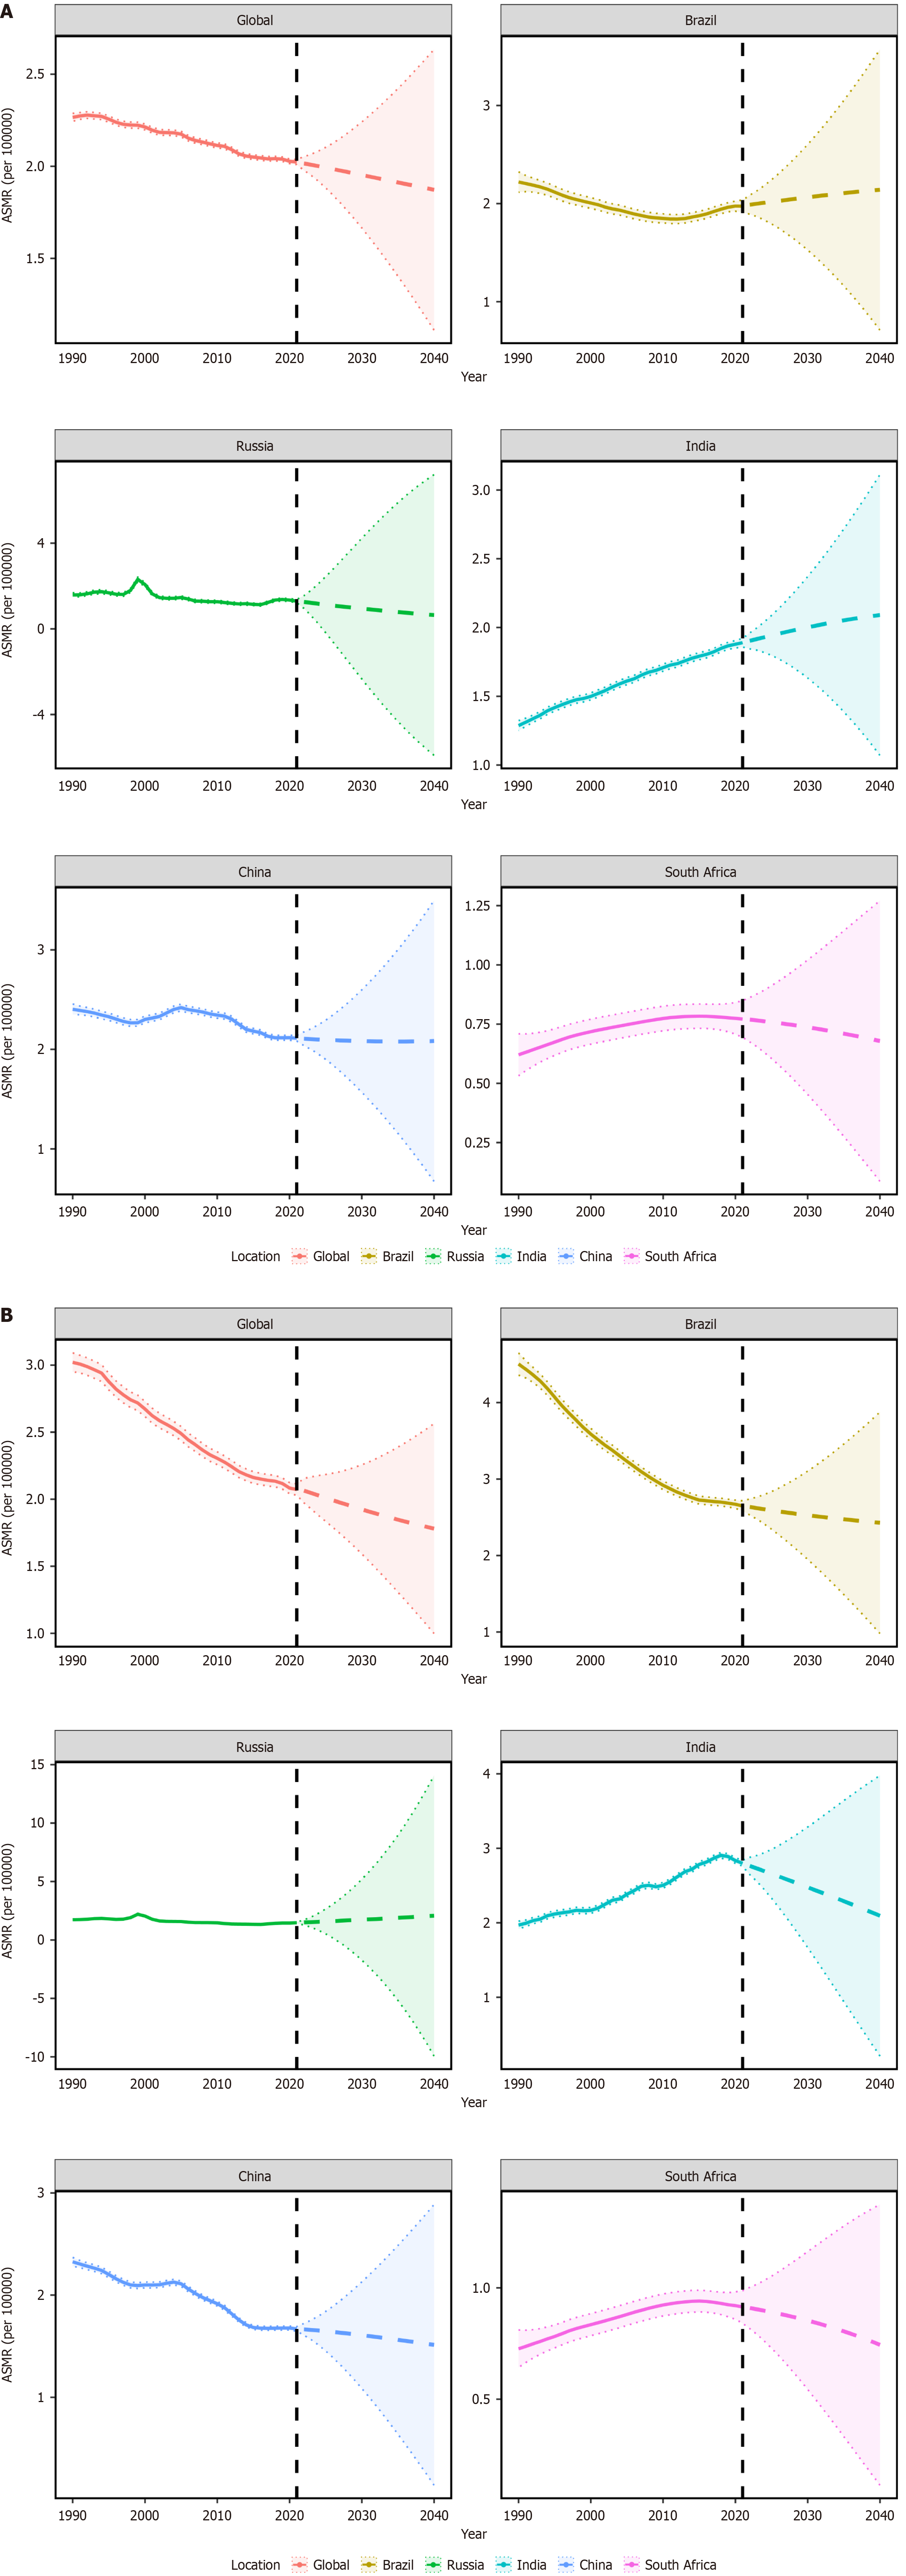
Figure 7 Observed and predicted trends of the age-standardized mortality rate of gallbladder and biliary tract cancer globally and in Brazil, Russian Federation, India, China and South Africa nations from 2022 to 2040 using the Bayesian age-period-cohort model.
A: Male; B: Female. The shadow in the figure represents uncertainty intervals, suggesting that mortality could fluctuate dramatically as the corresponding rates rise or fall by 1% per year, with each shade corresponding to a change of 1%. ASMR: Age-standardized mortality rate.
- Citation: Cui YL, Bao X, Liu DM, Mu H, Yu G. Gallbladder and biliary tract cancer burden trends in Brazil, Russian Federation, India, China, and South Africa in 1990-2021. World J Gastrointest Oncol 2025; 17(8): 109245
- URL: https://www.wjgnet.com/1948-5204/full/v17/i8/109245.htm
- DOI: https://dx.doi.org/10.4251/wjgo.v17.i8.109245


