Copyright
©The Author(s) 2025.
World J Gastrointest Oncol. Jun 15, 2025; 17(6): 105782
Published online Jun 15, 2025. doi: 10.4251/wjgo.v17.i6.105782
Published online Jun 15, 2025. doi: 10.4251/wjgo.v17.i6.105782
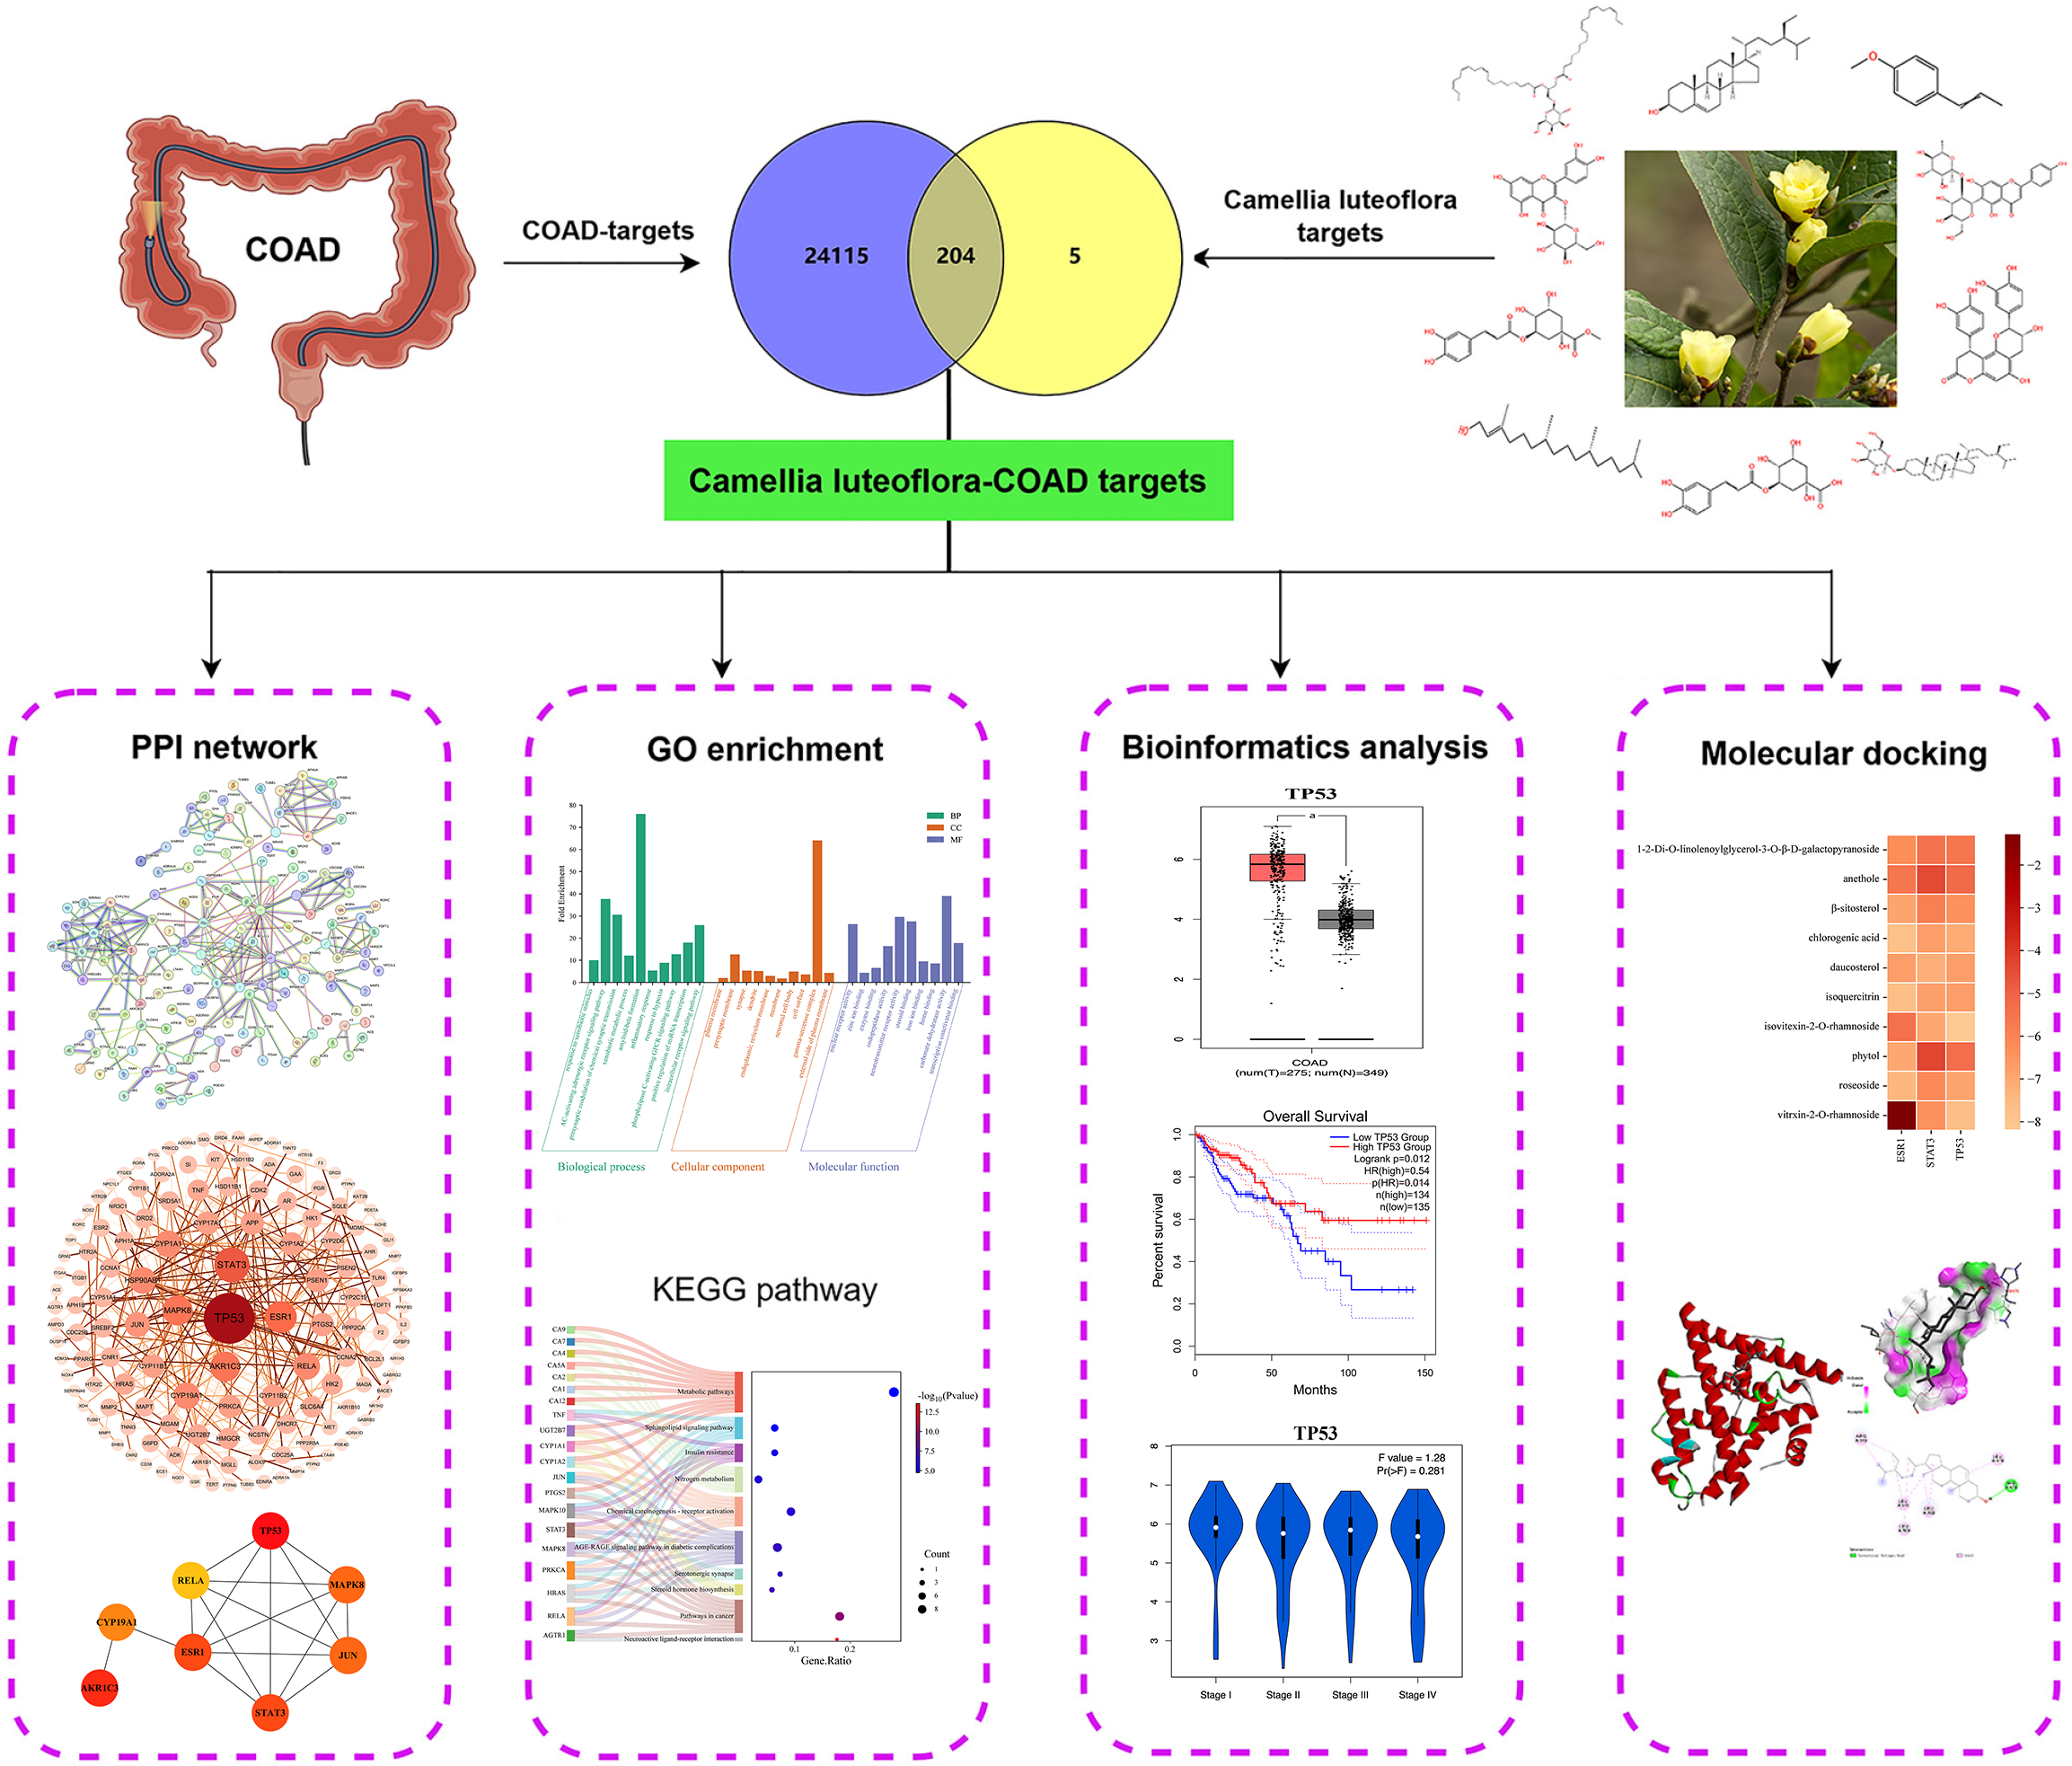
Figure 1 Network pharmacology regulatory mechanisms of Camellia luteoflora in anti-colon adenocarcinoma.
COAD: Colon adenocarcinoma; PPI: Protein-protein interaction.
Figure 2 Camellia luteoflora-colon adenocarcinoma potential targets and protein-protein interaction network.
A: The 209 potential targets of Camellia luteoflora active ingredients; B: Venn diagram of potential targets prediction; C: The original protein-protein interaction (PPI) network of the interaction targets output by STRING; D: The visualized PPI network of the interaction targets output by Cytoscape; E: The relationship of the top 10 hub genes. COAD: Colon adenocarcinoma.
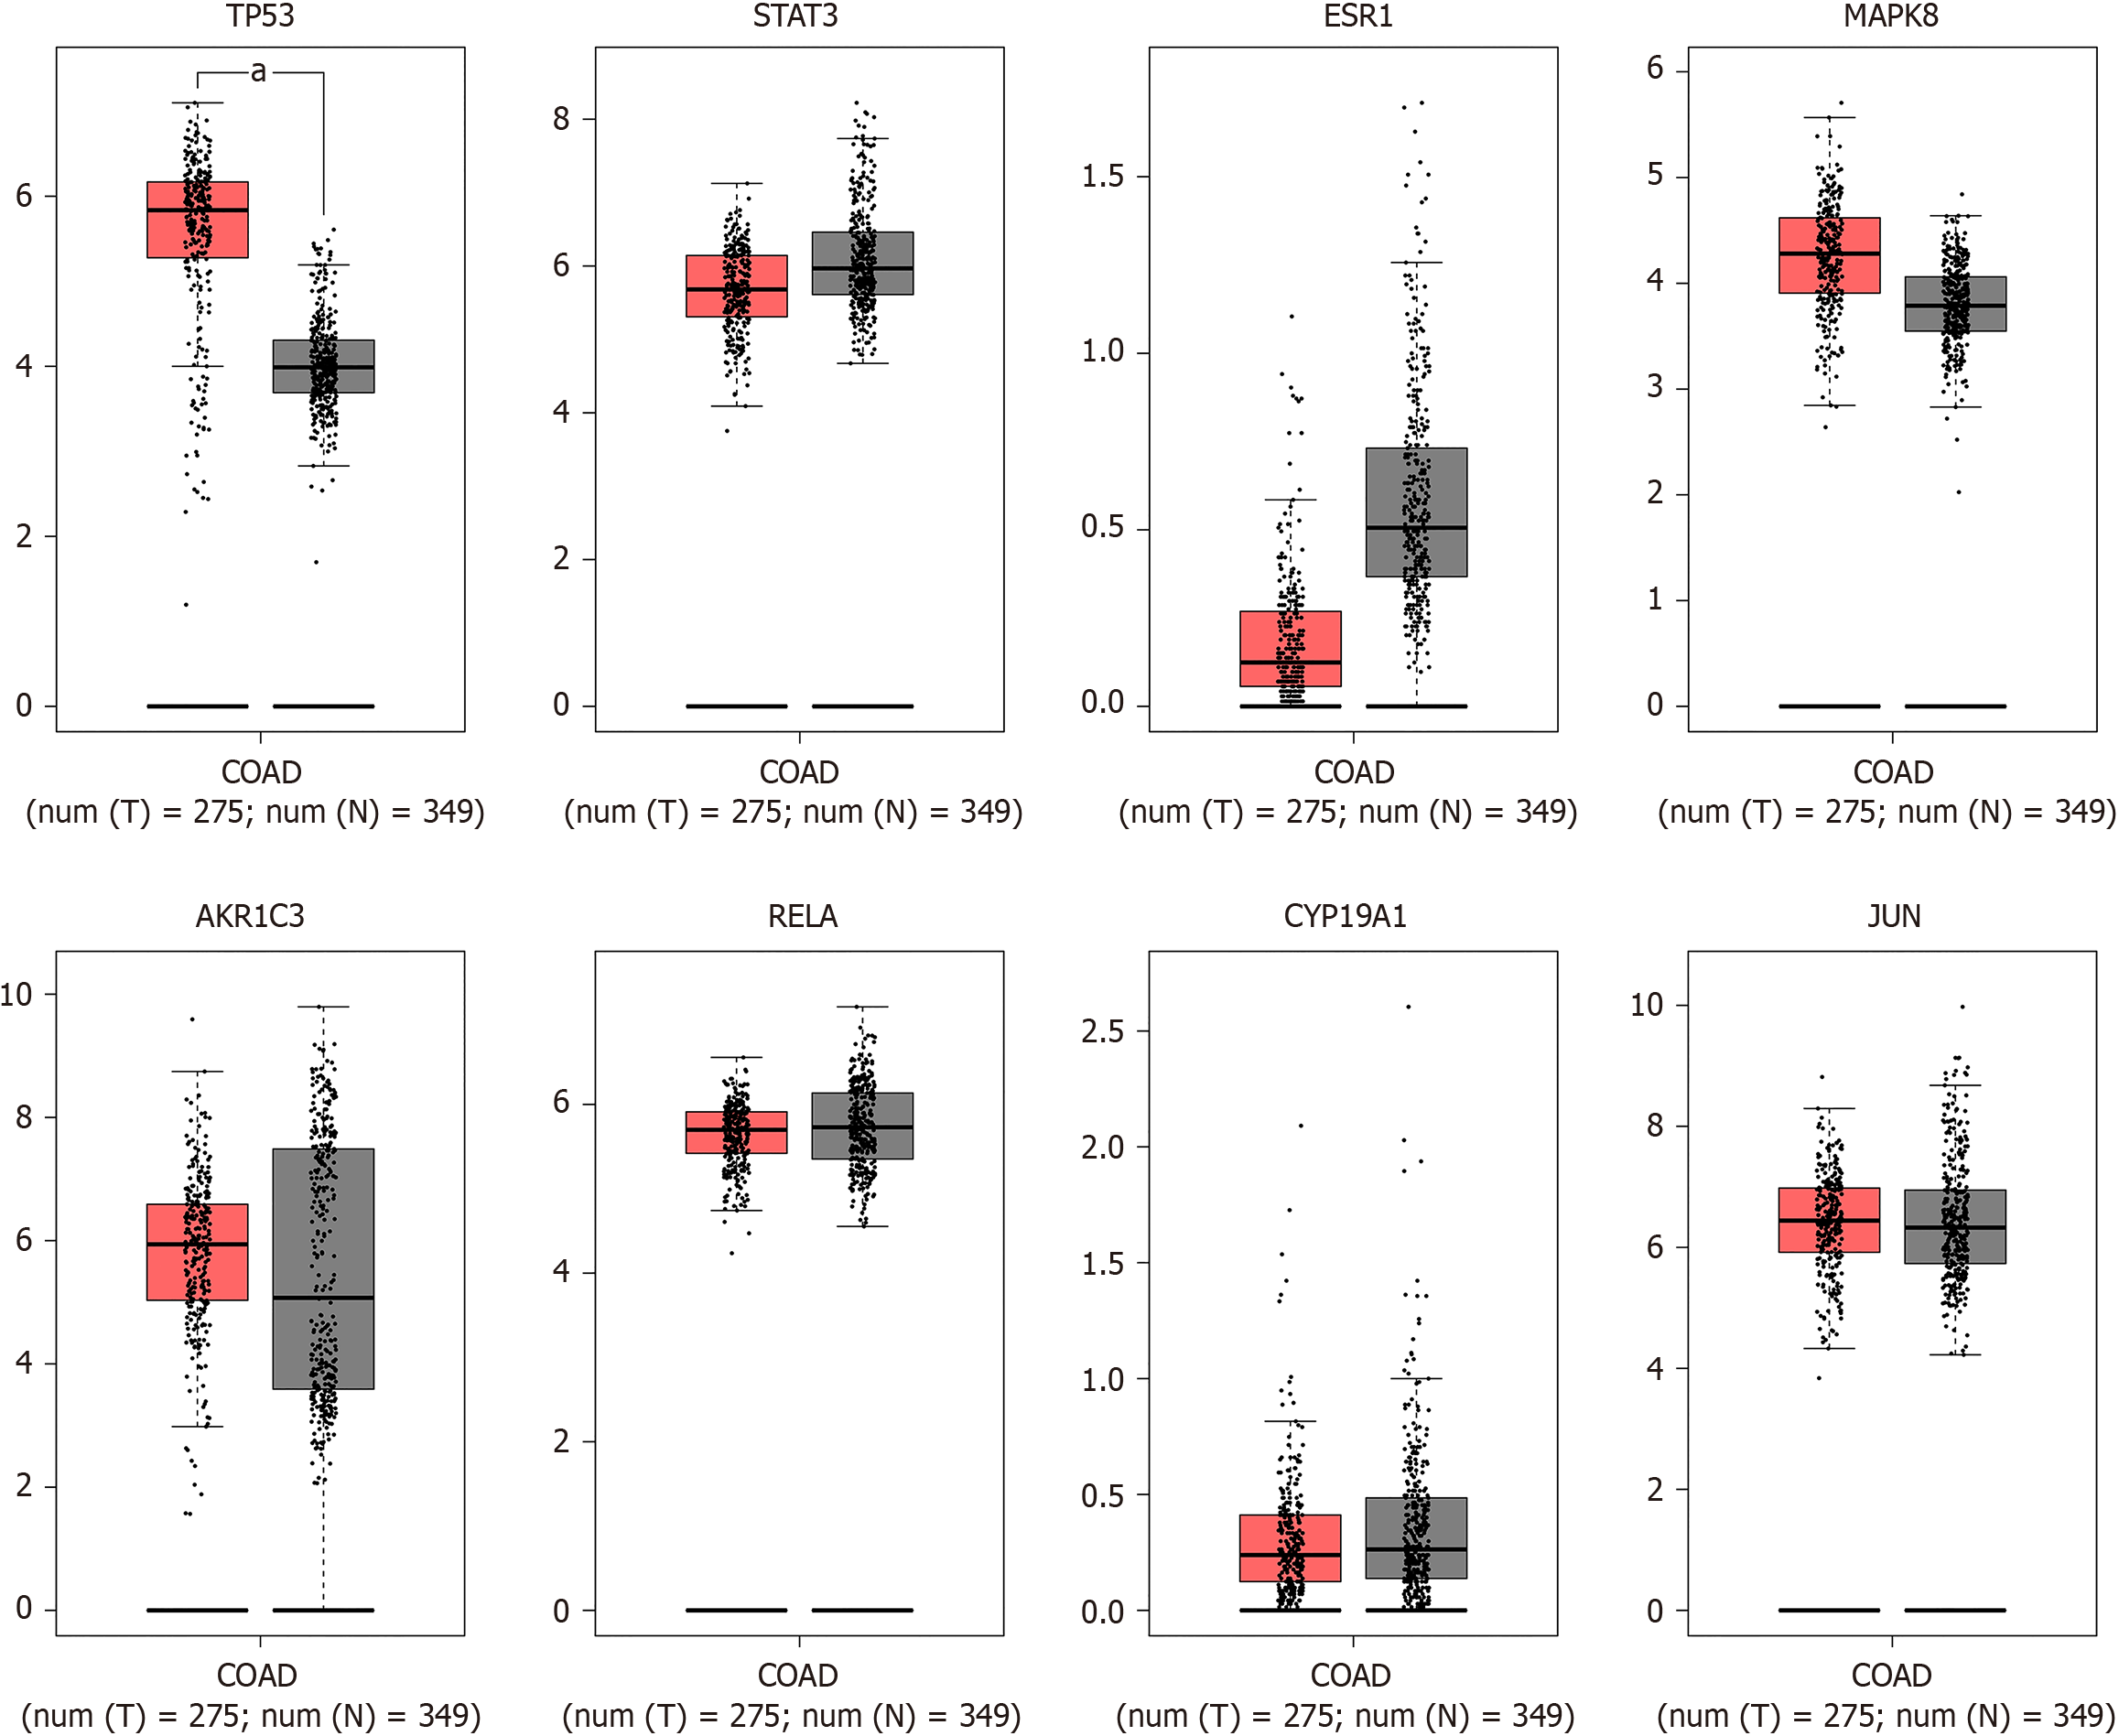
Figure 3 The expression of hub genes in colon adenocarcinoma patients.
Gene expression data from 275 colon adenocarcinoma (COAD) and 349 normal colon cases in the TCGA and GTXx database was used to relationship between the gene expression and the patients prognosis. Compared with the normal groups, the expression of TP53 was significantly increased in the COAD tissues (aP < 0.05) but there were no statistically significant differences in the expressions of STAT3, ESR1, MAPK8, AKR1C3, RELA, CYP19A1 and JUN in the COAD tissues (P > 0.05).
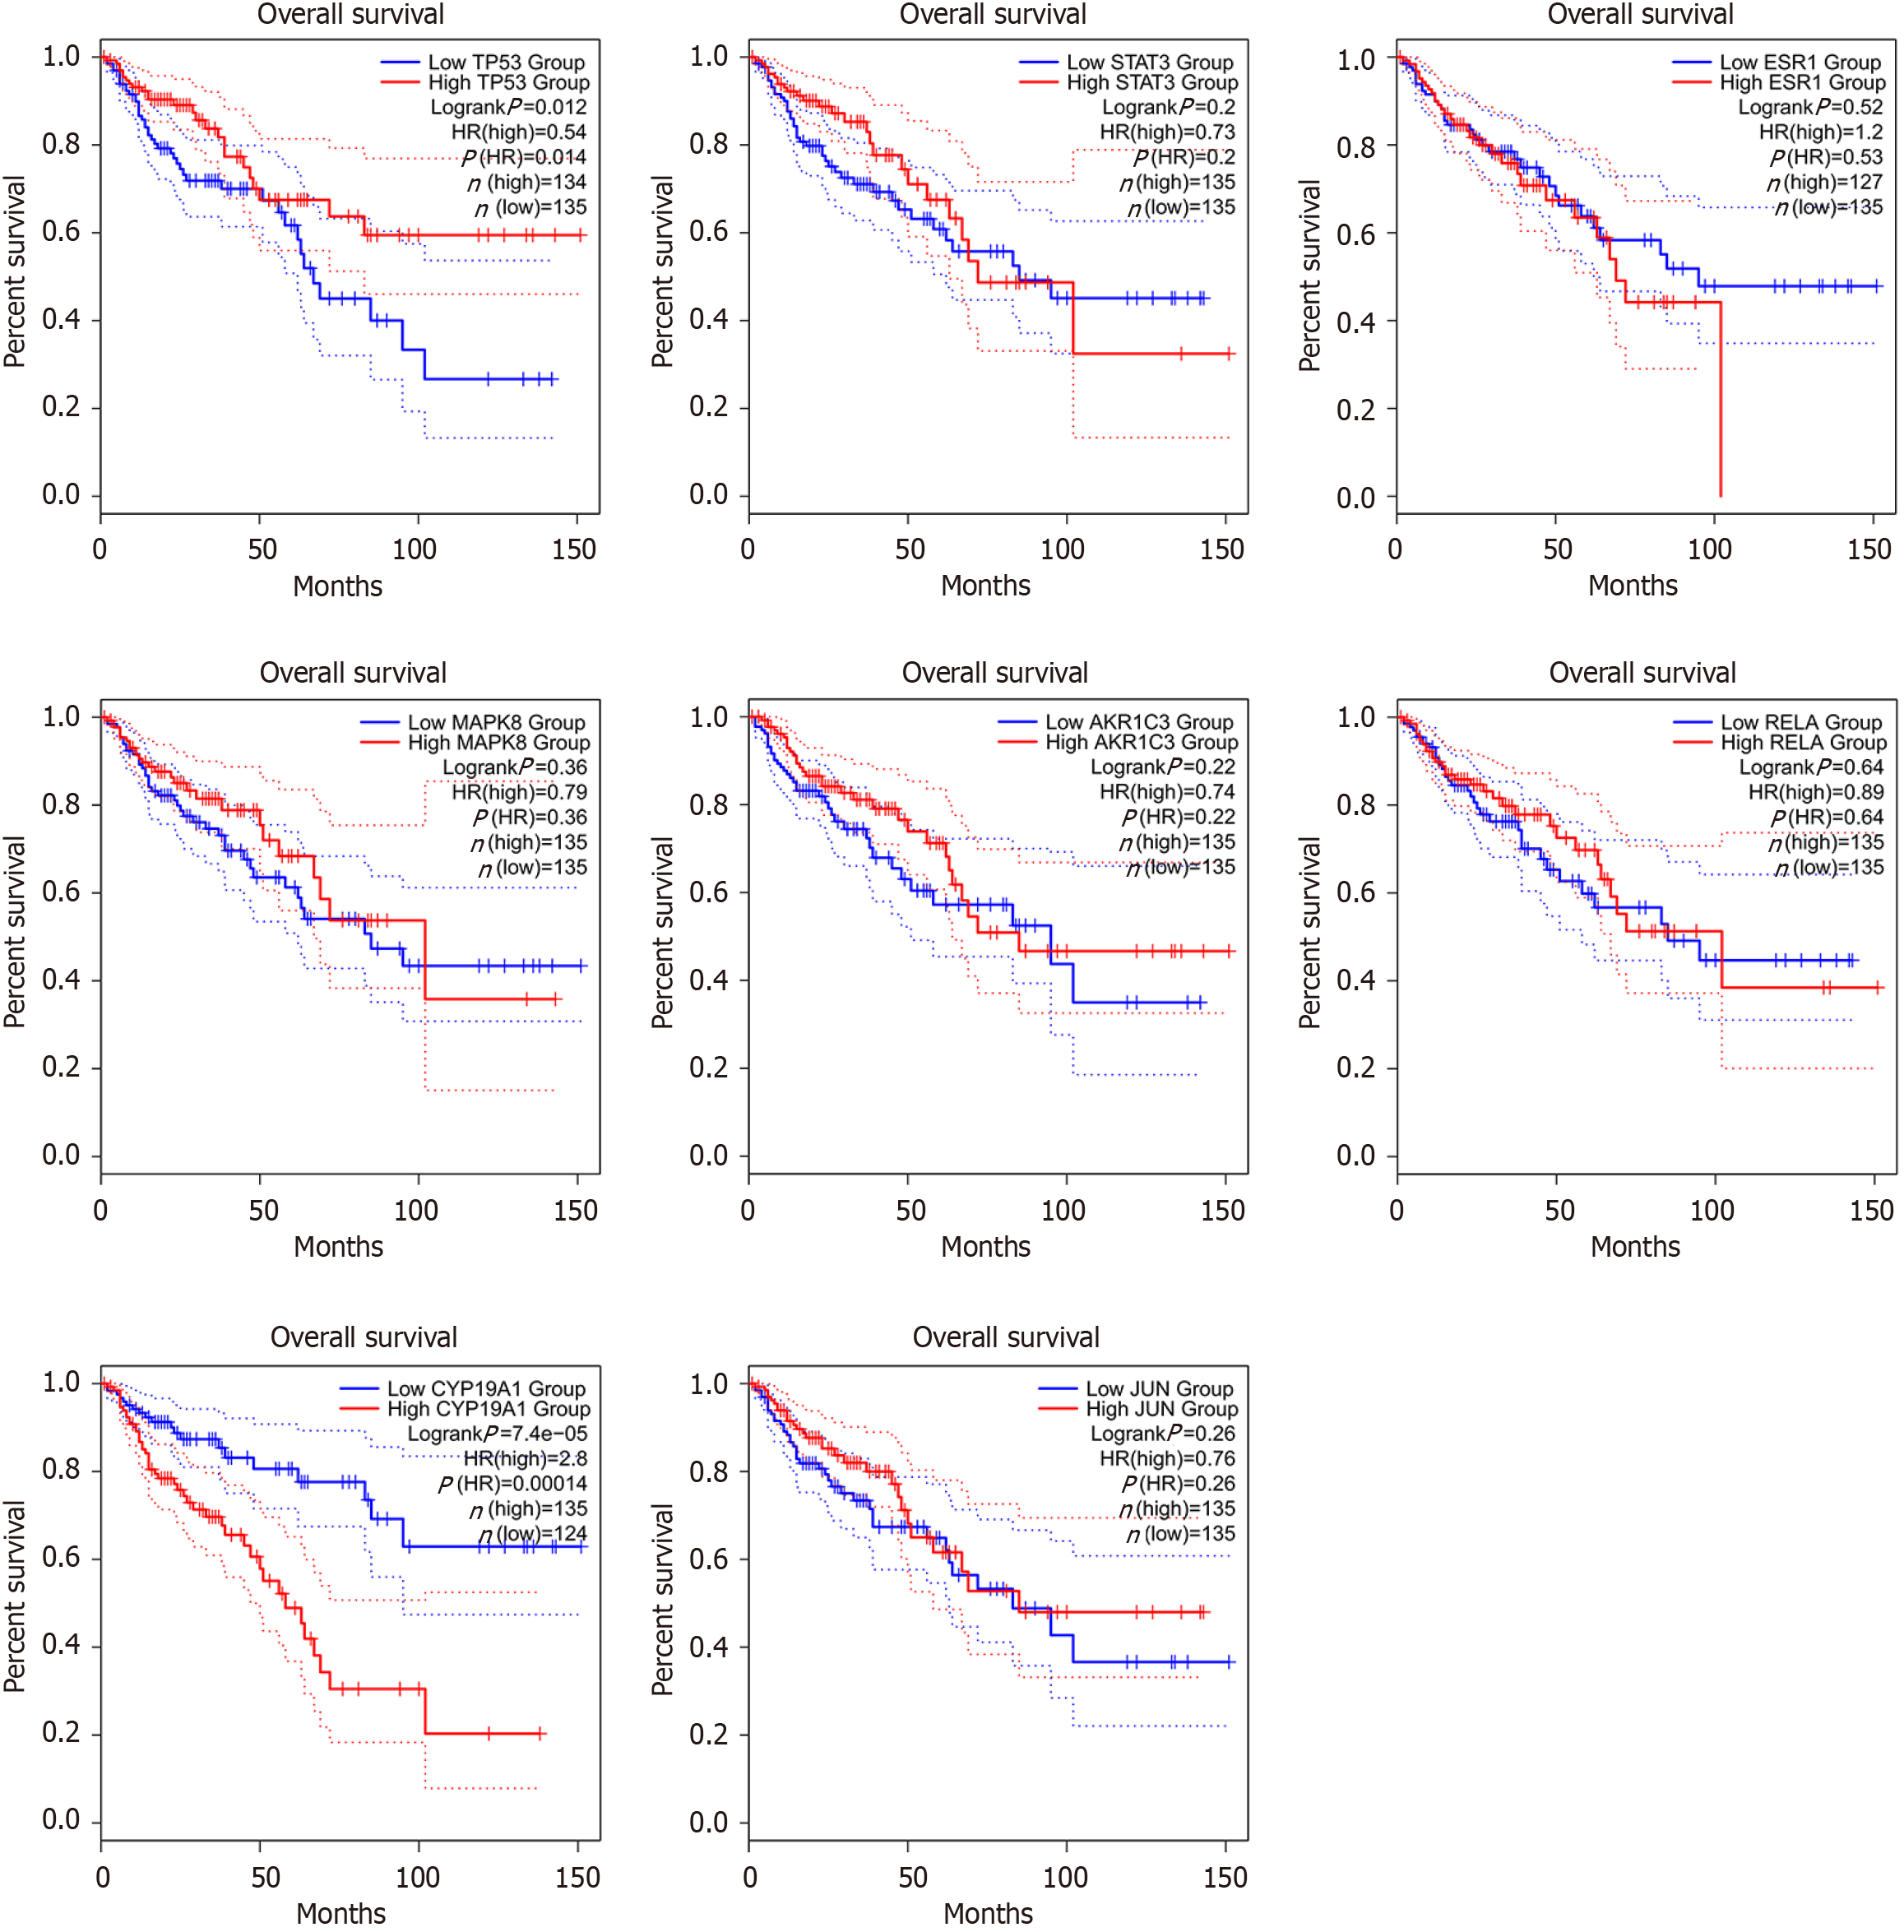
Figure 4 The relationship of the hub genes with the prognosis of colon adenocarcinoma patients.
Kaplan-Meier survival curves were plotted to evaluate the relationship of the hub genes with the prognosis of colon adenocarcinoma (COAD) patients. The blue line represented the low-expression group, and the red line represented the high-expression group. In COAD patients with high expression of CYP19A1 and TP53, the overall survival was shorter than that in the lower expression patients which was statistically significant [p(HR) < 0.05].
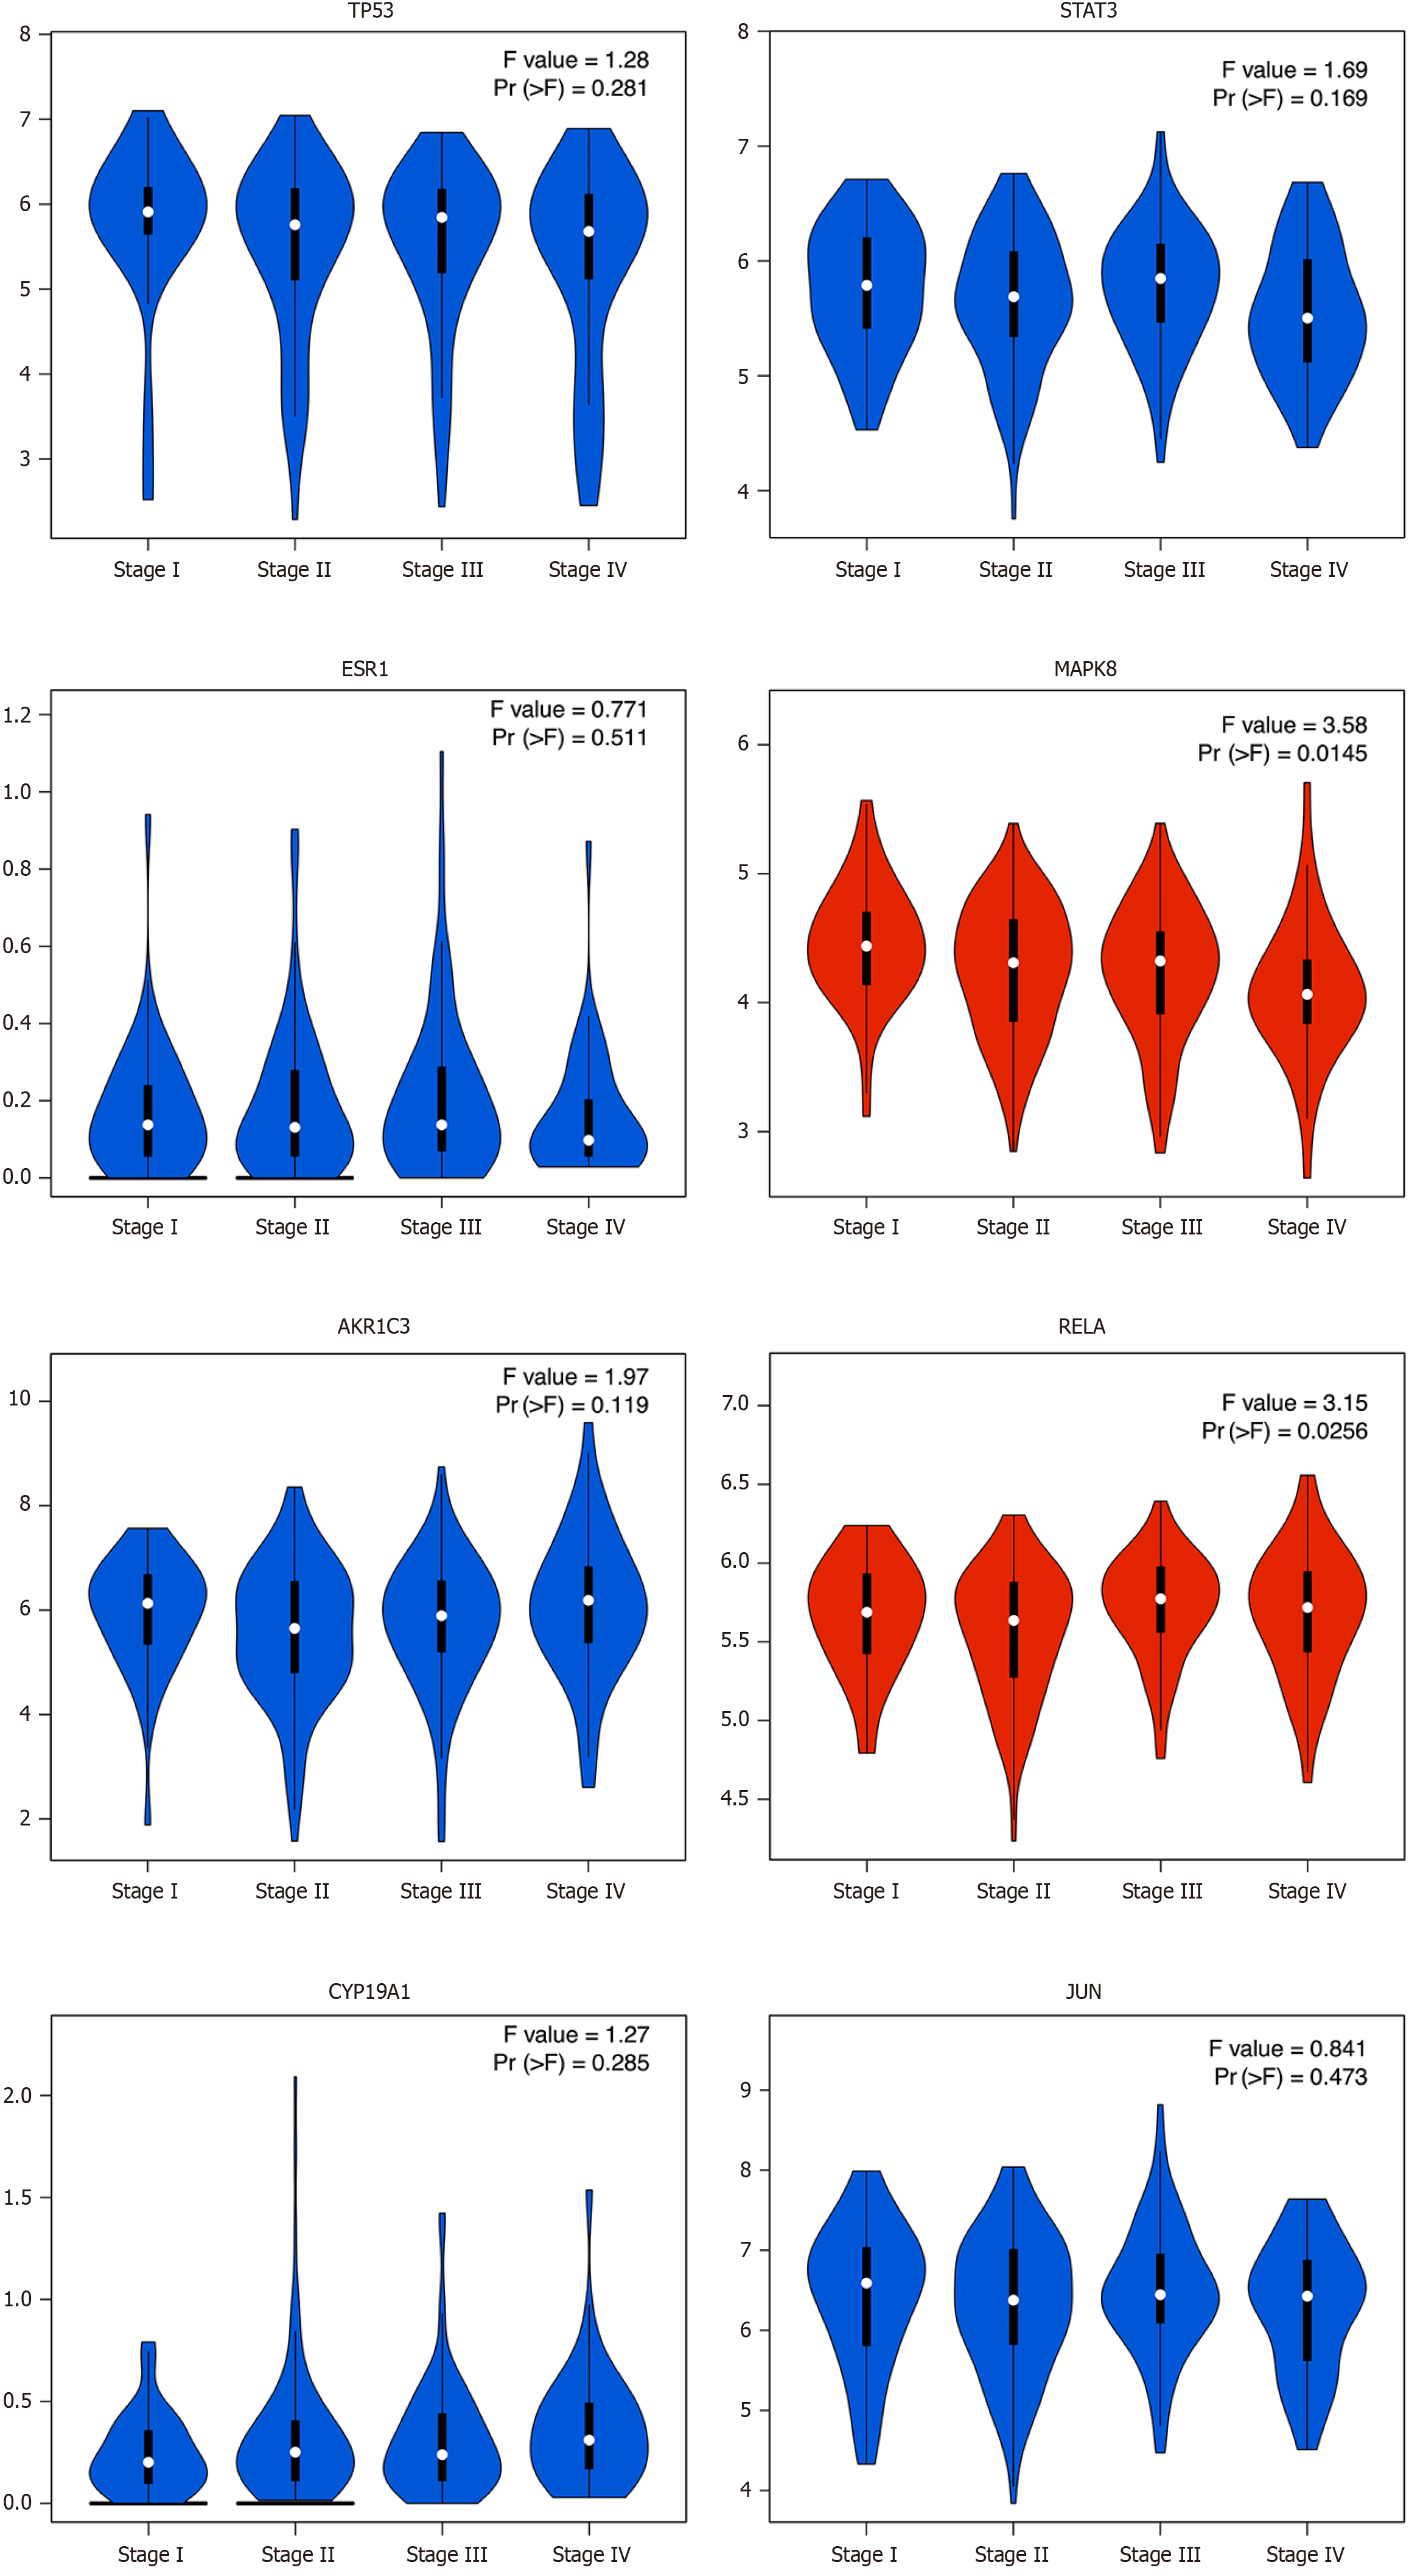
Figure 5 The relationship of the hub genes with the stage of colon adenocarcinoma patients.
Violin diagrams were used to represent the relationship of the hub genes with the stage of colon adenocarcinoma patients. Pr (> F) value < 0.05 was considered statistically significant which was red in the figure.
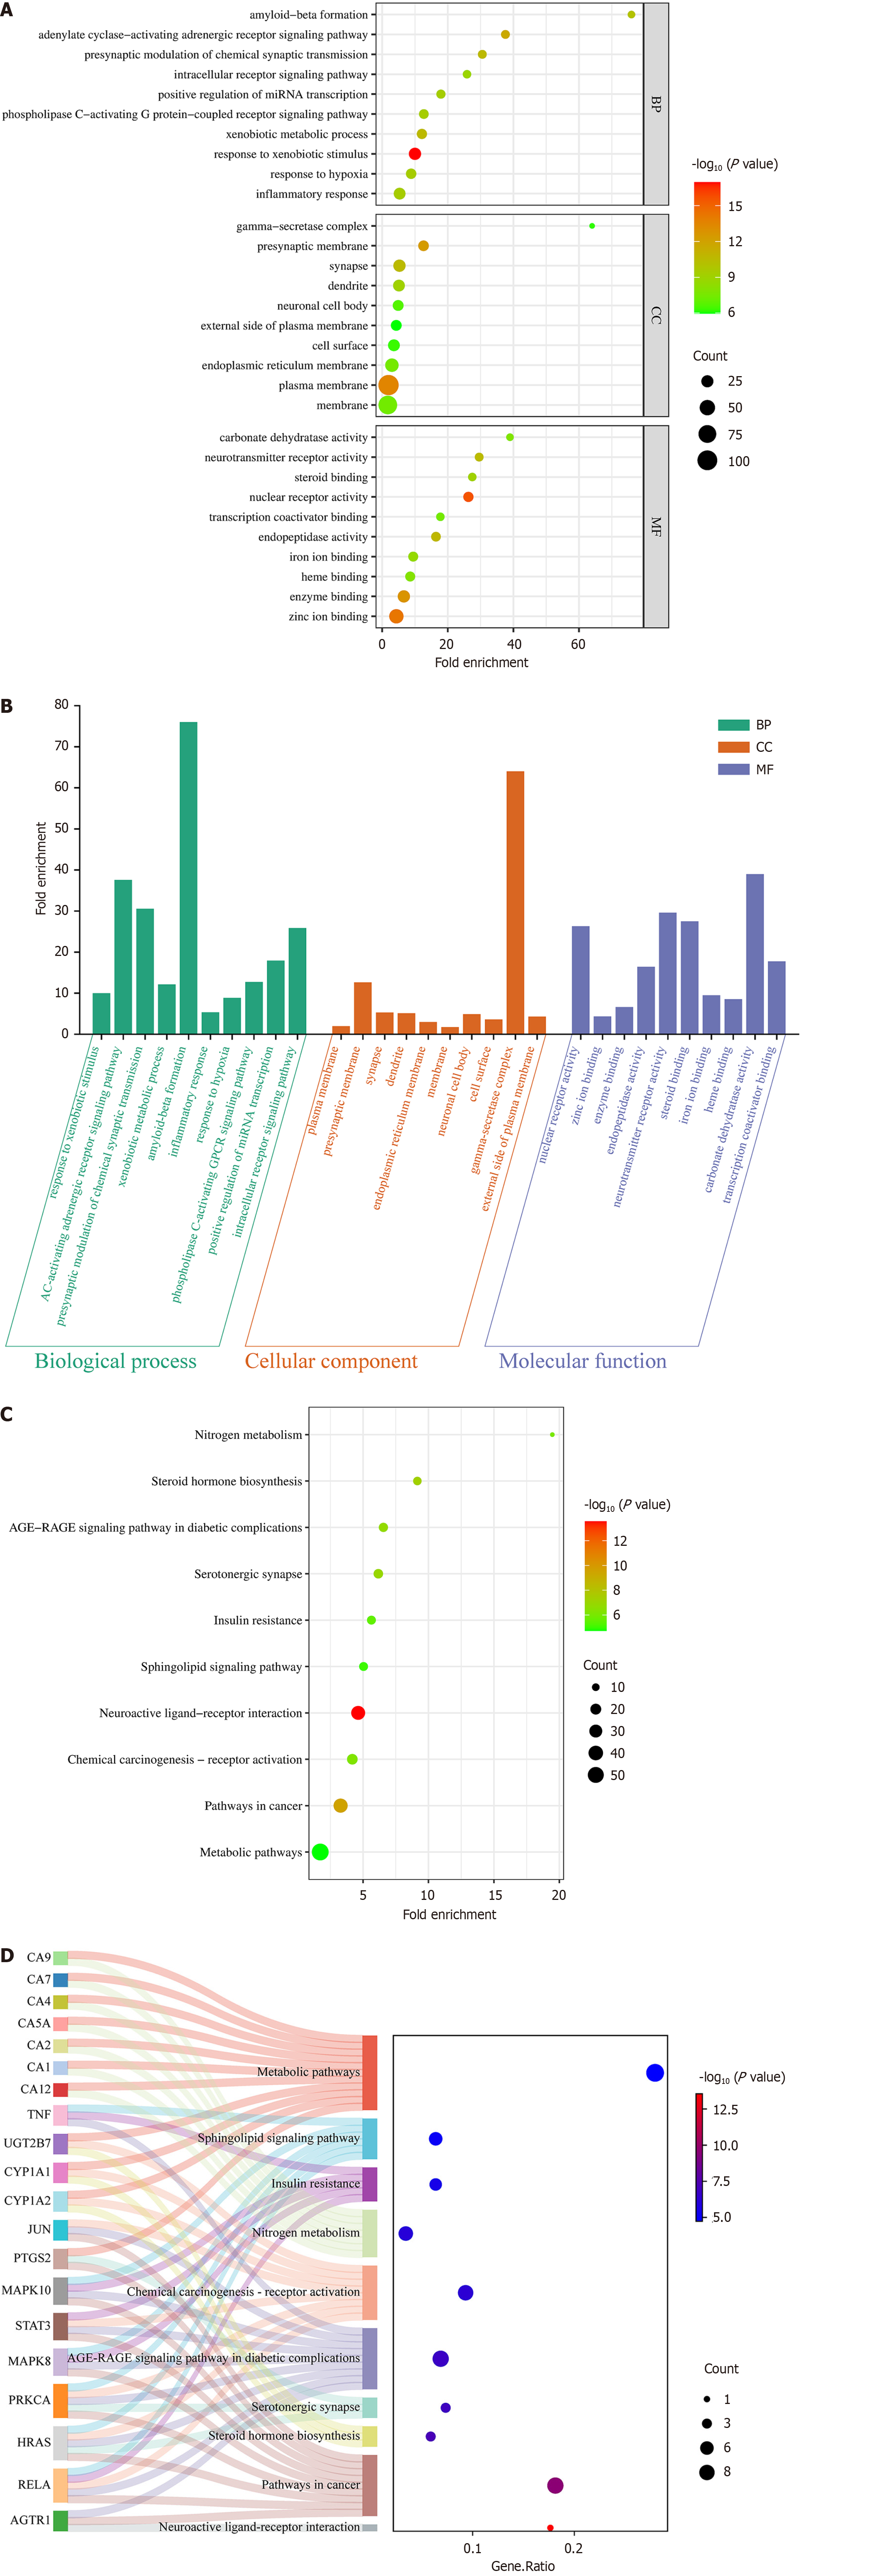
Figure 6 Go function and KEGG pathway enrichment analyses.
A: Bubble plot of GO function enrichment analysis of the key targets; B: Bar plot of GO function enrichment analysis of the key targets; C: Bubble plot of KEGG pathway enrichment analysis of the key targets; D: Sankey diagram of KEGG pathway enrichment analysis of the key targets. BP: Biological process; CC: Cellular component; MF: Molecular function.
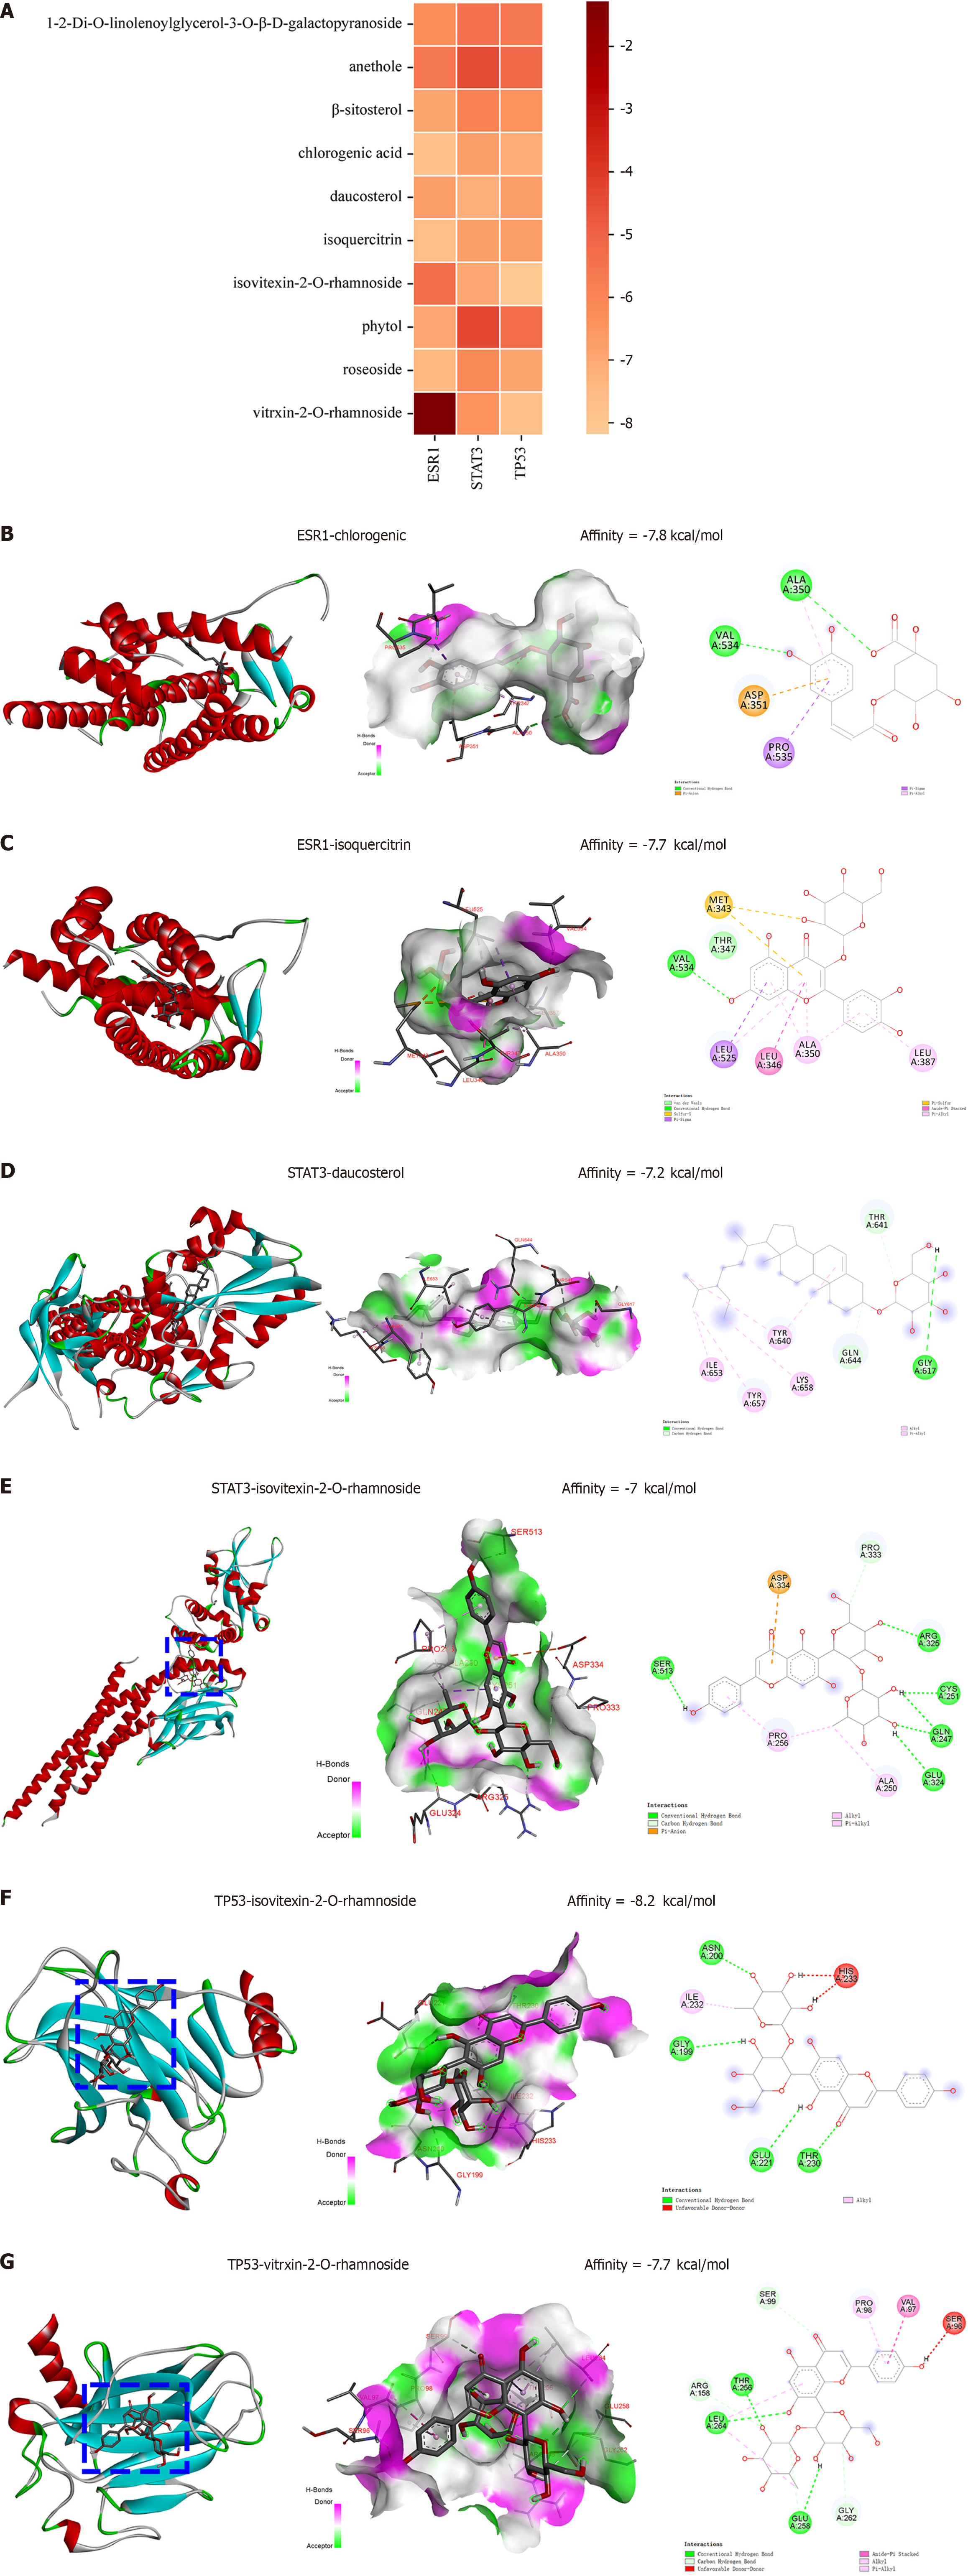
Figure 7 Molecular docking analysis of ten active ingredients with TP53, STAT3 and ESR1.
A: Heap map of binding ability between the ten active ingredients and three target proteins (kcal/mol); B: Interaction diagram between ESR1 and chlorogenic; C: Interaction diagram between ESR1 and isoquercitrin; D: Interaction diagram between STAT3 and daucosterol; E: Interaction diagram between STAT3 and isovitexin-2-O-rhamnoside; F: Interaction diagram between TP53 and isovitexin-2-O-rhamnoside; G: Interaction diagram between TP53 and vitrxin-2-O-rhamnoside.
- Citation: Dong YD, Wu XM, Liu WQ, Hu YW, Zhang H, Fang WD, Luo Q. Potential mechanism of Camellia luteoflora against colon adenocarcinoma: An integration of network pharmacology and molecular docking. World J Gastrointest Oncol 2025; 17(6): 105782
- URL: https://www.wjgnet.com/1948-5204/full/v17/i6/105782.htm
- DOI: https://dx.doi.org/10.4251/wjgo.v17.i6.105782


