Copyright
©The Author(s) 2025.
World J Gastrointest Oncol. Jun 15, 2025; 17(6): 105782
Published online Jun 15, 2025. doi: 10.4251/wjgo.v17.i6.105782
Published online Jun 15, 2025. doi: 10.4251/wjgo.v17.i6.105782
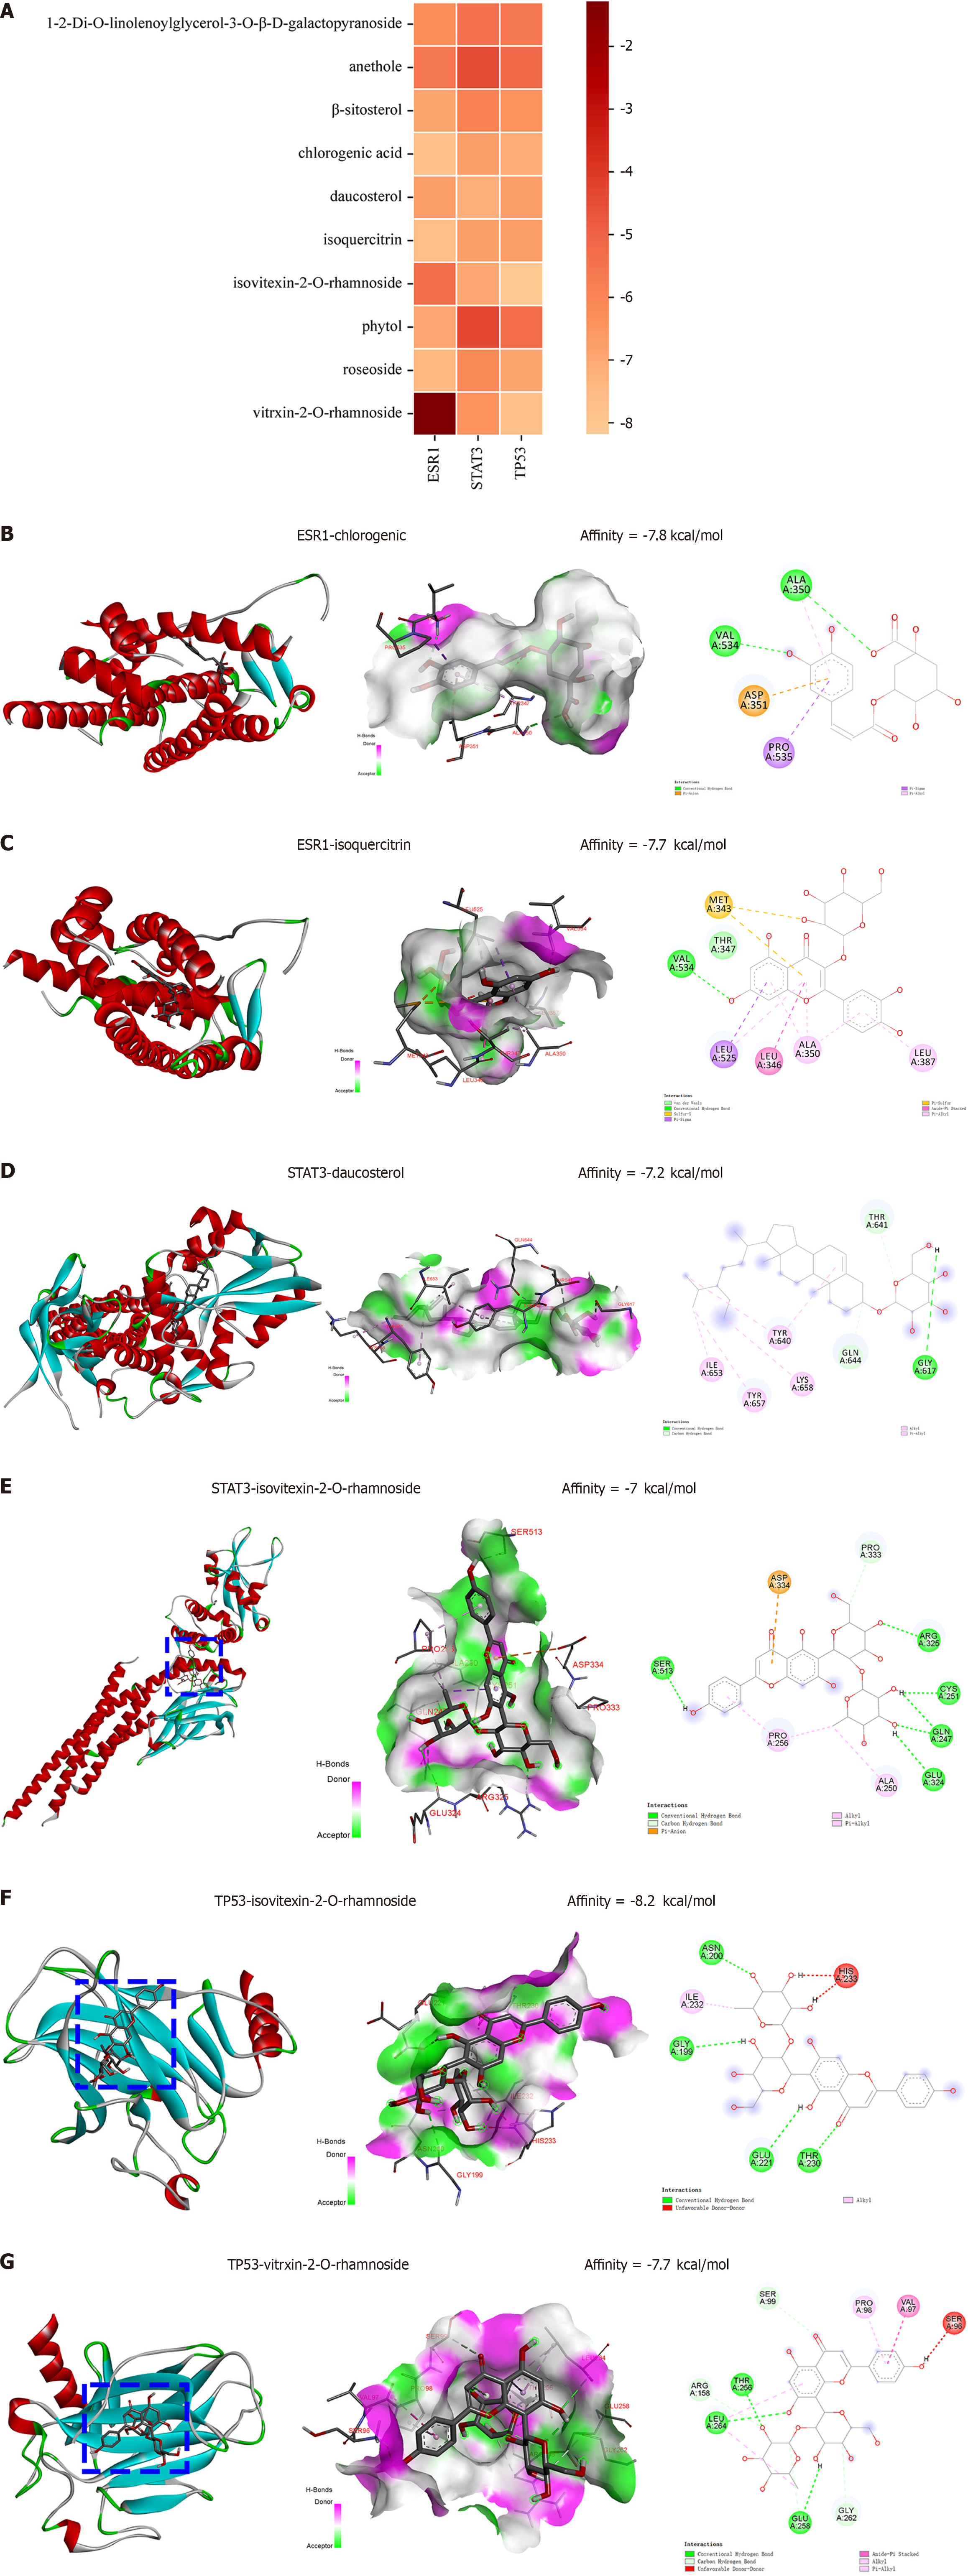
Figure 7 Molecular docking analysis of ten active ingredients with TP53, STAT3 and ESR1.
A: Heap map of binding ability between the ten active ingredients and three target proteins (kcal/mol); B: Interaction diagram between ESR1 and chlorogenic; C: Interaction diagram between ESR1 and isoquercitrin; D: Interaction diagram between STAT3 and daucosterol; E: Interaction diagram between STAT3 and isovitexin-2-O-rhamnoside; F: Interaction diagram between TP53 and isovitexin-2-O-rhamnoside; G: Interaction diagram between TP53 and vitrxin-2-O-rhamnoside.
- Citation: Dong YD, Wu XM, Liu WQ, Hu YW, Zhang H, Fang WD, Luo Q. Potential mechanism of Camellia luteoflora against colon adenocarcinoma: An integration of network pharmacology and molecular docking. World J Gastrointest Oncol 2025; 17(6): 105782
- URL: https://www.wjgnet.com/1948-5204/full/v17/i6/105782.htm
- DOI: https://dx.doi.org/10.4251/wjgo.v17.i6.105782


