Copyright
©The Author(s) 2025.
World J Gastrointest Oncol. May 15, 2025; 17(5): 105604
Published online May 15, 2025. doi: 10.4251/wjgo.v17.i5.105604
Published online May 15, 2025. doi: 10.4251/wjgo.v17.i5.105604
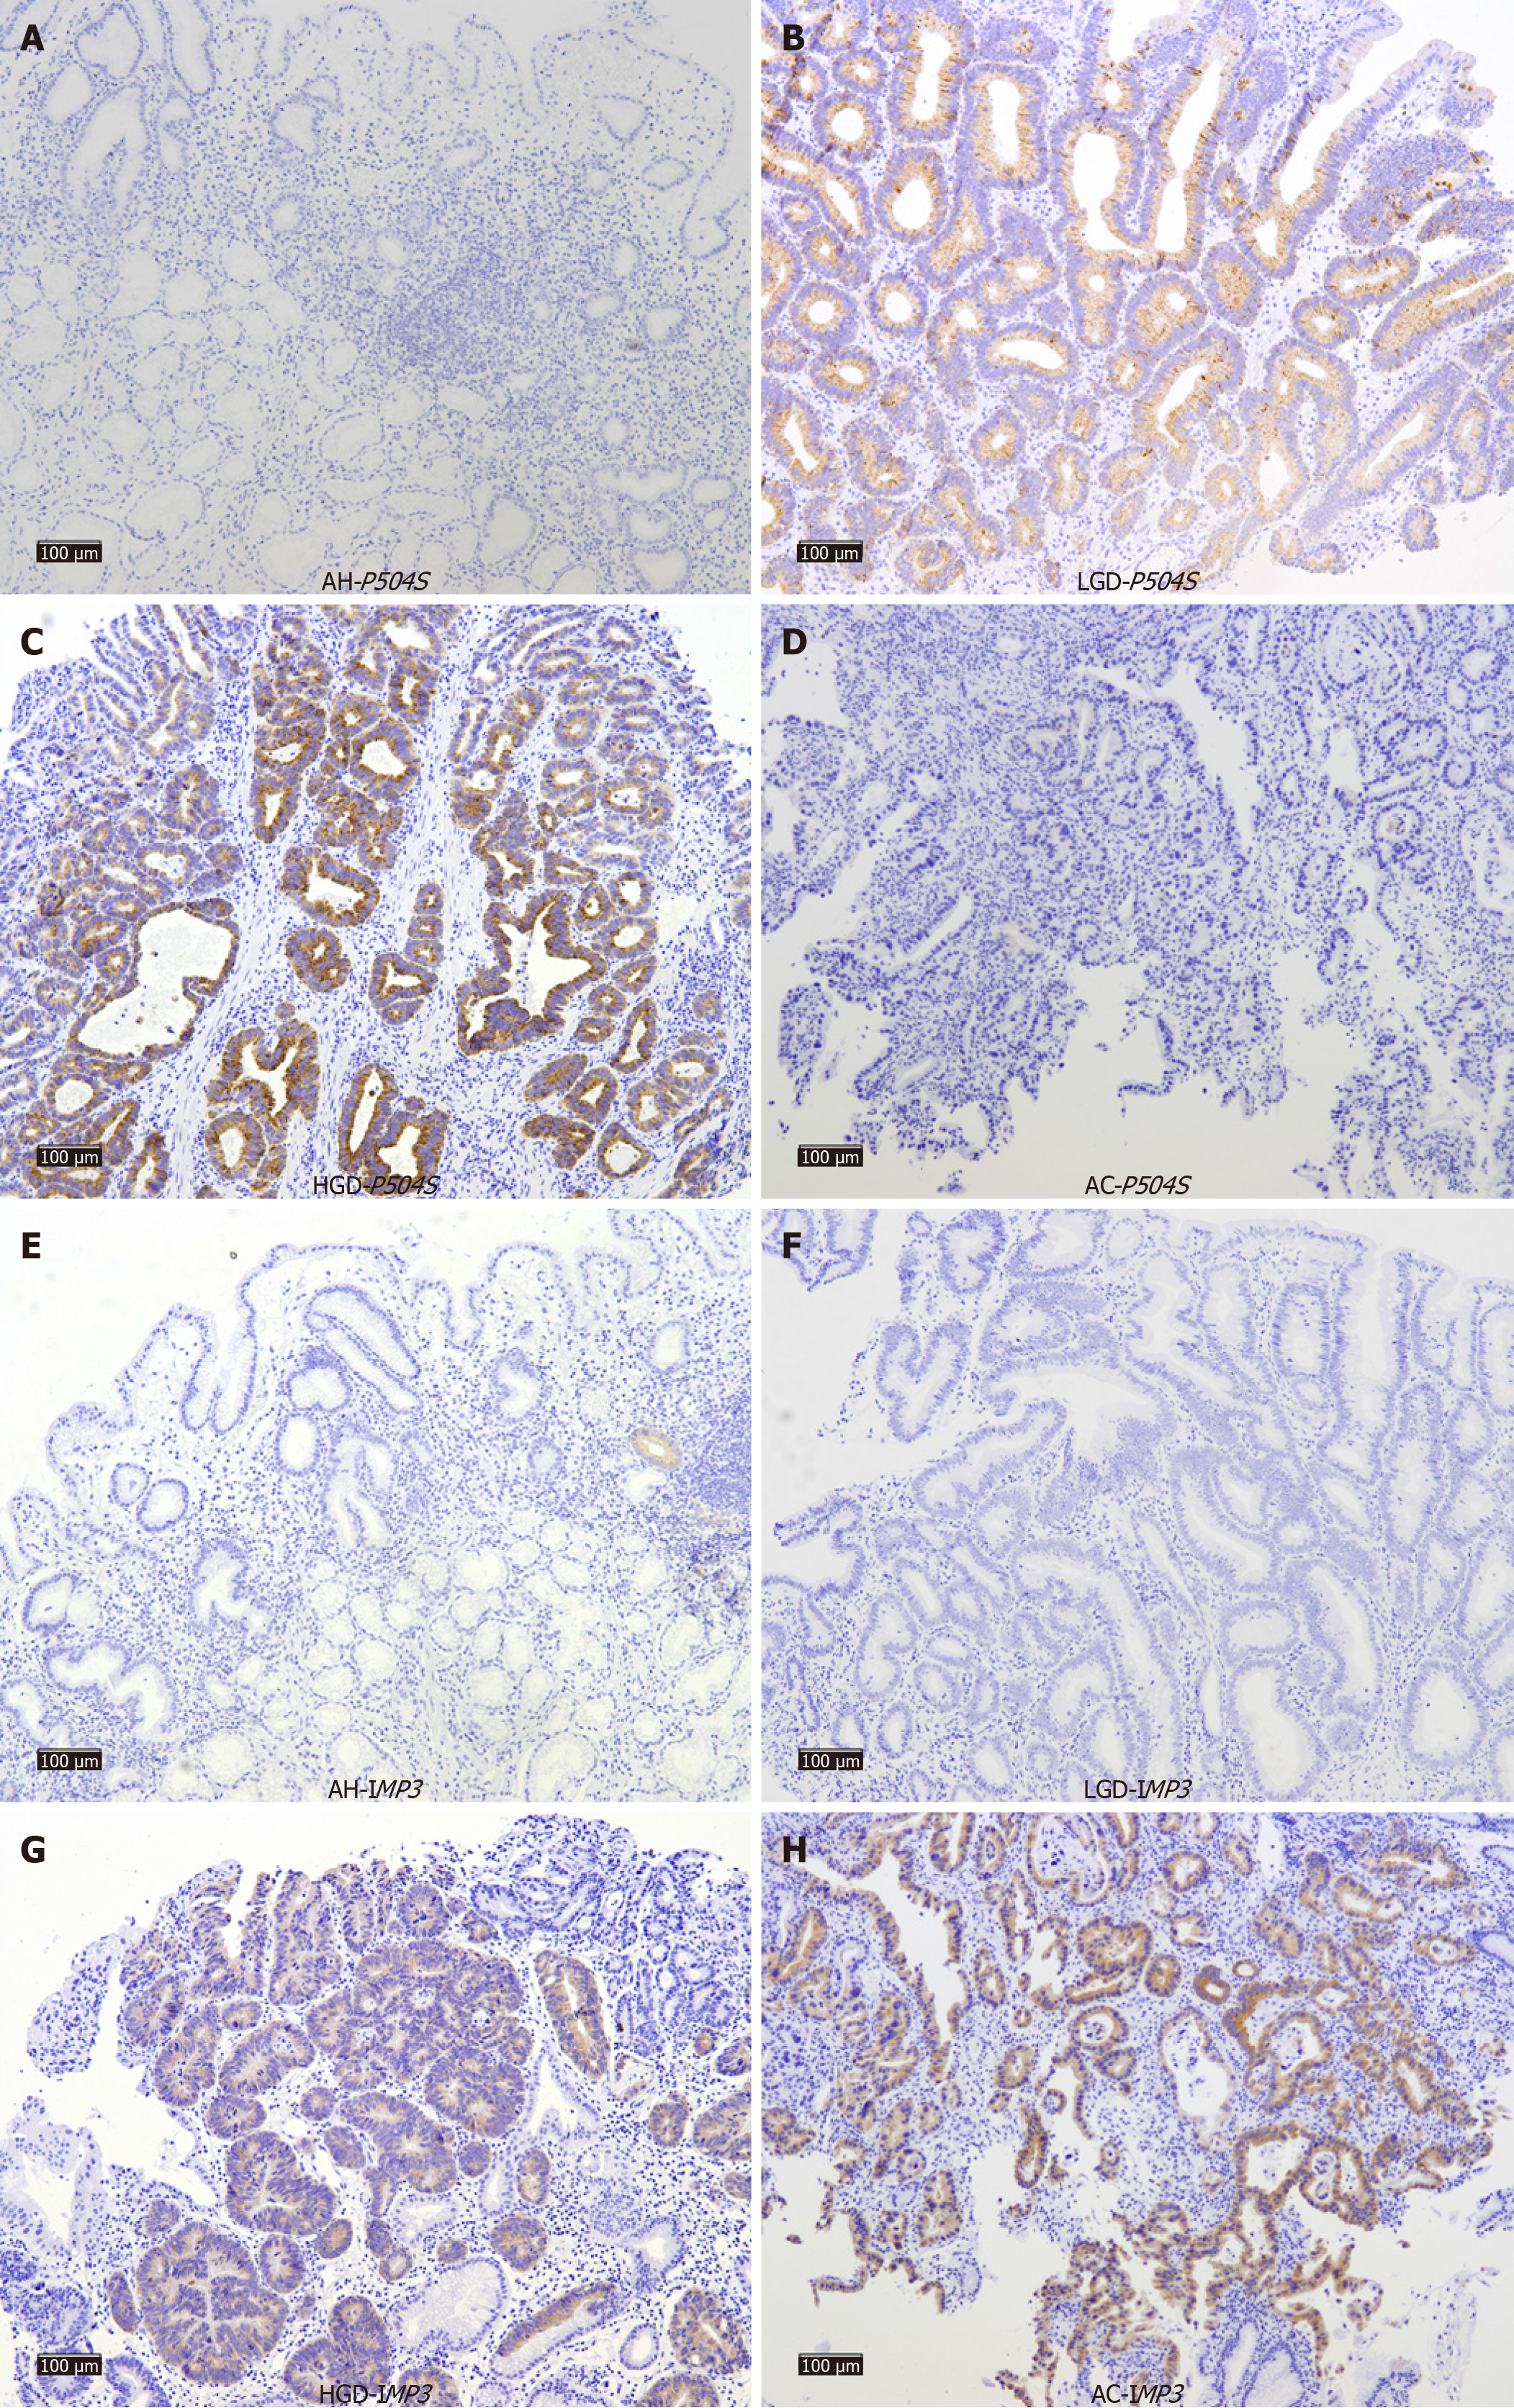
Figure 1 Expression of P504S and IMP3 in lesions of atypical hyperplasia, low-grade dysplasia, high-grade dysplasia, and adenocarci
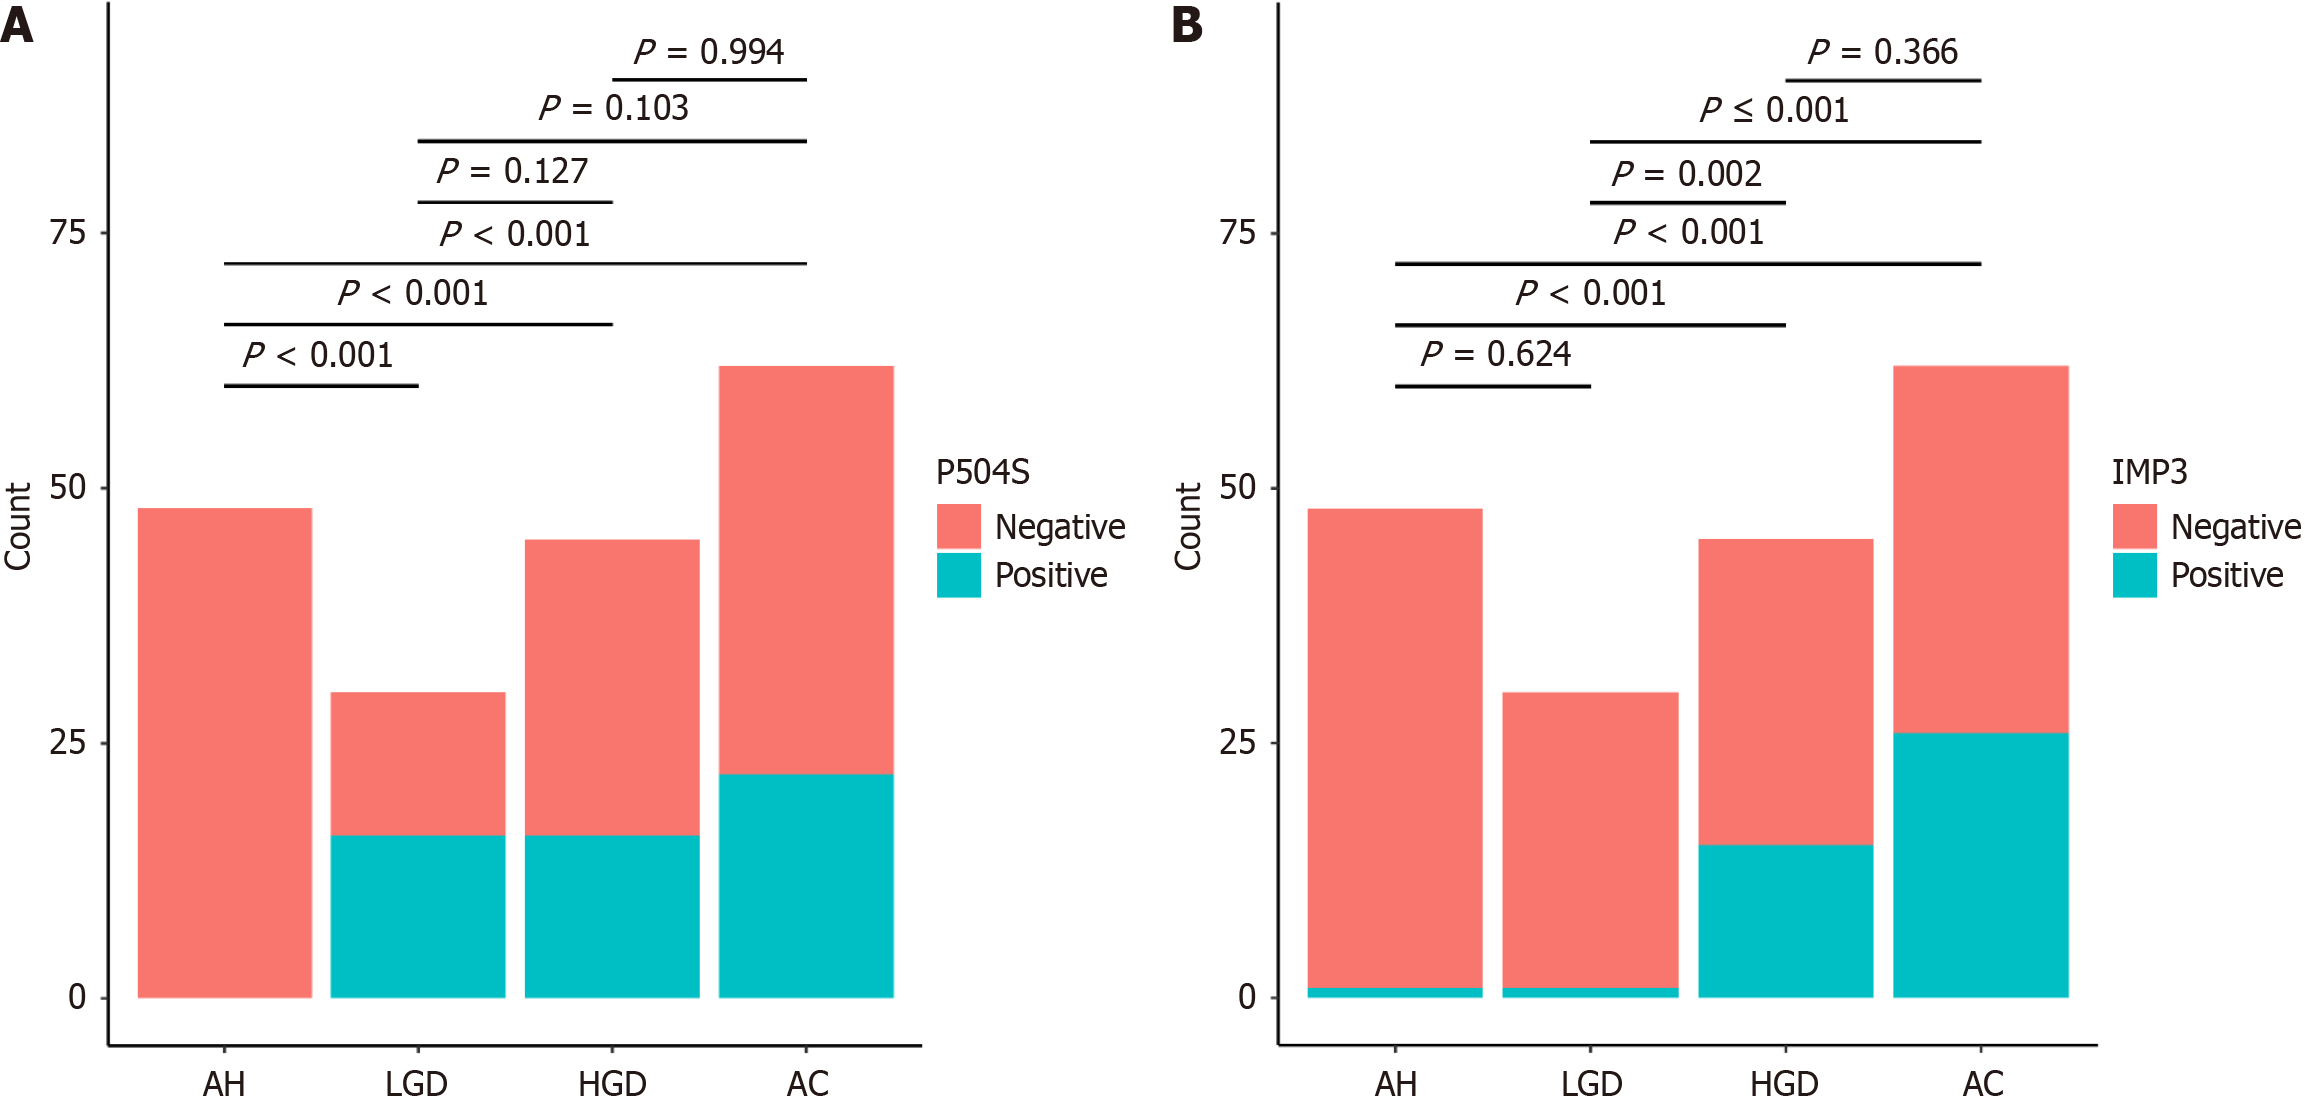
Figure 2 Differences in P504S and IMP3 expression in gastric mucosal biopsies at different stages.
A: Difference in P504S expression in gastric mucosal biopsies at different stages; B: Difference in IMP3 expression in gastric mucosal biopsies at different stages. AH: Atypical hyperplasia; LGD: Low-grade dysplasia; HGD: High-grade dysplasia; AC: Adenocarcinoma.
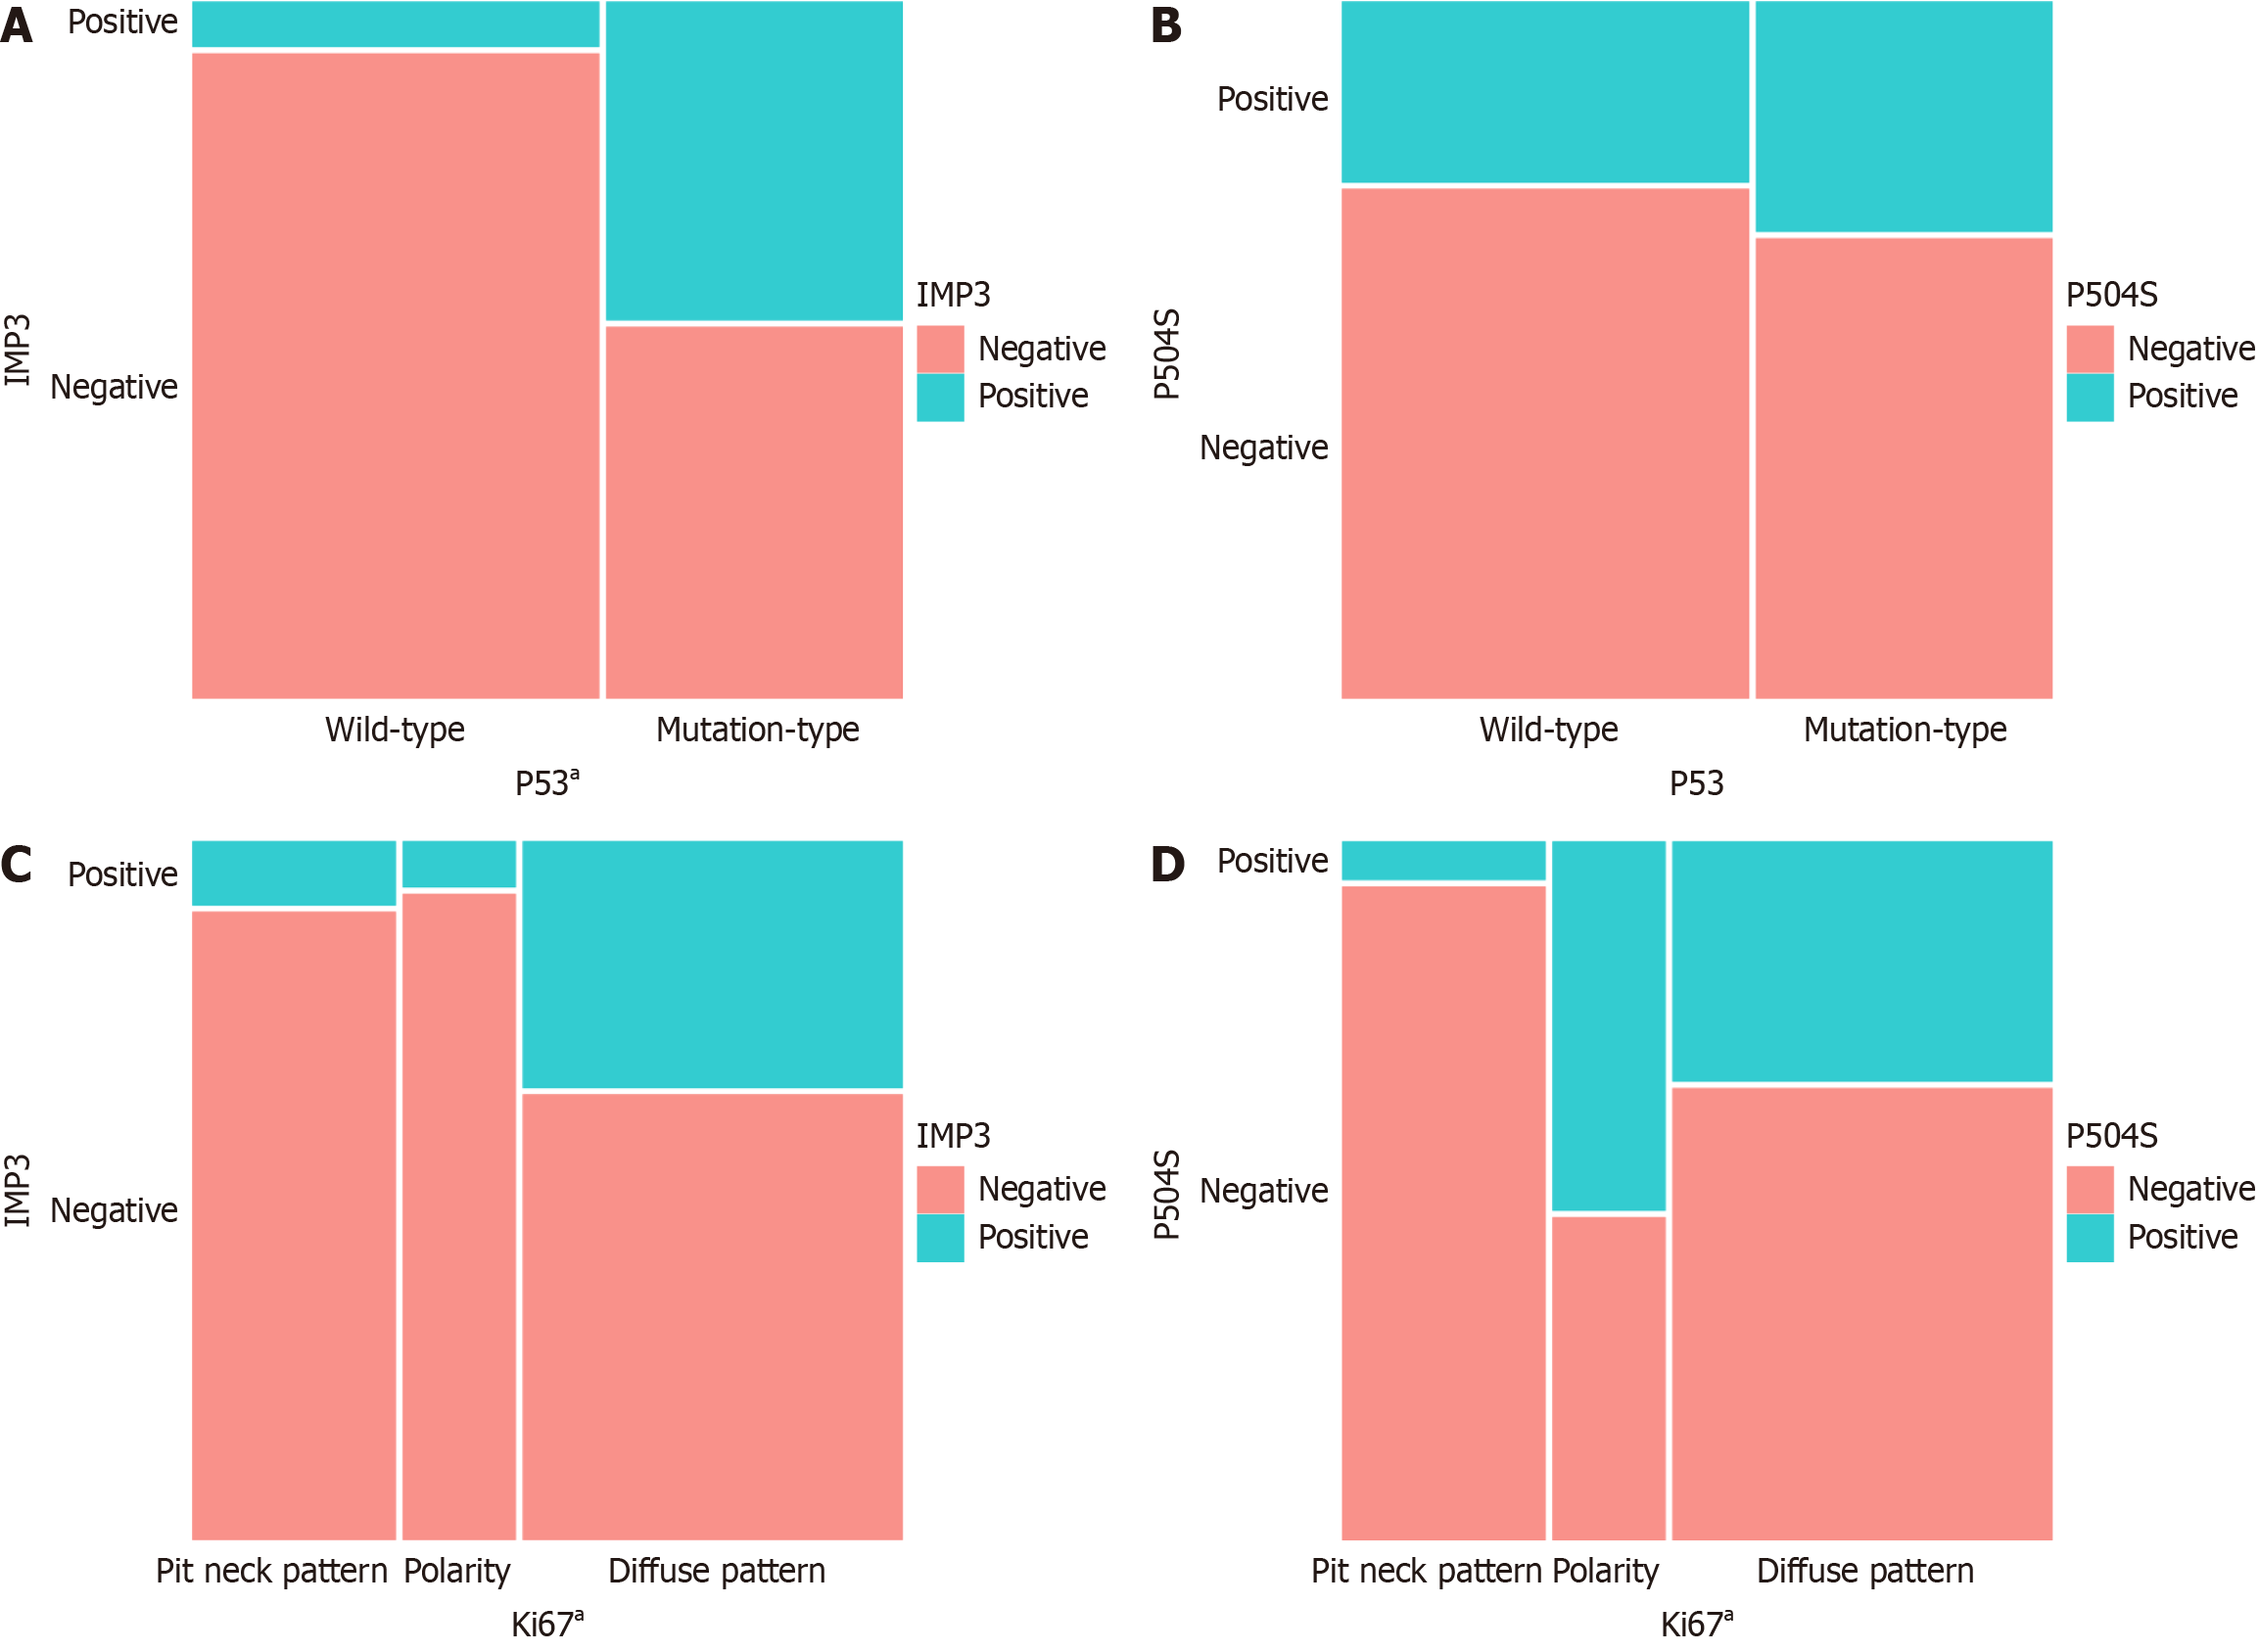
Figure 3 Correlation between expression of the four proteins in gastric mucosal biopsies.
A: Correlation between the expression of IMP3 and P53; B: Correlation between the expression of P504S and P53; C: Correlation between the expression of IMP3 and Ki67; D: Correlation between the expression of P504S and Ki67. aP value < 0.05 denotes statistical significance in the comparative analysis.
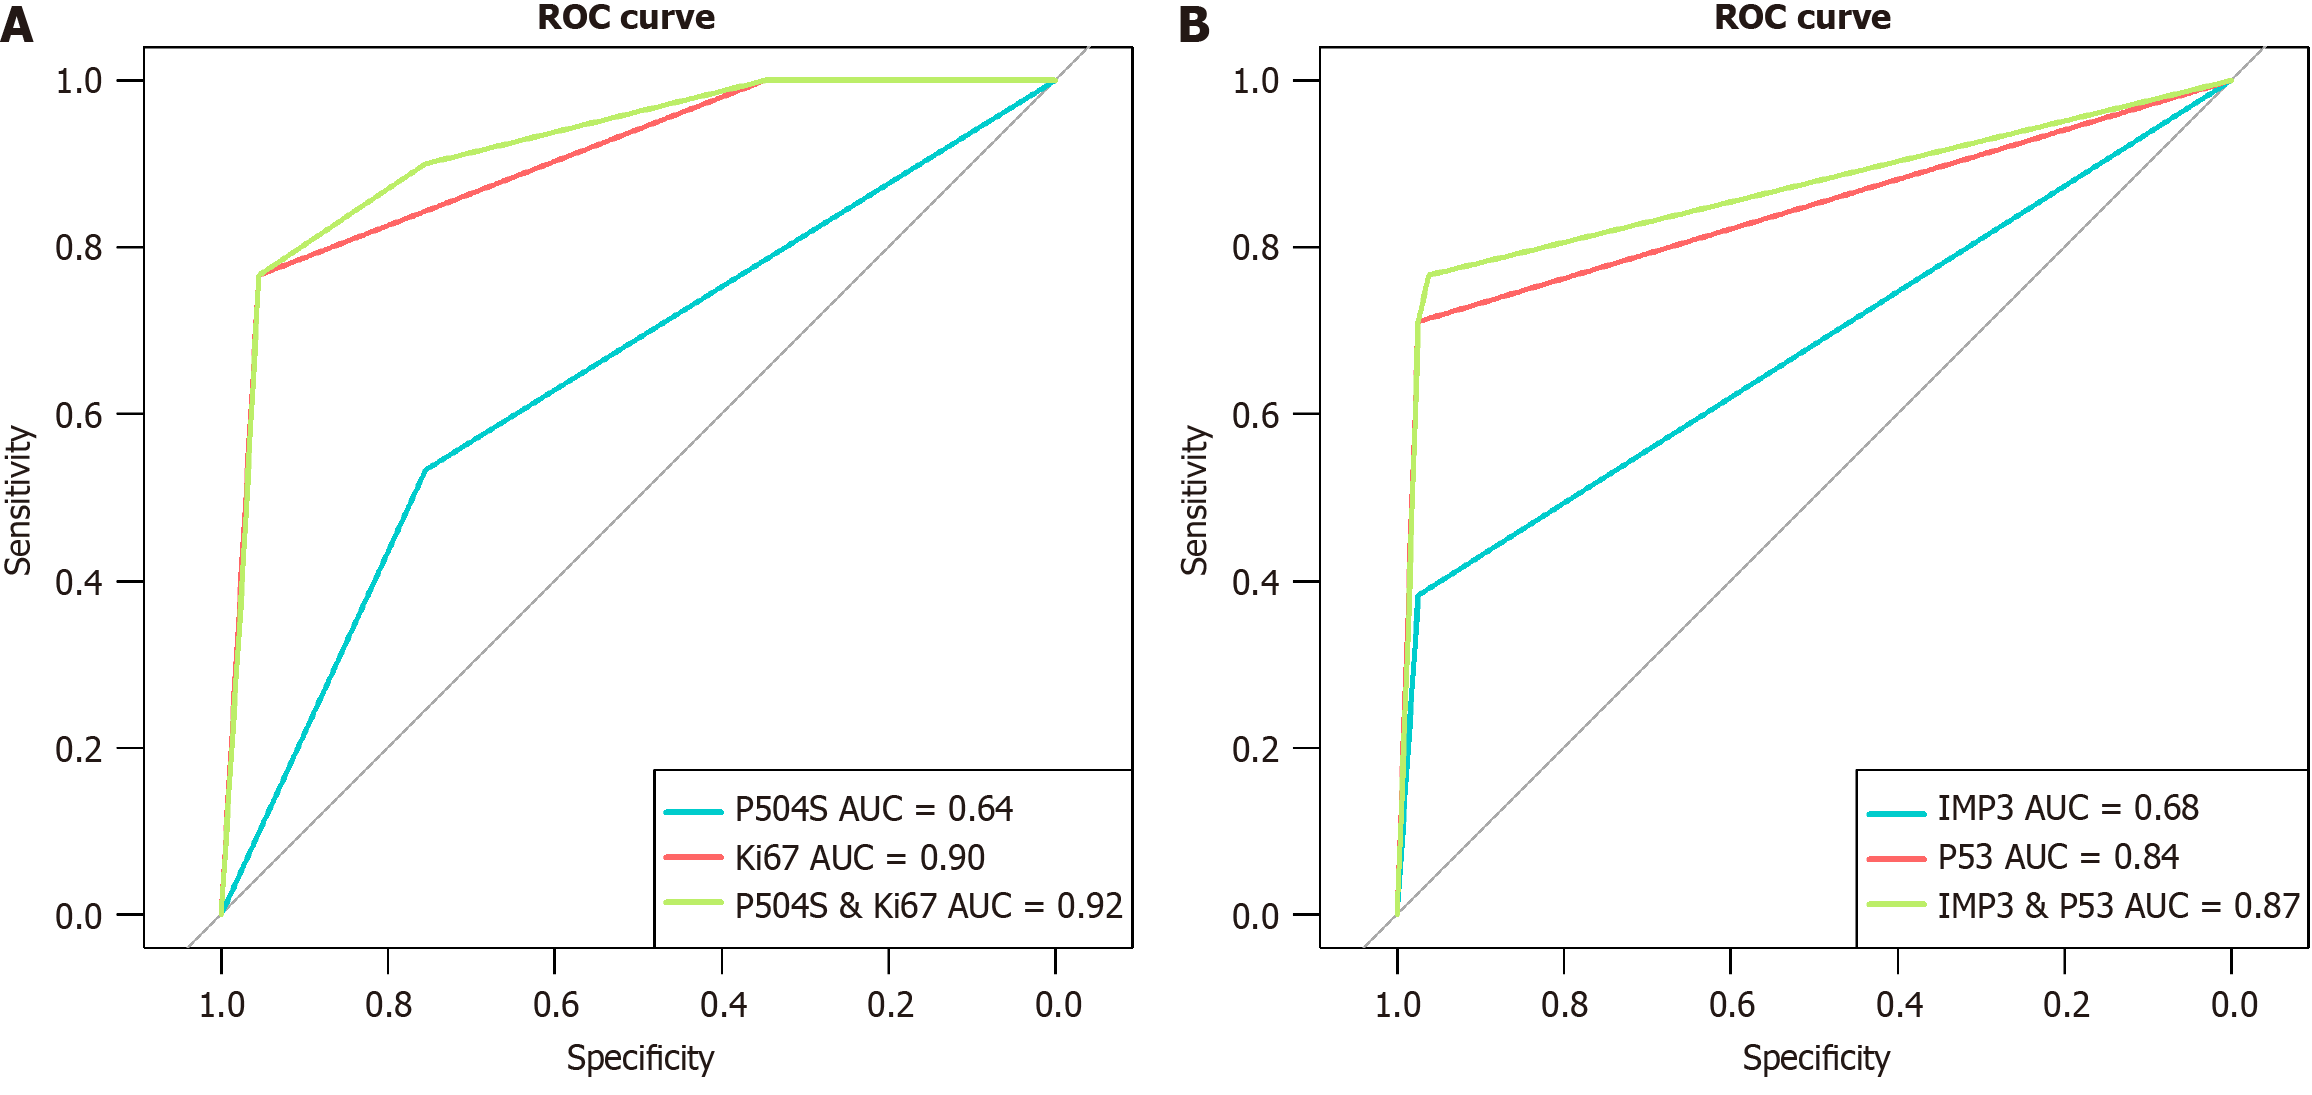
Figure 4 Receiver operating characteristic curves of the four proteins in predicting gastric mucosal biopsies.
A: Receiver operating characteristic (ROC) curves of P504S, Ki67, and their combination in predicting low-grade dysplasia; B: ROC curves of P53, IMP3, and their combination in predicting high-grade dysplasia/adenocarcinoma. ROC: Receiver operating characteristic; AUC: Area under the curve.
- Citation: Miao LF, Sun YY, Du XJ, Xu N, Shen JW, Hua H, Guo M, Yang HJ, Li JK, Zhu L. Combined detection of P53, Ki67, P504S, and IMP3: Diagnostic implications for gastric cancer and precursor lesions. World J Gastrointest Oncol 2025; 17(5): 105604
- URL: https://www.wjgnet.com/1948-5204/full/v17/i5/105604.htm
- DOI: https://dx.doi.org/10.4251/wjgo.v17.i5.105604


