Copyright
©The Author(s) 2025.
World J Gastrointest Oncol. May 15, 2025; 17(5): 102282
Published online May 15, 2025. doi: 10.4251/wjgo.v17.i5.102282
Published online May 15, 2025. doi: 10.4251/wjgo.v17.i5.102282
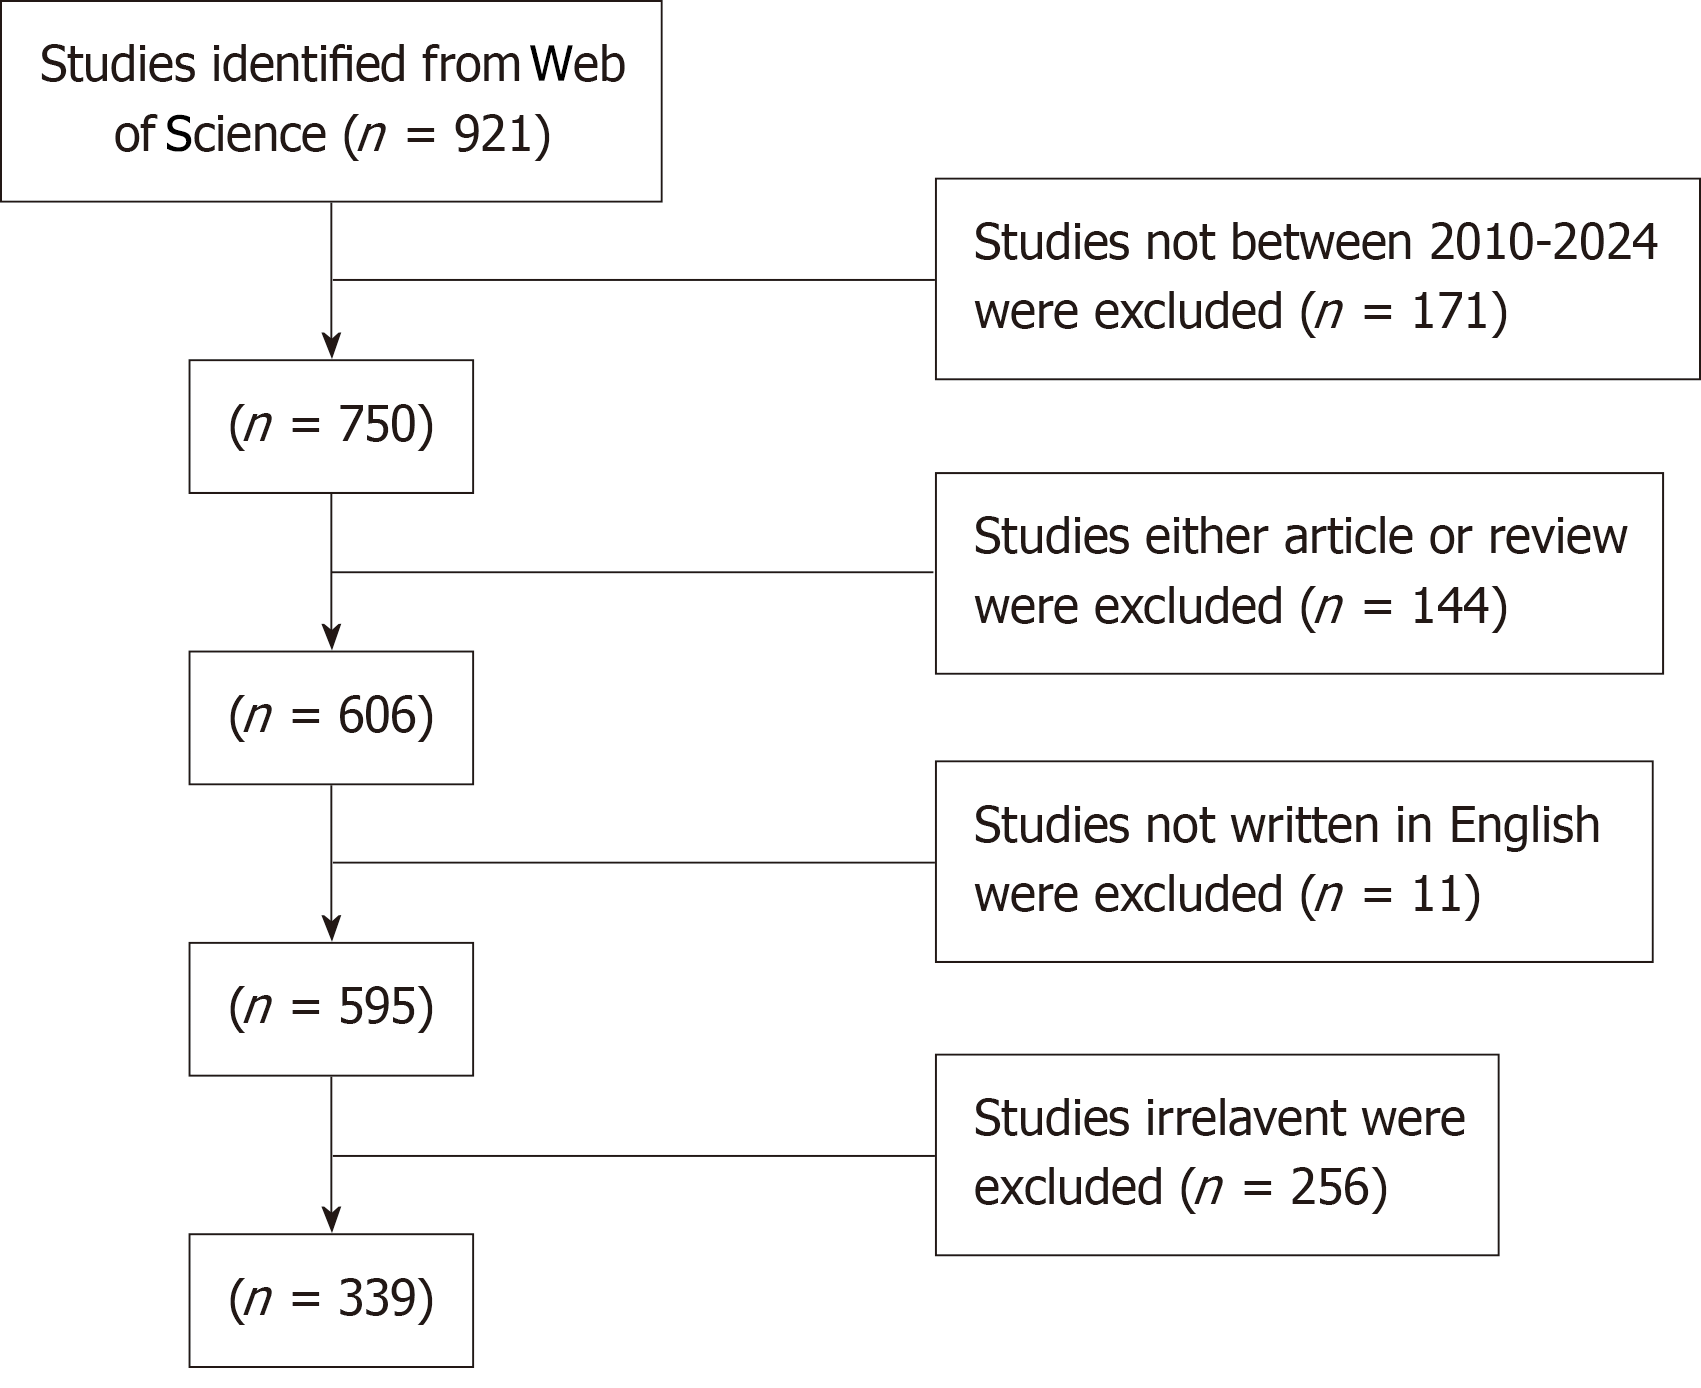
Figure 1 Flowchart of including and excluding publications.
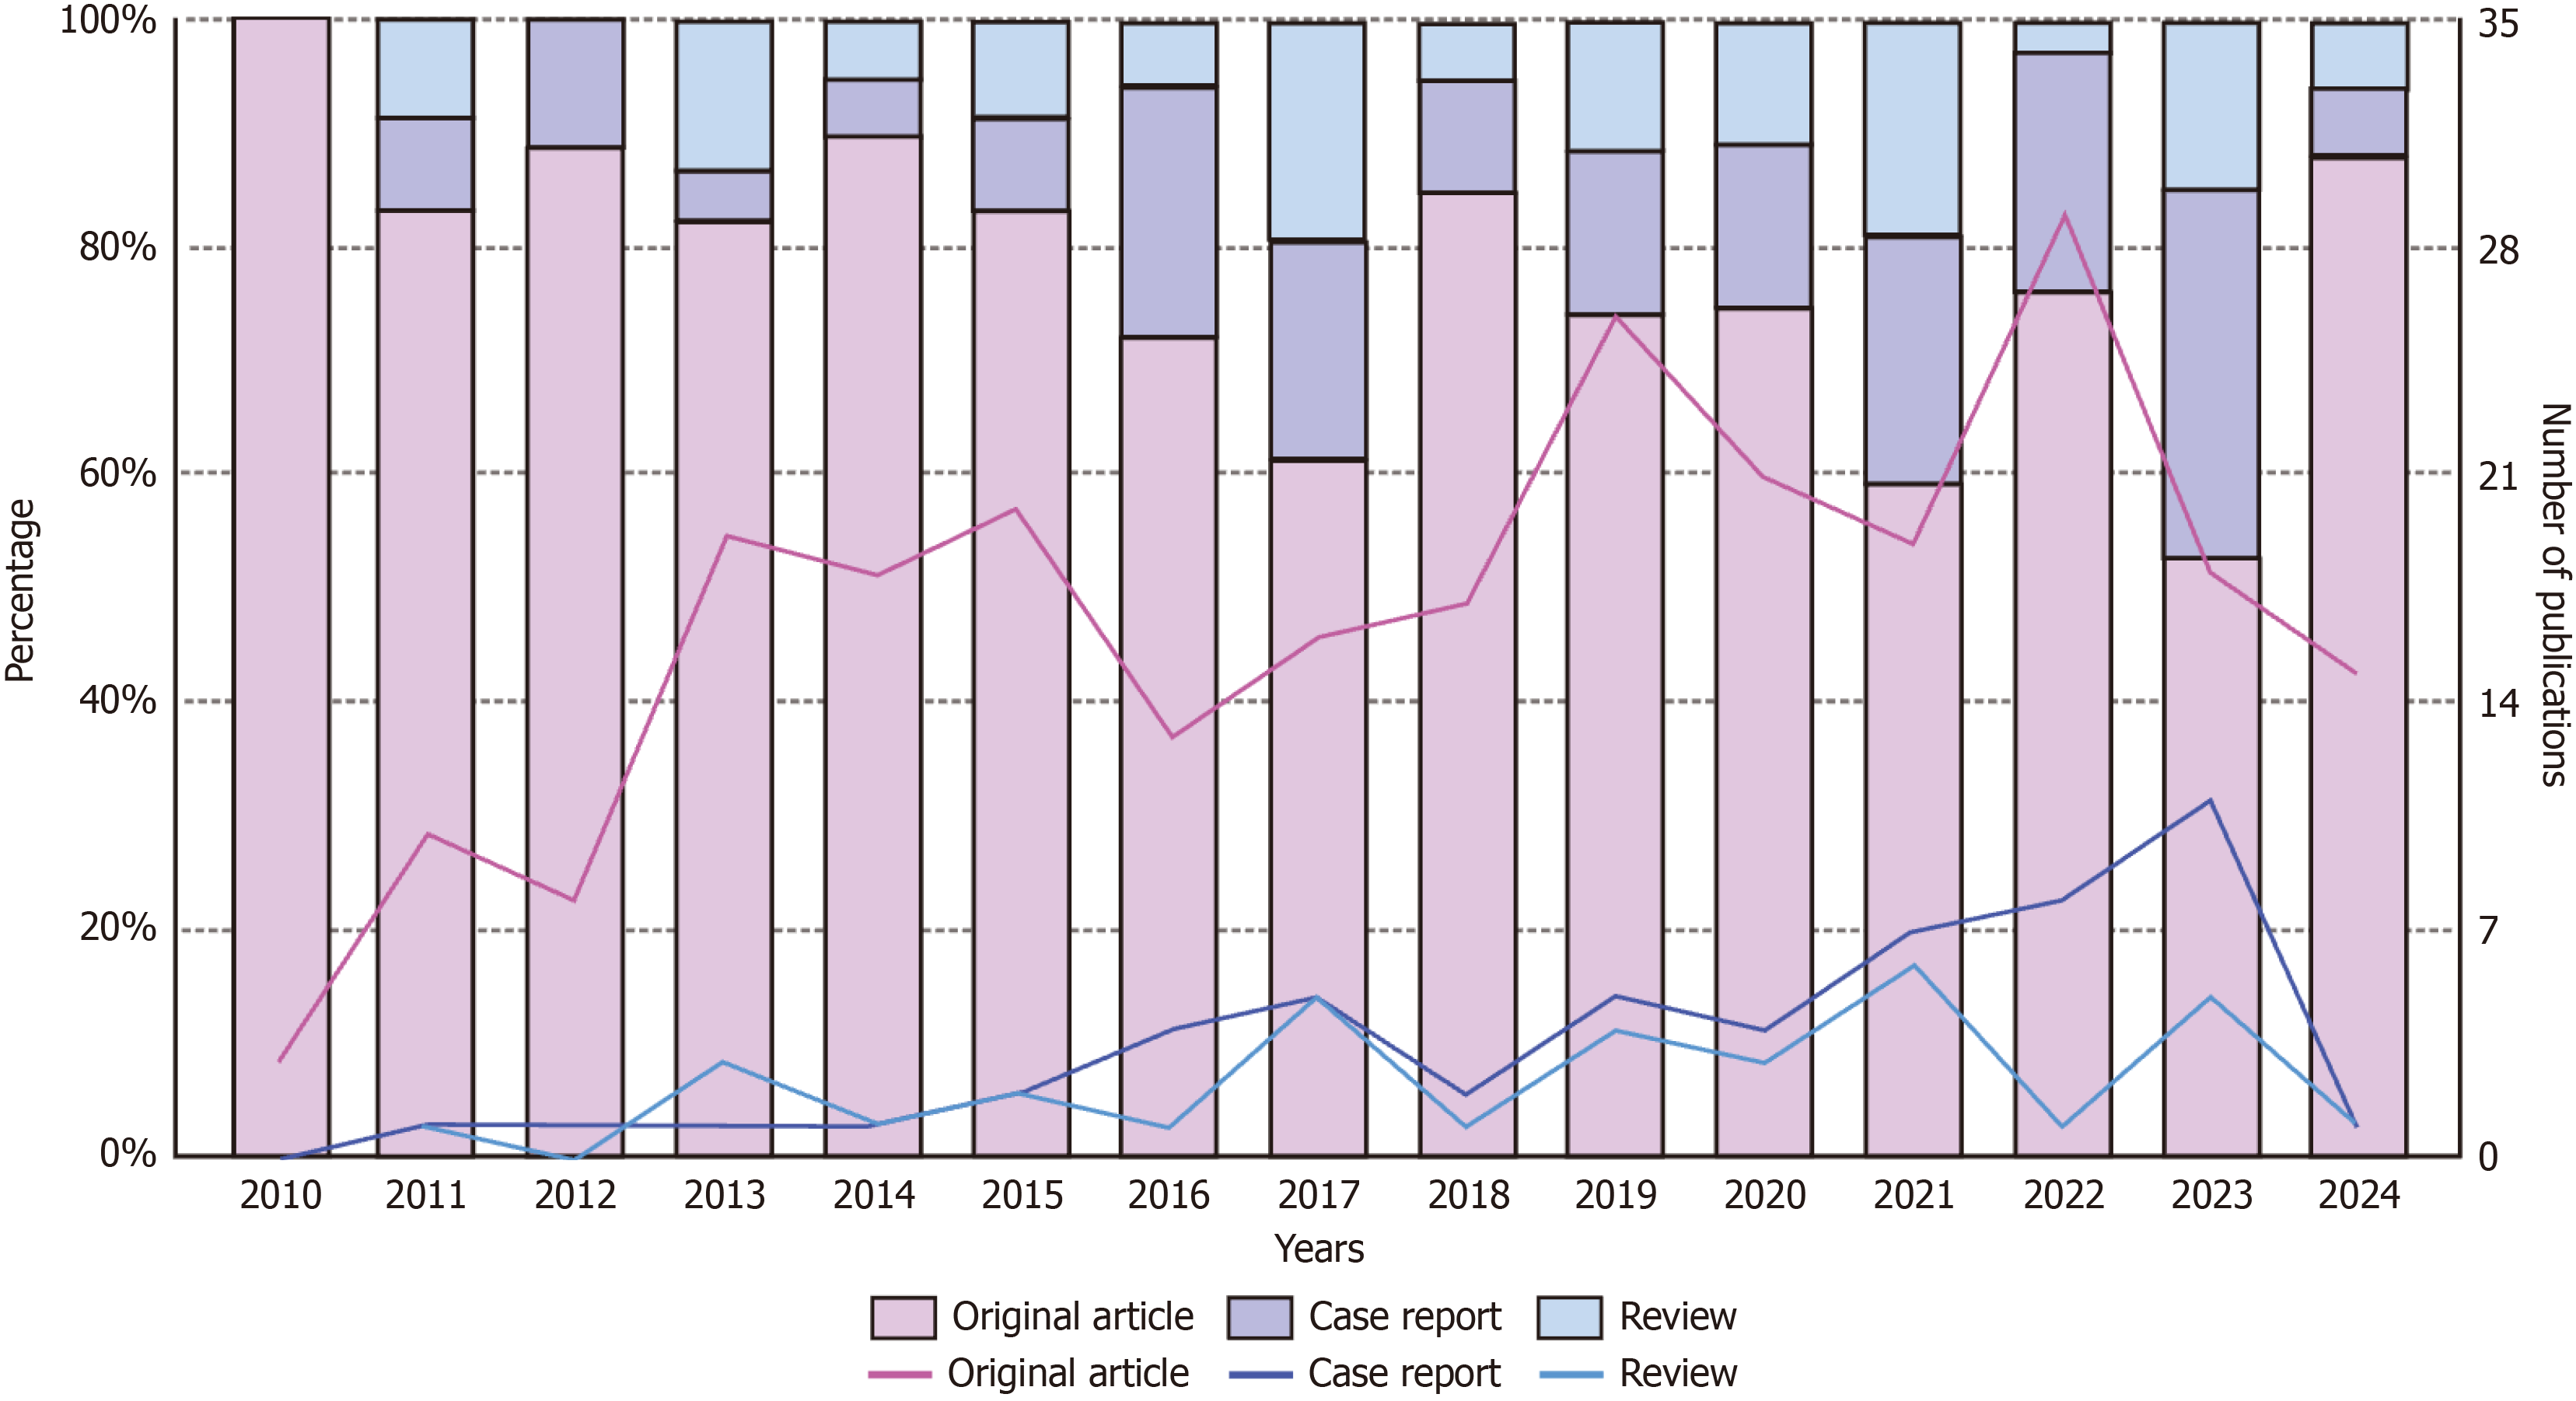
Figure 2 Trends of publications on endoscopic applications on submucosal tumors.
Data was selected from January 1, 2010, to July 5, 2024. The bar chart and line graph respectively illustrate the proportion and trend changes of published articles in the categories of original articles, case reports, and reviews.
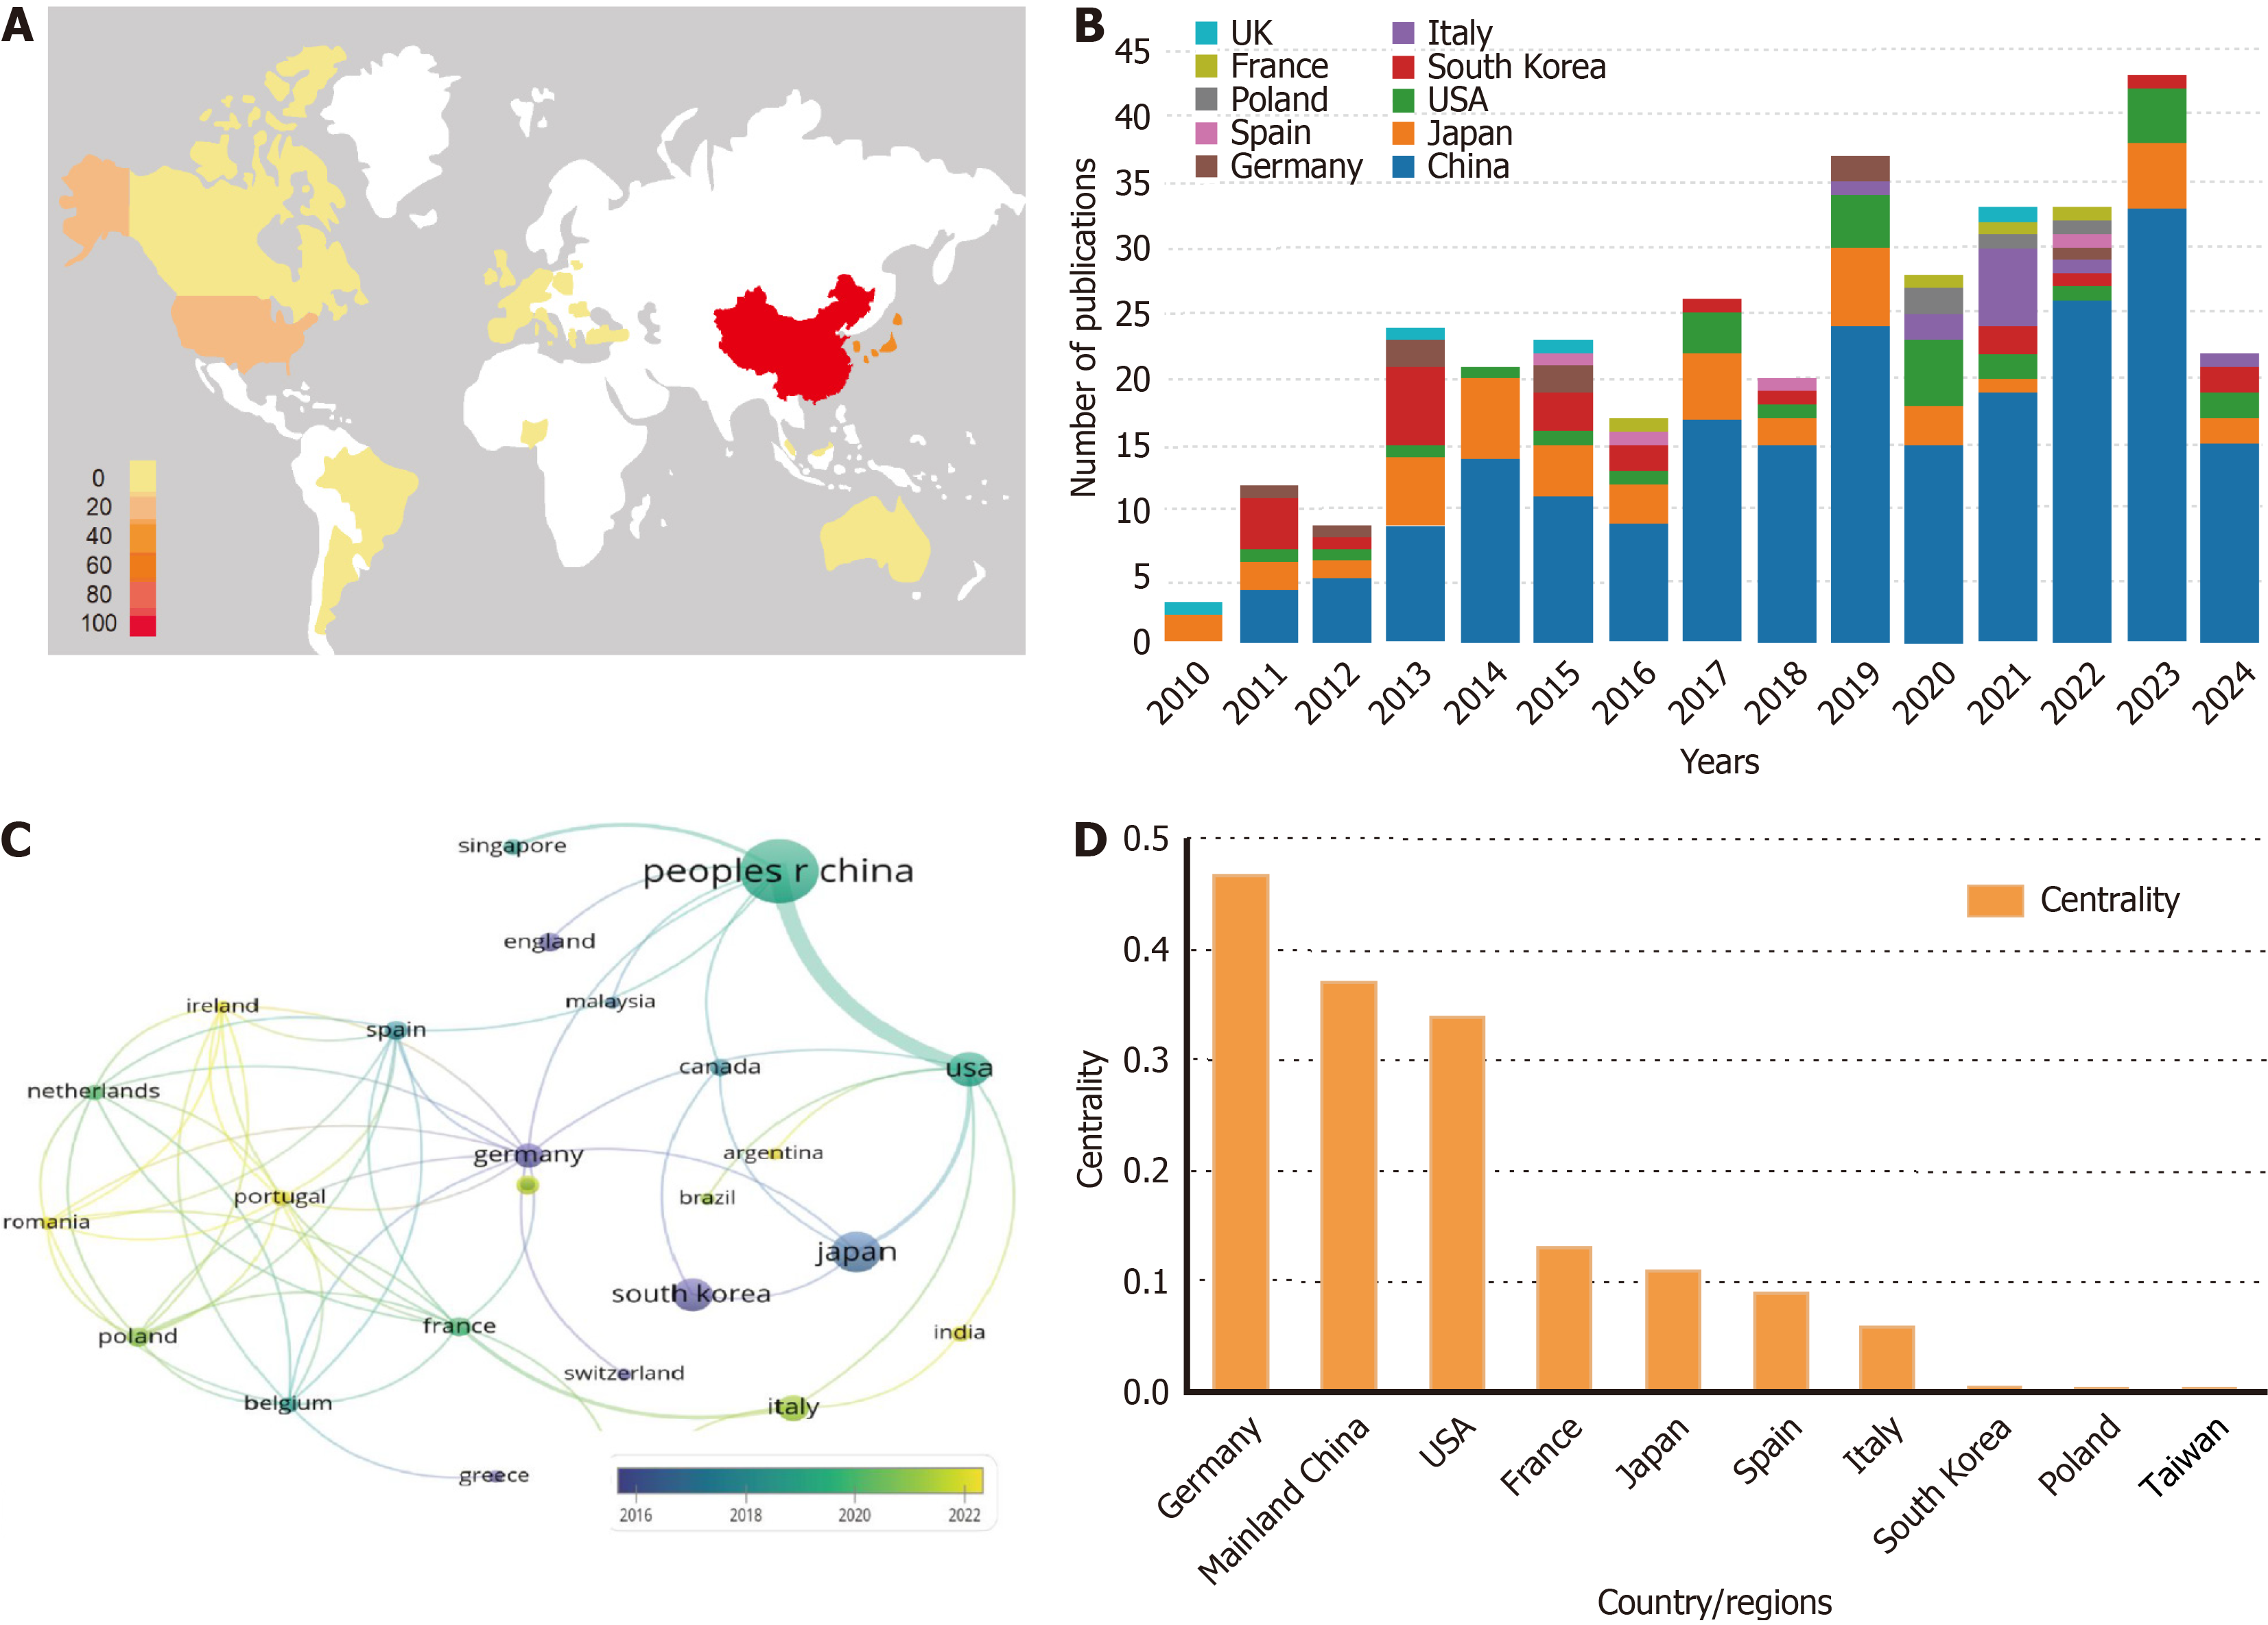
Figure 3 Contributions of countries/regions to global publications.
A: World map based on the total publications of different countries/regions, performed by Microsoft Excel; B: Number of publications in different countries/regions from 2010 to 2024; C: VOSviewer’s overlay visualization showing countries/regions with more than 4 publications. The size of nodes and thickness of linkages indicate publishing quantity and connection strength. Overlay visualization is a map that overlays the original network with additional analysis results including publication year or frequency of citation; D: The centrality of the top 10 countries/regions.
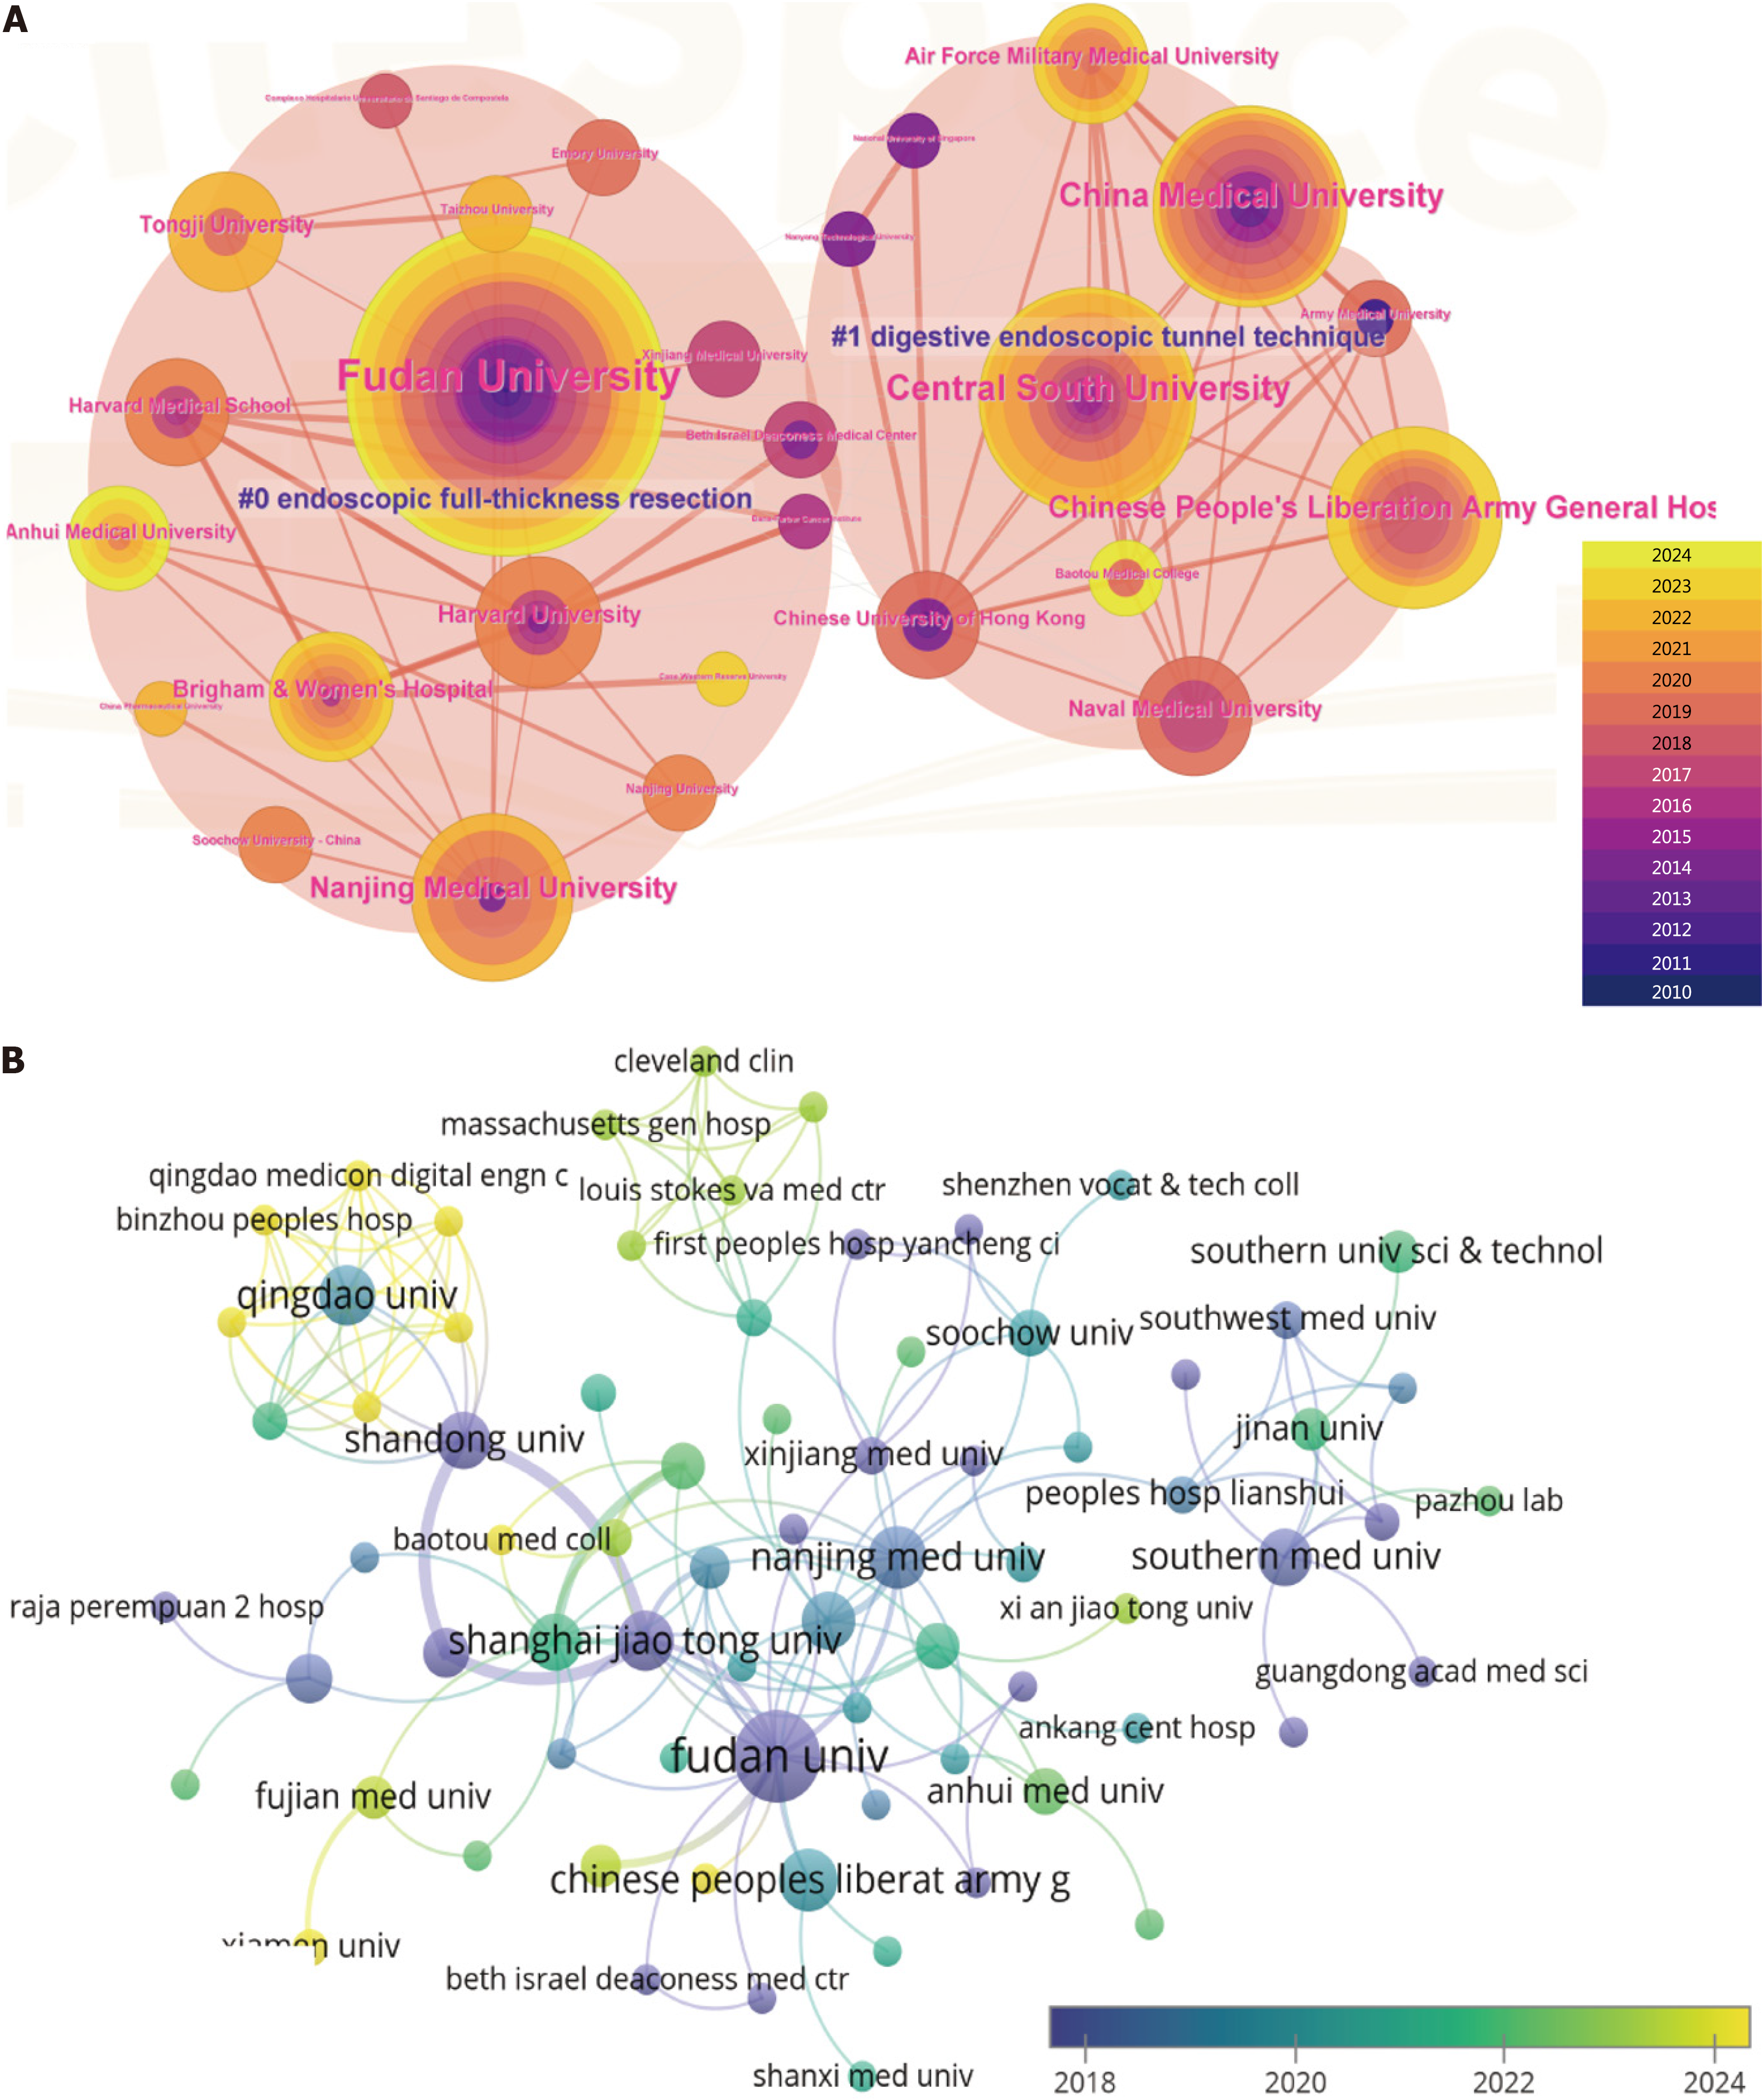
Figure 4 Contribution of institutions to global publication.
A: A cluster network visualization map of institutional collaboration analysis. The nodes with an outer purple ring reveal high centrality; B: VOSviewer’s overlay visualization shows all institutions with publications. The size of nodes and thickness of linkages indicate the publishing quantity and connection strength.
Figure 5 Visualization of keywords in endoscopy applications in submucosal tumors.
A and B: VOSviewer’s network and overlay maps show keywords with a frequency of more than 10 times. The size of nodes and thickness of linkages indicate publishing quantity and connection strength; C: Keywords’ timeline analysis, performed by CiteSpace; D: Top 50 keywords with the strongest citation burst.
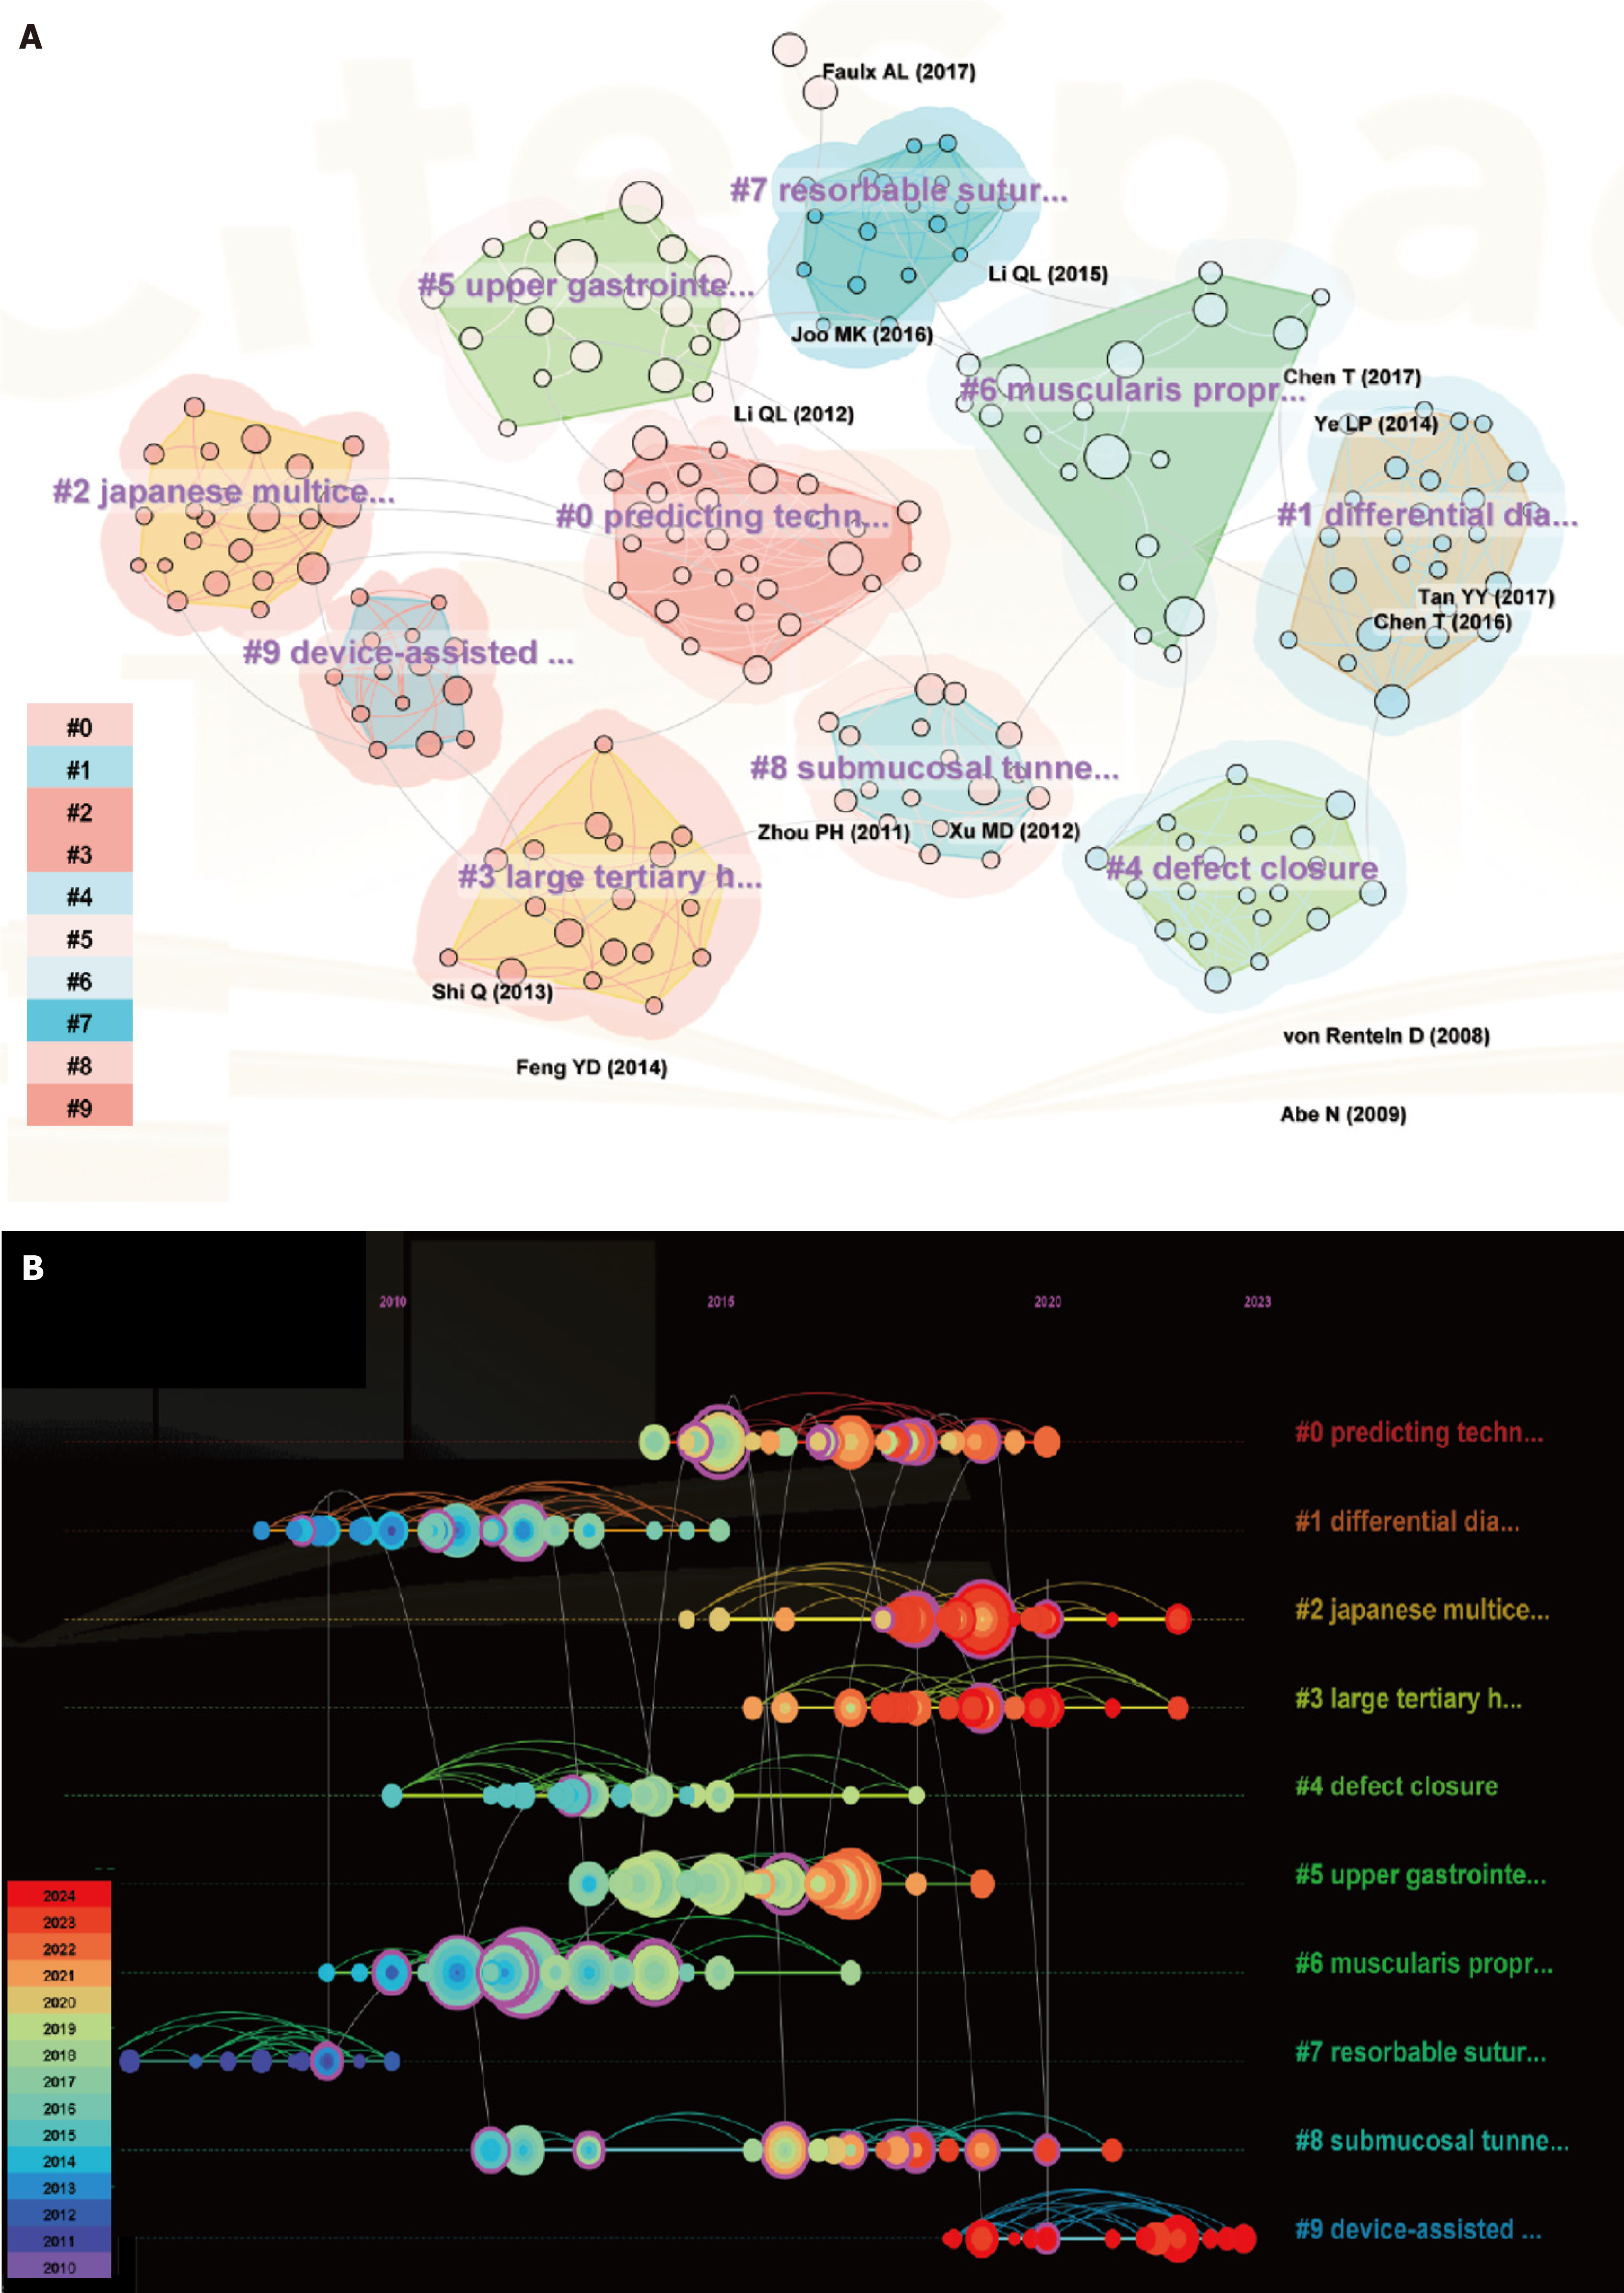
Figure 6 Visualization of co-cited reference cluster analysis in endoscopy applications in submucosal tumors.
A: A landscape view of co-cited reference cluster analysis. The area of diverse colors and shapes reflects the clusters, and node sizes denote cited times; B: Visualization map of the timeline view. The time evolution is reflected by various colored lines, and the nodes on the lines indicate the references cited.
- Citation: Lin KX, Liu Y, Wang L, Xu PR, Liu ZQ, Ma LY, Lin JJ, Tan T, Zhou PH, Hu H. Global research trends in endoscopy applications in submucosal tumor: A bibliometric analysis of studies published from 2010-2024. World J Gastrointest Oncol 2025; 17(5): 102282
- URL: https://www.wjgnet.com/1948-5204/full/v17/i5/102282.htm
- DOI: https://dx.doi.org/10.4251/wjgo.v17.i5.102282


