Copyright
©The Author(s) 2025.
World J Gastrointest Oncol. May 15, 2025; 17(5): 102282
Published online May 15, 2025. doi: 10.4251/wjgo.v17.i5.102282
Published online May 15, 2025. doi: 10.4251/wjgo.v17.i5.102282
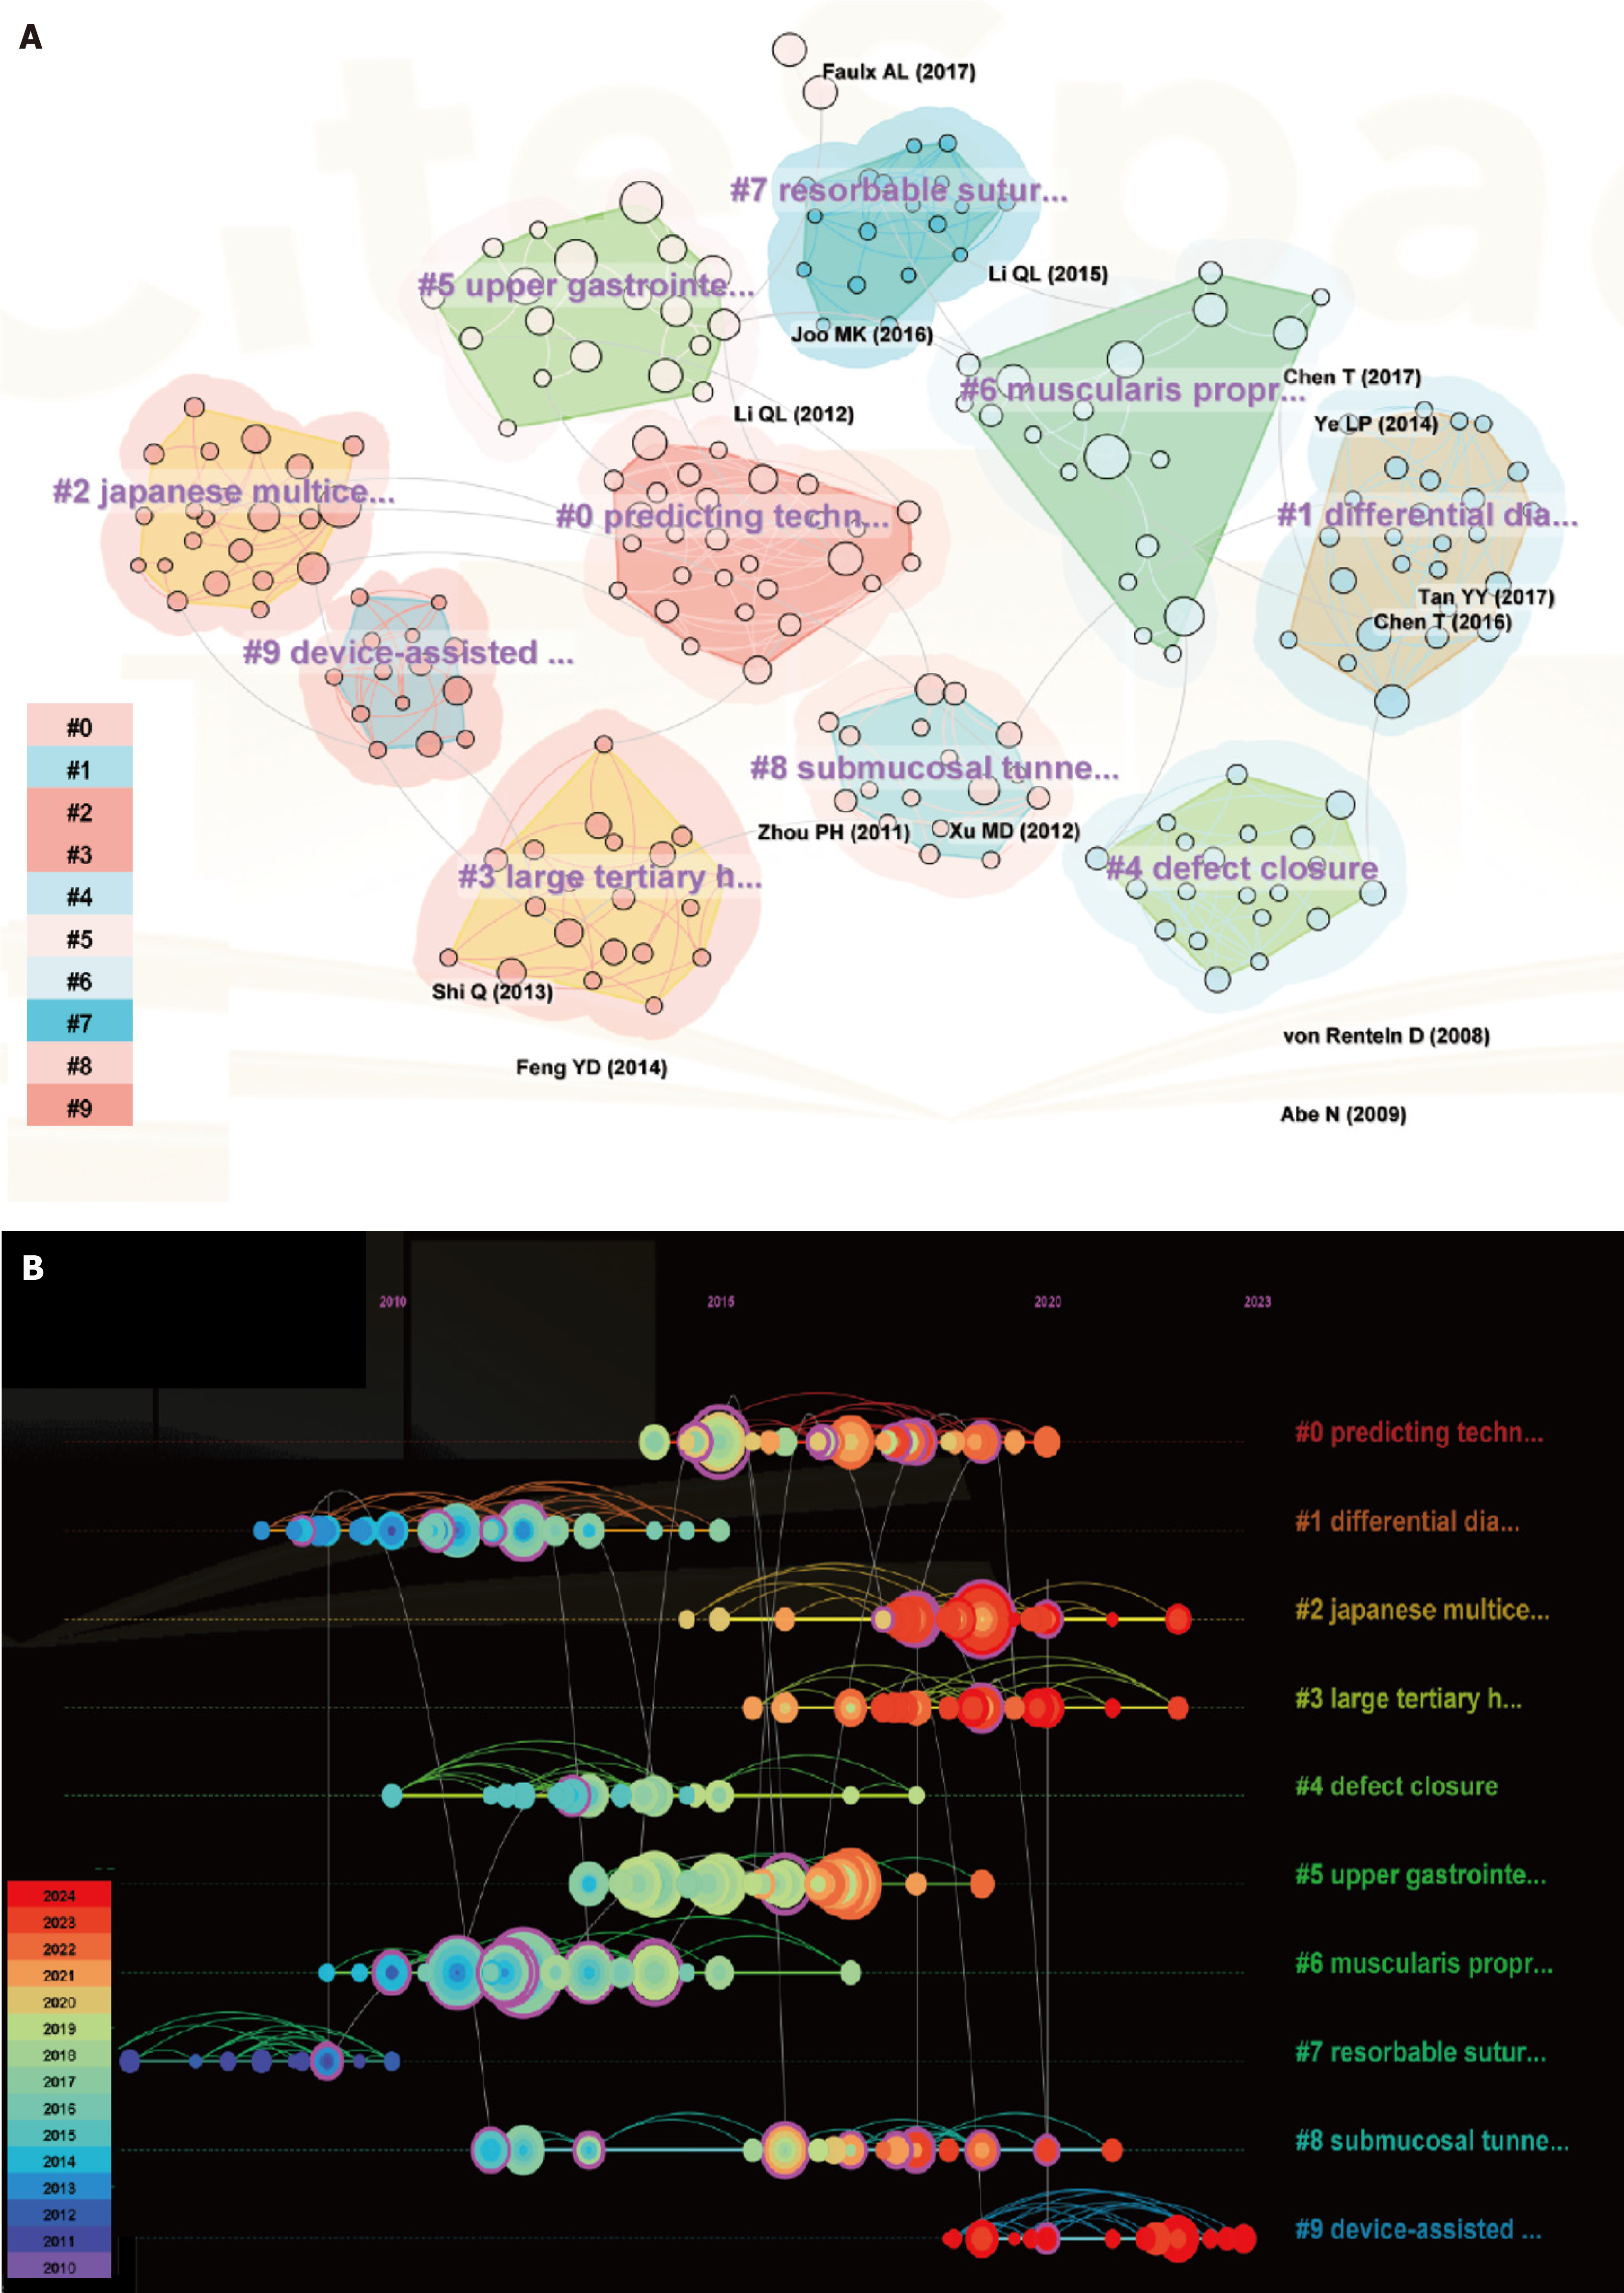
Figure 6 Visualization of co-cited reference cluster analysis in endoscopy applications in submucosal tumors.
A: A landscape view of co-cited reference cluster analysis. The area of diverse colors and shapes reflects the clusters, and node sizes denote cited times; B: Visualization map of the timeline view. The time evolution is reflected by various colored lines, and the nodes on the lines indicate the references cited.
- Citation: Lin KX, Liu Y, Wang L, Xu PR, Liu ZQ, Ma LY, Lin JJ, Tan T, Zhou PH, Hu H. Global research trends in endoscopy applications in submucosal tumor: A bibliometric analysis of studies published from 2010-2024. World J Gastrointest Oncol 2025; 17(5): 102282
- URL: https://www.wjgnet.com/1948-5204/full/v17/i5/102282.htm
- DOI: https://dx.doi.org/10.4251/wjgo.v17.i5.102282


