Copyright
©The Author(s) 2025.
World J Gastrointest Oncol. May 15, 2025; 17(5): 102282
Published online May 15, 2025. doi: 10.4251/wjgo.v17.i5.102282
Published online May 15, 2025. doi: 10.4251/wjgo.v17.i5.102282
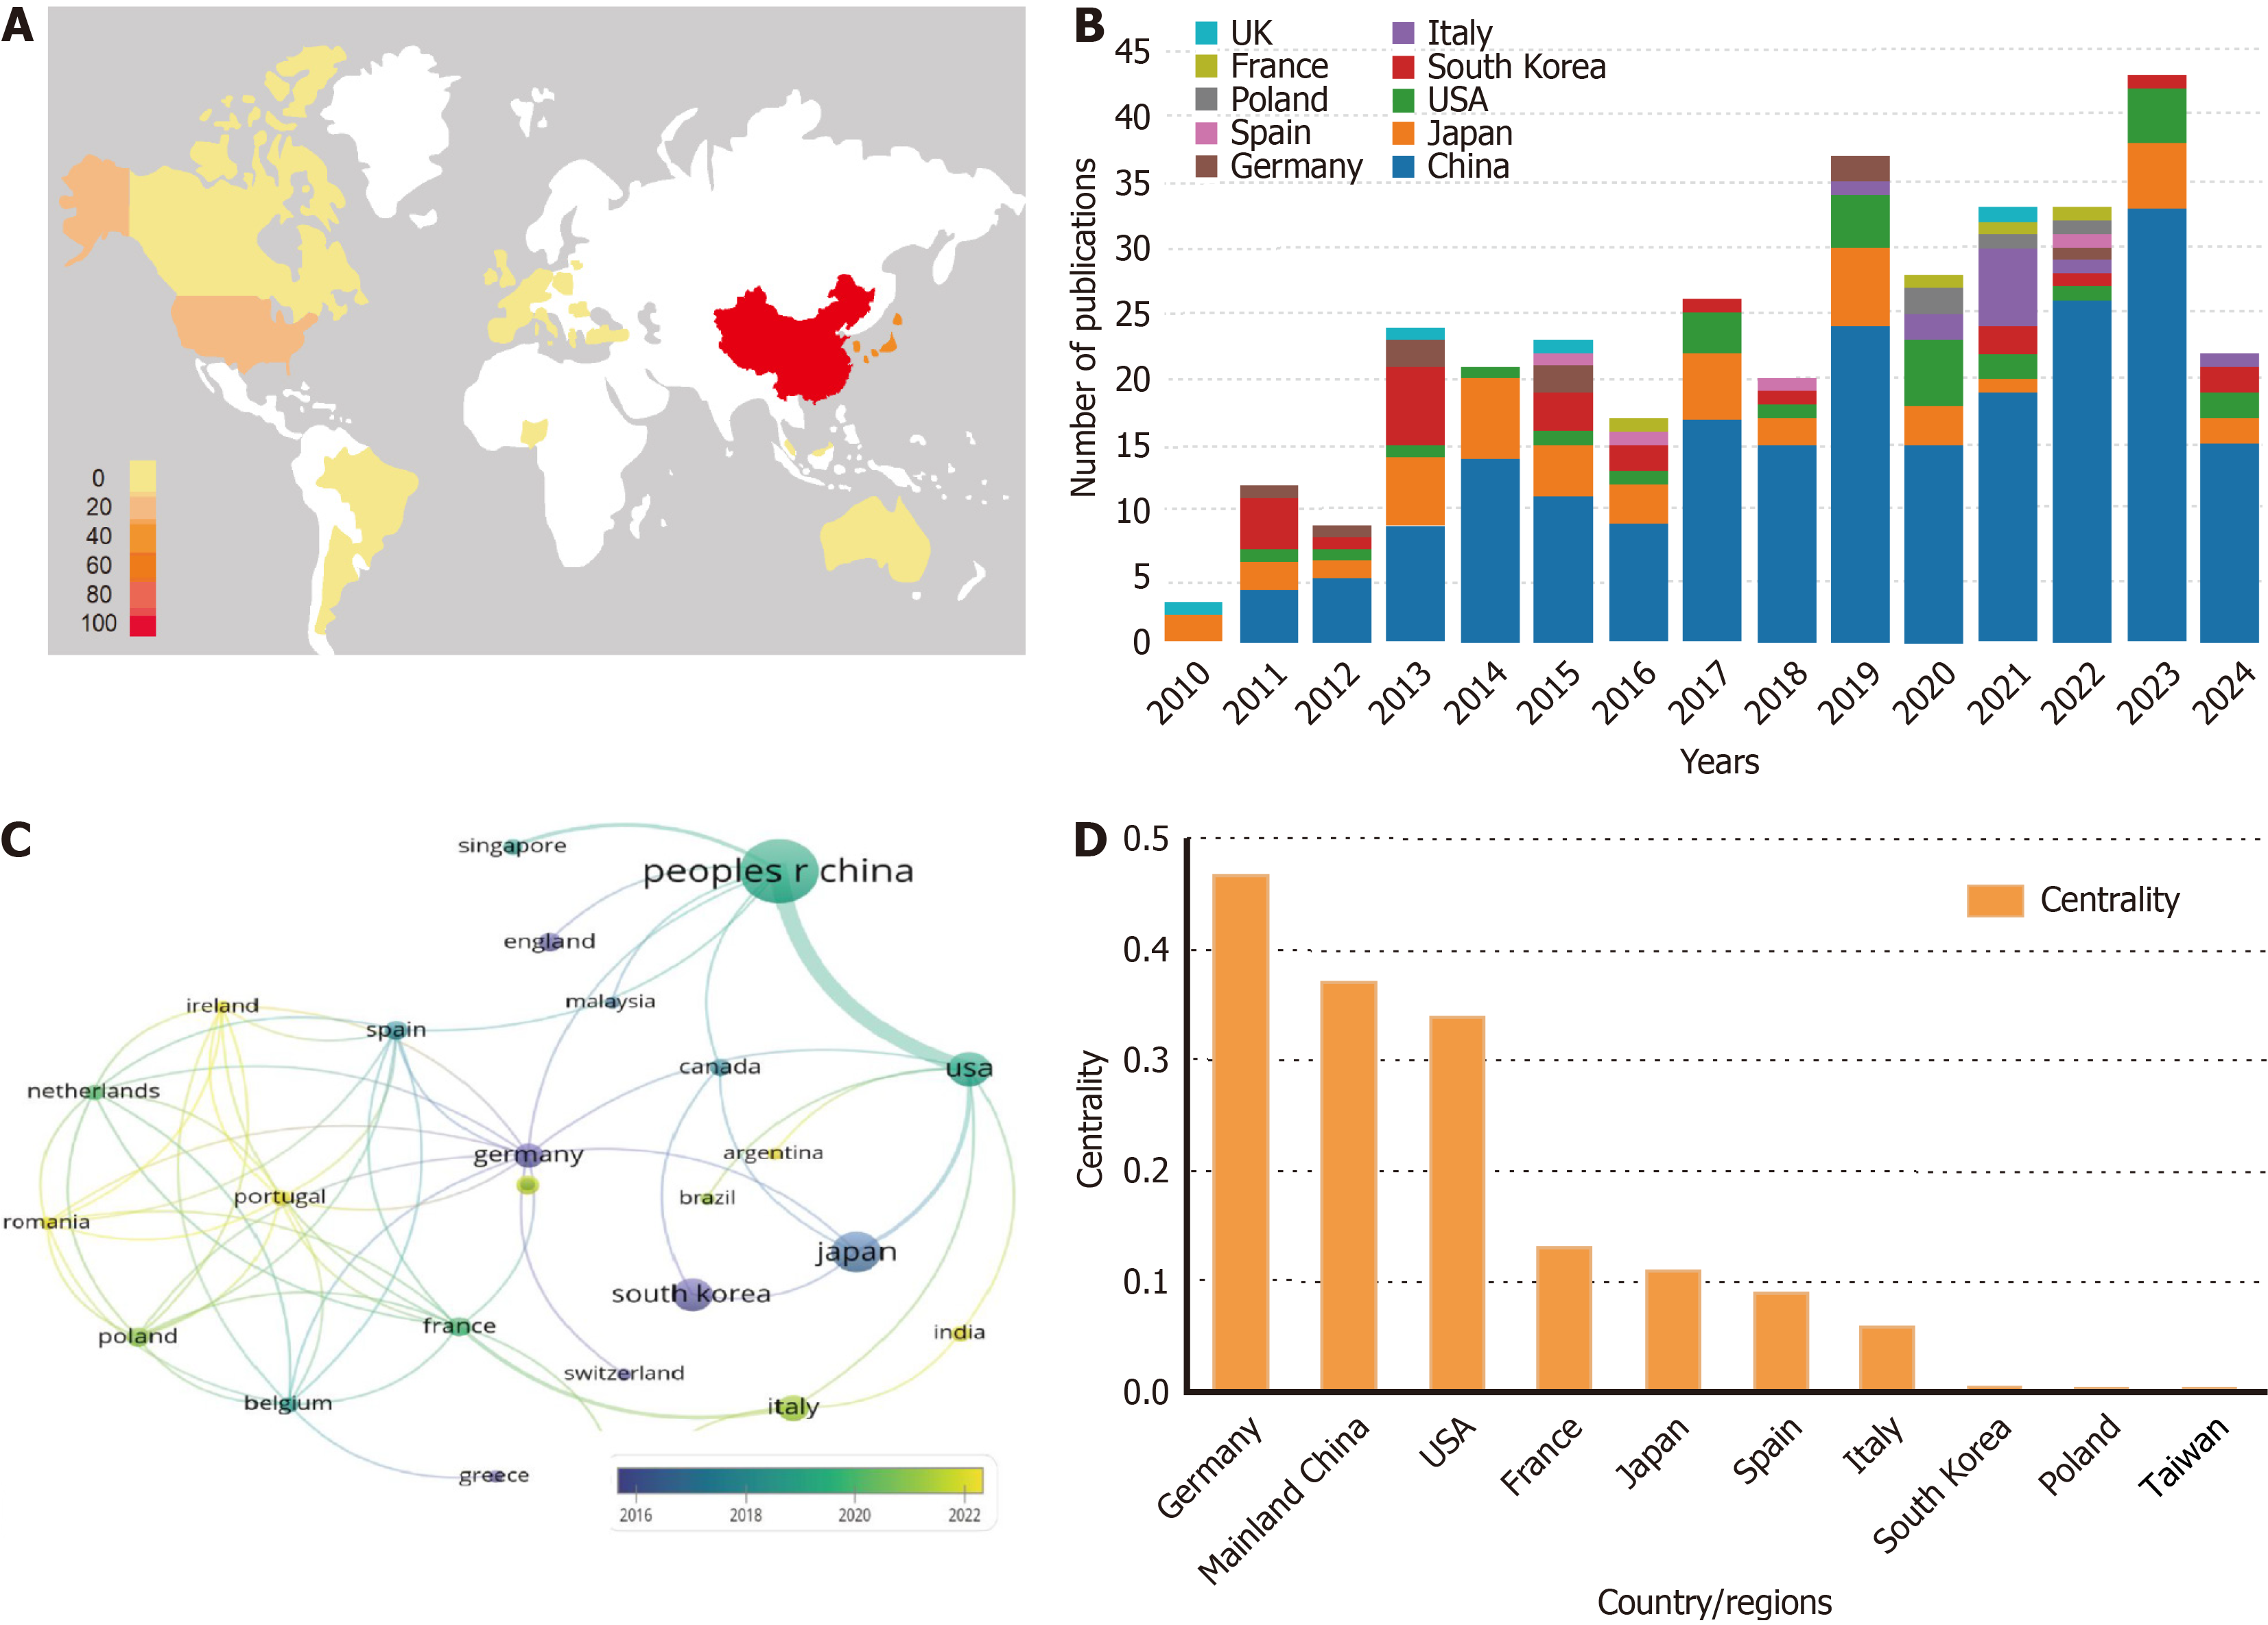
Figure 3 Contributions of countries/regions to global publications.
A: World map based on the total publications of different countries/regions, performed by Microsoft Excel; B: Number of publications in different countries/regions from 2010 to 2024; C: VOSviewer’s overlay visualization showing countries/regions with more than 4 publications. The size of nodes and thickness of linkages indicate publishing quantity and connection strength. Overlay visualization is a map that overlays the original network with additional analysis results including publication year or frequency of citation; D: The centrality of the top 10 countries/regions.
- Citation: Lin KX, Liu Y, Wang L, Xu PR, Liu ZQ, Ma LY, Lin JJ, Tan T, Zhou PH, Hu H. Global research trends in endoscopy applications in submucosal tumor: A bibliometric analysis of studies published from 2010-2024. World J Gastrointest Oncol 2025; 17(5): 102282
- URL: https://www.wjgnet.com/1948-5204/full/v17/i5/102282.htm
- DOI: https://dx.doi.org/10.4251/wjgo.v17.i5.102282


