Copyright
©The Author(s) 2023.
World J Gastrointest Oncol. Sep 15, 2023; 15(9): 1556-1566
Published online Sep 15, 2023. doi: 10.4251/wjgo.v15.i9.1556
Published online Sep 15, 2023. doi: 10.4251/wjgo.v15.i9.1556
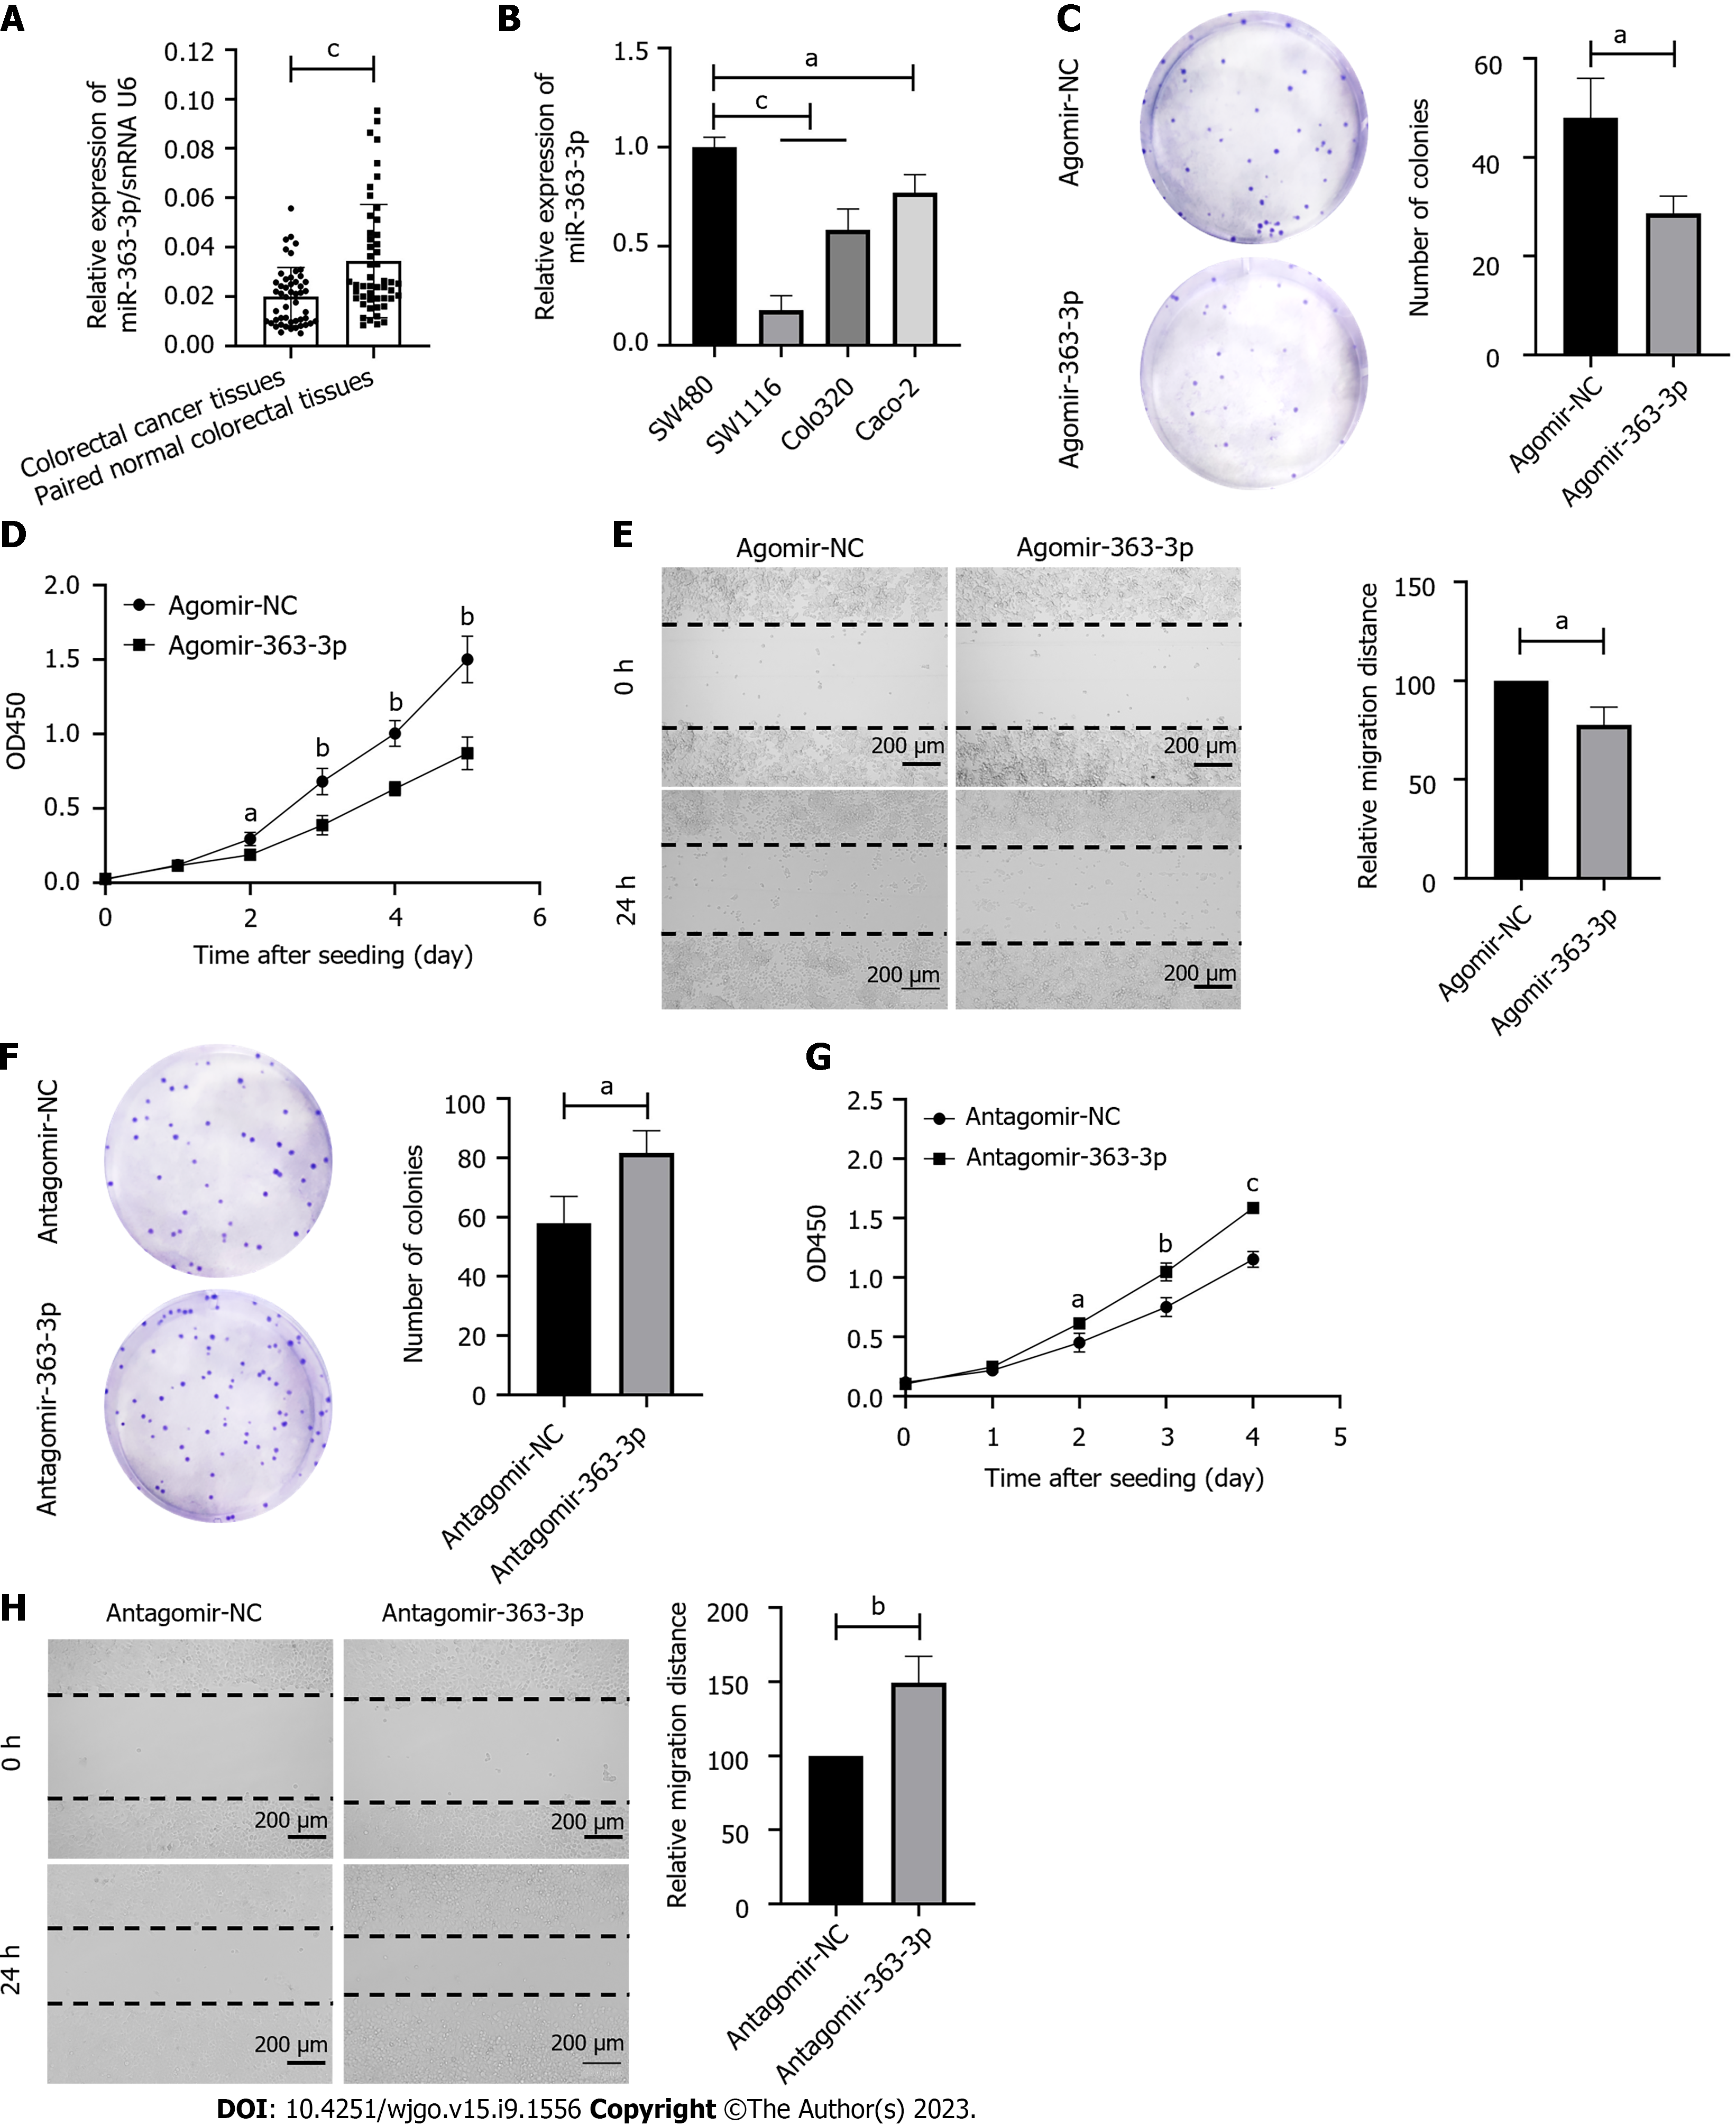
Figure 1 MicroRNA-363-3p is downregulated in colorectal cancer tissues and inhibits clonogenic survival, proliferation and migration of colorectal cancer cells.
A: Quantitative polymerase chain reaction (qPCR) analysis of microRNA-363-3p (miR-363-3p) expression in colorectal cancer tissues and paired normal colorectal tissues; B: qPCR analysis of miR-363-3p expression in human colorectal cancer cell lines; C: Representative images of clonogenic survival of SW1116 cells transfected with agomir-363-3p or agomir-NC. The graph shows the number of colonies; D: Proliferation curve of SW1116 cells transfected with agomir-363-3p or agomir-NC; E: Representative images of the gaps at 0 and 24 h after scratching. SW1116 cells were transfected with agomir-363-3p or agomir-NC. The graph shows the relative migration distance. The scale bar is 200 μm; F: Representative images of clonogenic survival of SW480 cells transfected with antagomir-363-3p or antagomir-NC. The graph shows the number of colonies; G: Proliferation curve of SW480 cells transfected with antagomir-363-3p or antagomir-NC; H: Representative images of the gaps at 0 and 24 h after scratching. SW480 cells were transfected with antagomir-363-3p or antagomir-NC. The graph shows the relative migration distance. The scale bar is 200 μm. The results were shown as the mean ± SD. aP < 0.05, bP < 0.01, cP < 0.001. miR-363-3p: MicroRNA-363-3p; NC: Negative control.
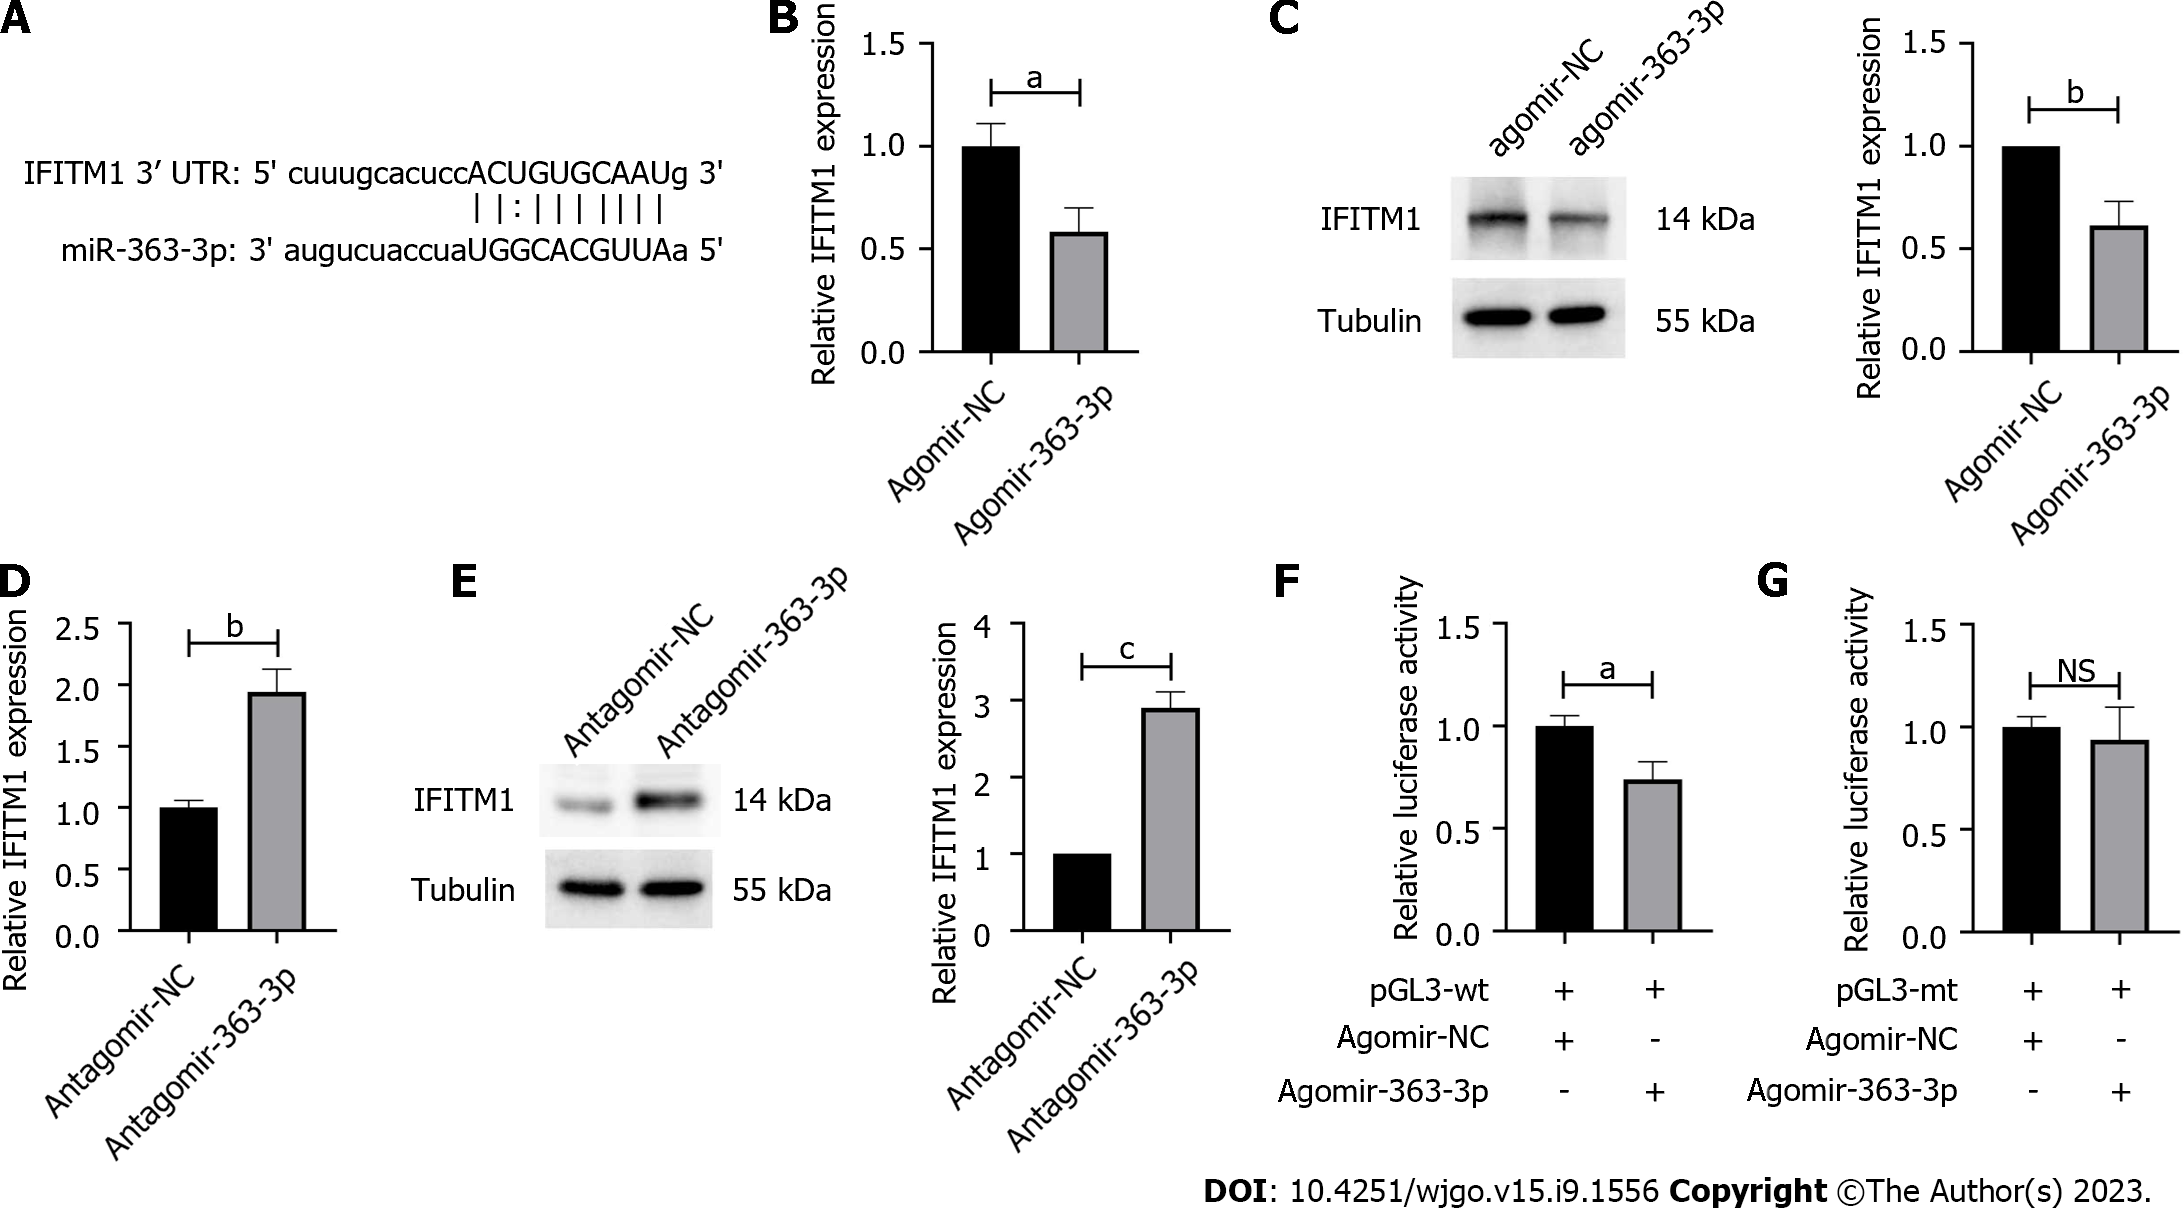
Figure 2 Interferon-induced transmembrane protein 1 is a direct target of microRNA-363-3p.
A: The complementary sequences of microRNA-363-3p were identified in 3’ untranslated region of interferon-induced transmembrane protein 1 (IFITM1) mRNA; B: Quantitative polymerase chain reaction (qPCR) analysis of IFITM1 mRNA expression in SW1116 cells transfected with agomir-363-3p or agomir-NC; C: Western blot analysis of IFITM1 expression in SW1116 cells transfected with agomir-363-3p or agomir-NC. Graph shows quantification of relative levels of IFITM1 expression; D: qPCR analysis of IFITM1 mRNA expression in SW480 cells transfected with antagomir-363-3p or antagomir-NC; E: Western blot analysis of IFITM1 expression in SW480 cells transfected with antagomir-363-3p or antagomir-NC. Graph shows quantification of relative levels of IFITM1 expression; F and G: Luciferase reporter gene assays using constructs containing the predicted targeting sequence (pGL3-wt) and mutated targeting sequence (pGL3-mt). SW1116 cells were transfected with the indicated constructs. The results were shown as the mean ± SD. aP < 0.05, bP < 0.01, cP < 0.001. UTR: Untranslated region; IFITM1: Interferon-induced transmembrane protein 1; miR-363-3p: MicroRNA-363-3p; NC: Negative control; NS: Not significant.
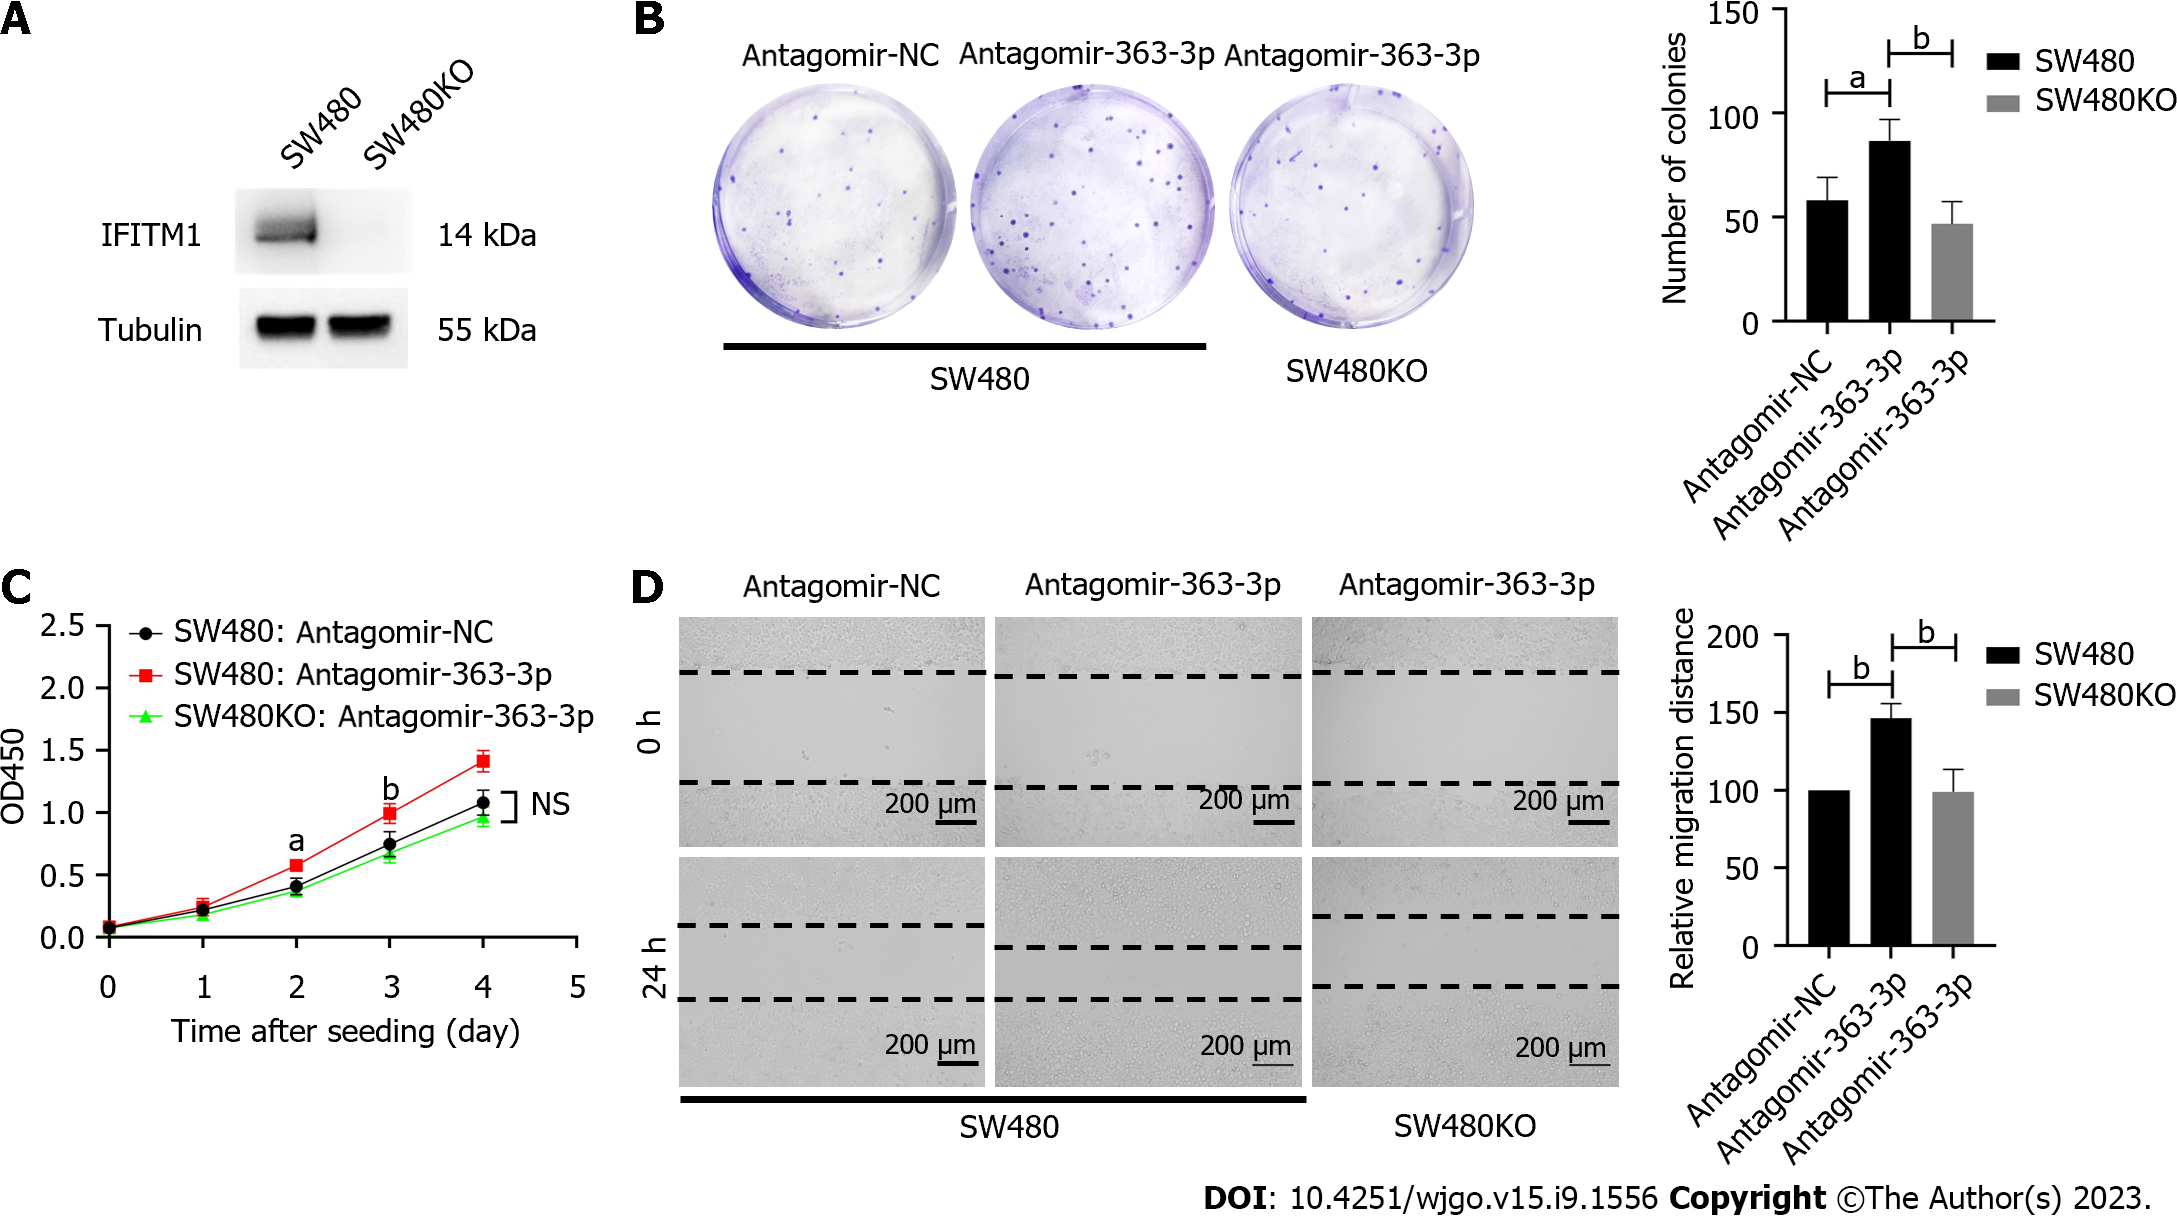
Figure 3 Interferon-induced transmembrane protein 1 mediates the regulatory effects of microRNA-363-3p on clonogenic survival, proliferation and migration of colorectal cancer cells.
A: Western blot analysis of interferon-induced transmembrane protein 1 expression in SW480 and SW480KO cells; B: Representative images of clonogenic survival of SW480 or SW480KO cells. Cells were transfected with antagomir-363-3p or antagomir-NC. The graph shows the number of colonies; C: Proliferation curve of SW480 or SW480KO cells. Cells were transfected with antagomir-363-3p or antagomir-NC; D: Representative images of the gaps at 0 and 24 h after scratching. SW480 or SW480KO cells were transfected with antagomir-363-3p or antagomir-NC. The graph shows the relative migration distance. The scale bar is 200 μm. The results were shown as the mean ± SD. aP < 0.05, bP < 0.01. NS: No significance; IFITM1: Interferon-induced transmembrane protein 1; NC: Negative control.
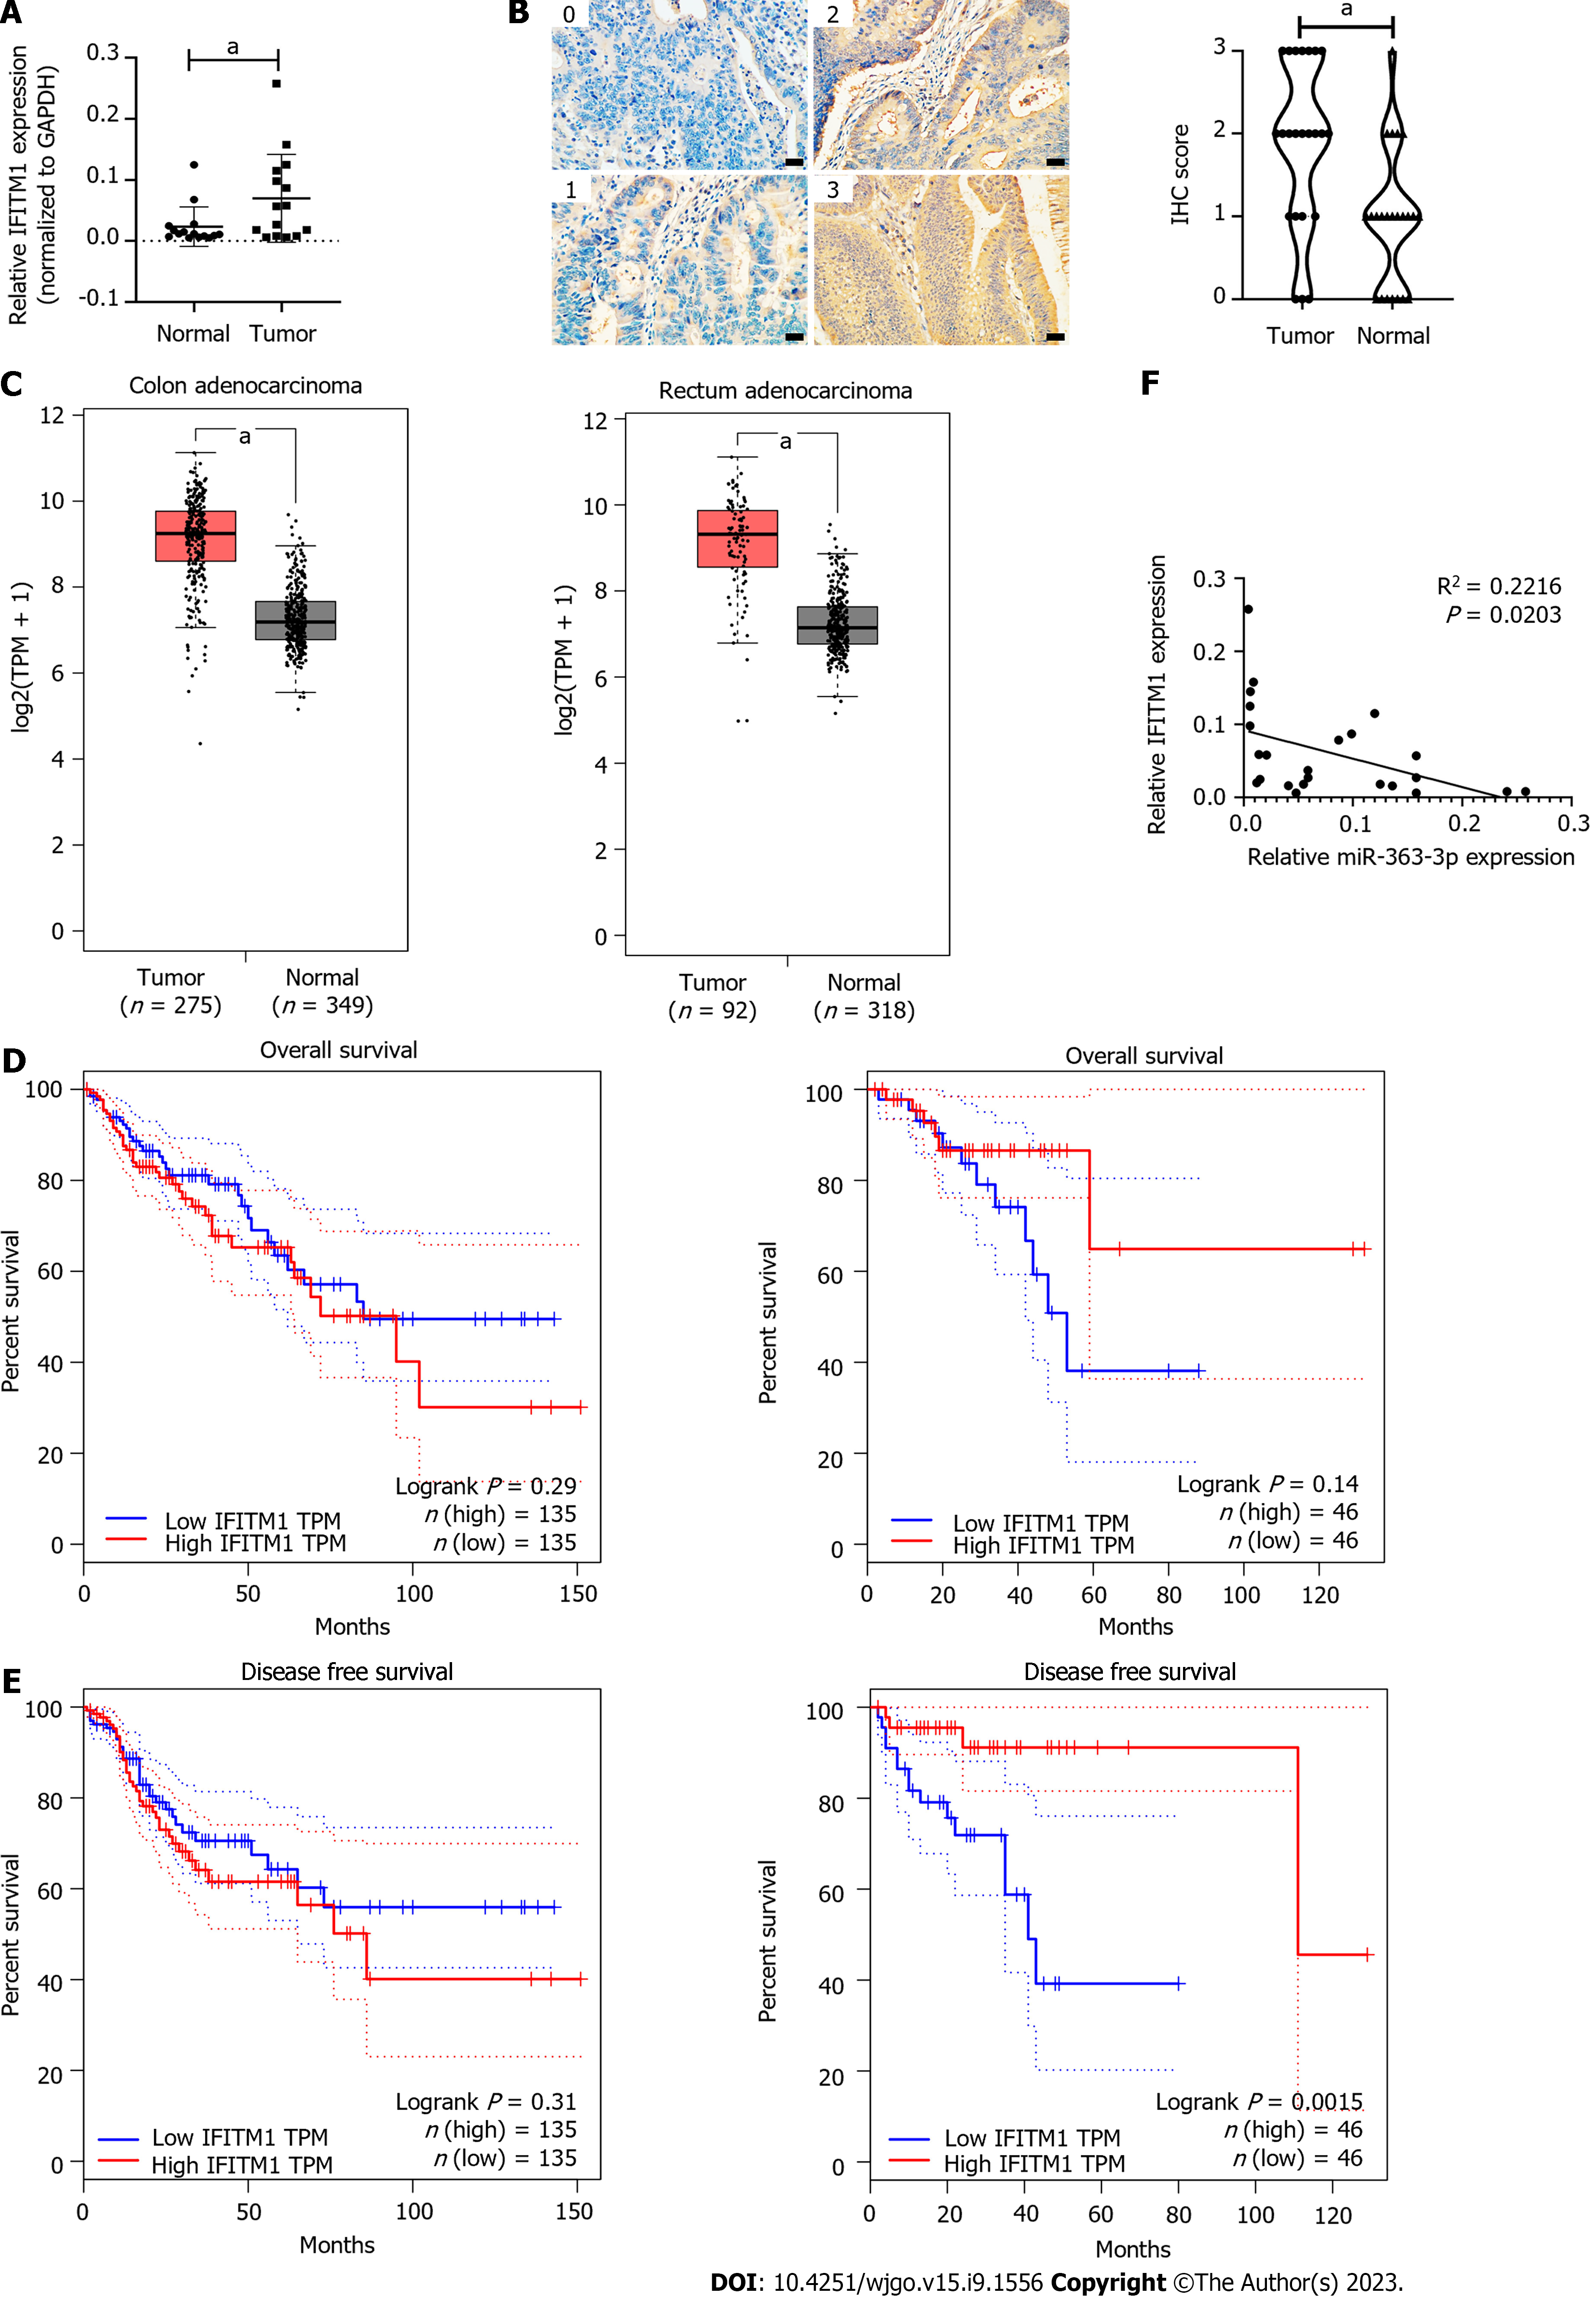
Figure 4 Expression levels of significance and interferon-induced transmembrane protein 1 are negatively correlated in human colorectal cancer tissues.
A: Quantitative polymerase chain reaction analysis of interferon-induced transmembrane protein 1 (IFITM1) mRNA expression in colorectal cancer tissues and paired normal colorectal tissues; B: Representative images of IFITM1 expression detected by immunohistochemical staining. Immunohistochemical (IHC) scores are shown in the upper left corner, and the scale bar is 50 μm. Violin plots show statistical analysis of IHC scores; C: IFITM1 mRNA expression levels in colon cancer and normal colon tissues (left panel), rectal cancer, and normal rectal tissues (right panel) were analyzed using TCGA and GTEx databases; D: Correlation analysis of IFITM1 mRNA expression level and overall survival in patients with colon cancer (left panel) or rectal cancer (right panel); E: Correlation analysis of IFITM1 mRNA expression level and disease-free survival in patients with colon cancer (left panel) or rectal cancer (right panel); F: Correlation analysis of IFITM1 mRNA expression level and microRNA-363-3p expression level. The results were shown as the mean ± SD. aP < 0.05. IHC: Immunohistochemical; IFITM1: Interferon-induced transmembrane protein 1; miR-363-3p: MicroRNA-363-3p; NC: Negative control.
- Citation: Wang Y, Bai SK, Zhang T, Liao CG. MicroRNA-363-3p inhibits colorectal cancer progression by targeting interferon-induced transmembrane protein 1. World J Gastrointest Oncol 2023; 15(9): 1556-1566
- URL: https://www.wjgnet.com/1948-5204/full/v15/i9/1556.htm
- DOI: https://dx.doi.org/10.4251/wjgo.v15.i9.1556


