Copyright
©The Author(s) 2023.
World J Gastrointest Oncol. Aug 15, 2023; 15(8): 1384-1399
Published online Aug 15, 2023. doi: 10.4251/wjgo.v15.i8.1384
Published online Aug 15, 2023. doi: 10.4251/wjgo.v15.i8.1384
Figure 1 Expression of miR-188-3p in patients’ plasma and cell lines, and tissues of gastric cancer.
A: Quantitative reverse transcriptase-polymerase chain reaction (qRT-PCR). The plasma from gastric cancer patients was processed for qRT-PCR analysis of the miR-188-3p level. The level of miR-188-3p was significantly lower in the plasma from gastric cancer patients than in that of the healthy people (bP < 0.01); B: qRT-PCR. The GES-1, AGS, HGC-27, MKN-28, MKN-45, SGC-7901, MGC-803, BGC-823 cell lines were subjected to qRT-PCR analysis. The expression of miR-188-3p was highly expressed in all seven cell lines compared with that in GES-1 cells; C: qRT-PCR. Tissue samples from 50 paired gastric cancer and normal mucosa were processed for qRT-PCR analysis of miR-188-3p expression; D and E: Gene transfection and qRT-PCR assays. AGS and BGC-823 cells were subjected to transfection with miR-188-3p mimics, inhibitor, or their NC. RNA isolation and qRT-PCR analysis of miR-188-3p expression was then performed (bP < 0.01); F: Kaplan-Meier survival analysis. We searched the Kaplan-Meier Plotter database data (http://kmplot.com/analysis) and performed a Kaplan-Meier analysis of the overall survival of patients stratified by miR-188-3p expression. We found that expression of miR-188-3p indicates better prognosis of gastric cancer patients. GC: Gastric cancer.
Figure 2 miR-188-3p inhibition of gastric cancer cell growth and invasion.
A and B: 5-ethynyl-2-deoxyuridine (EdU) incorporation assay. AGS and BGC-823 cells were grown and transfected with miR-188-3p mimics, inhibitor, or their NC for 48 h. The EdU assay was then performed. The red fluorescence indicates EdU-positive cells, while the blue fluorescence indicates cell nuclei of all cells. The proliferation rate of tumor cells after transfection with miR-188-3p mimics was lower than that of tumor cells transfected with m-NC (cP < 0.001 vs m-NC or i-NC); C and D: Plate cloning assay. AGS and BGC-823 cells were transfected with miR-188-3p mimics, inhibitor, or their NC and then assayed using the plate-cloning assay. cP < 0.001.
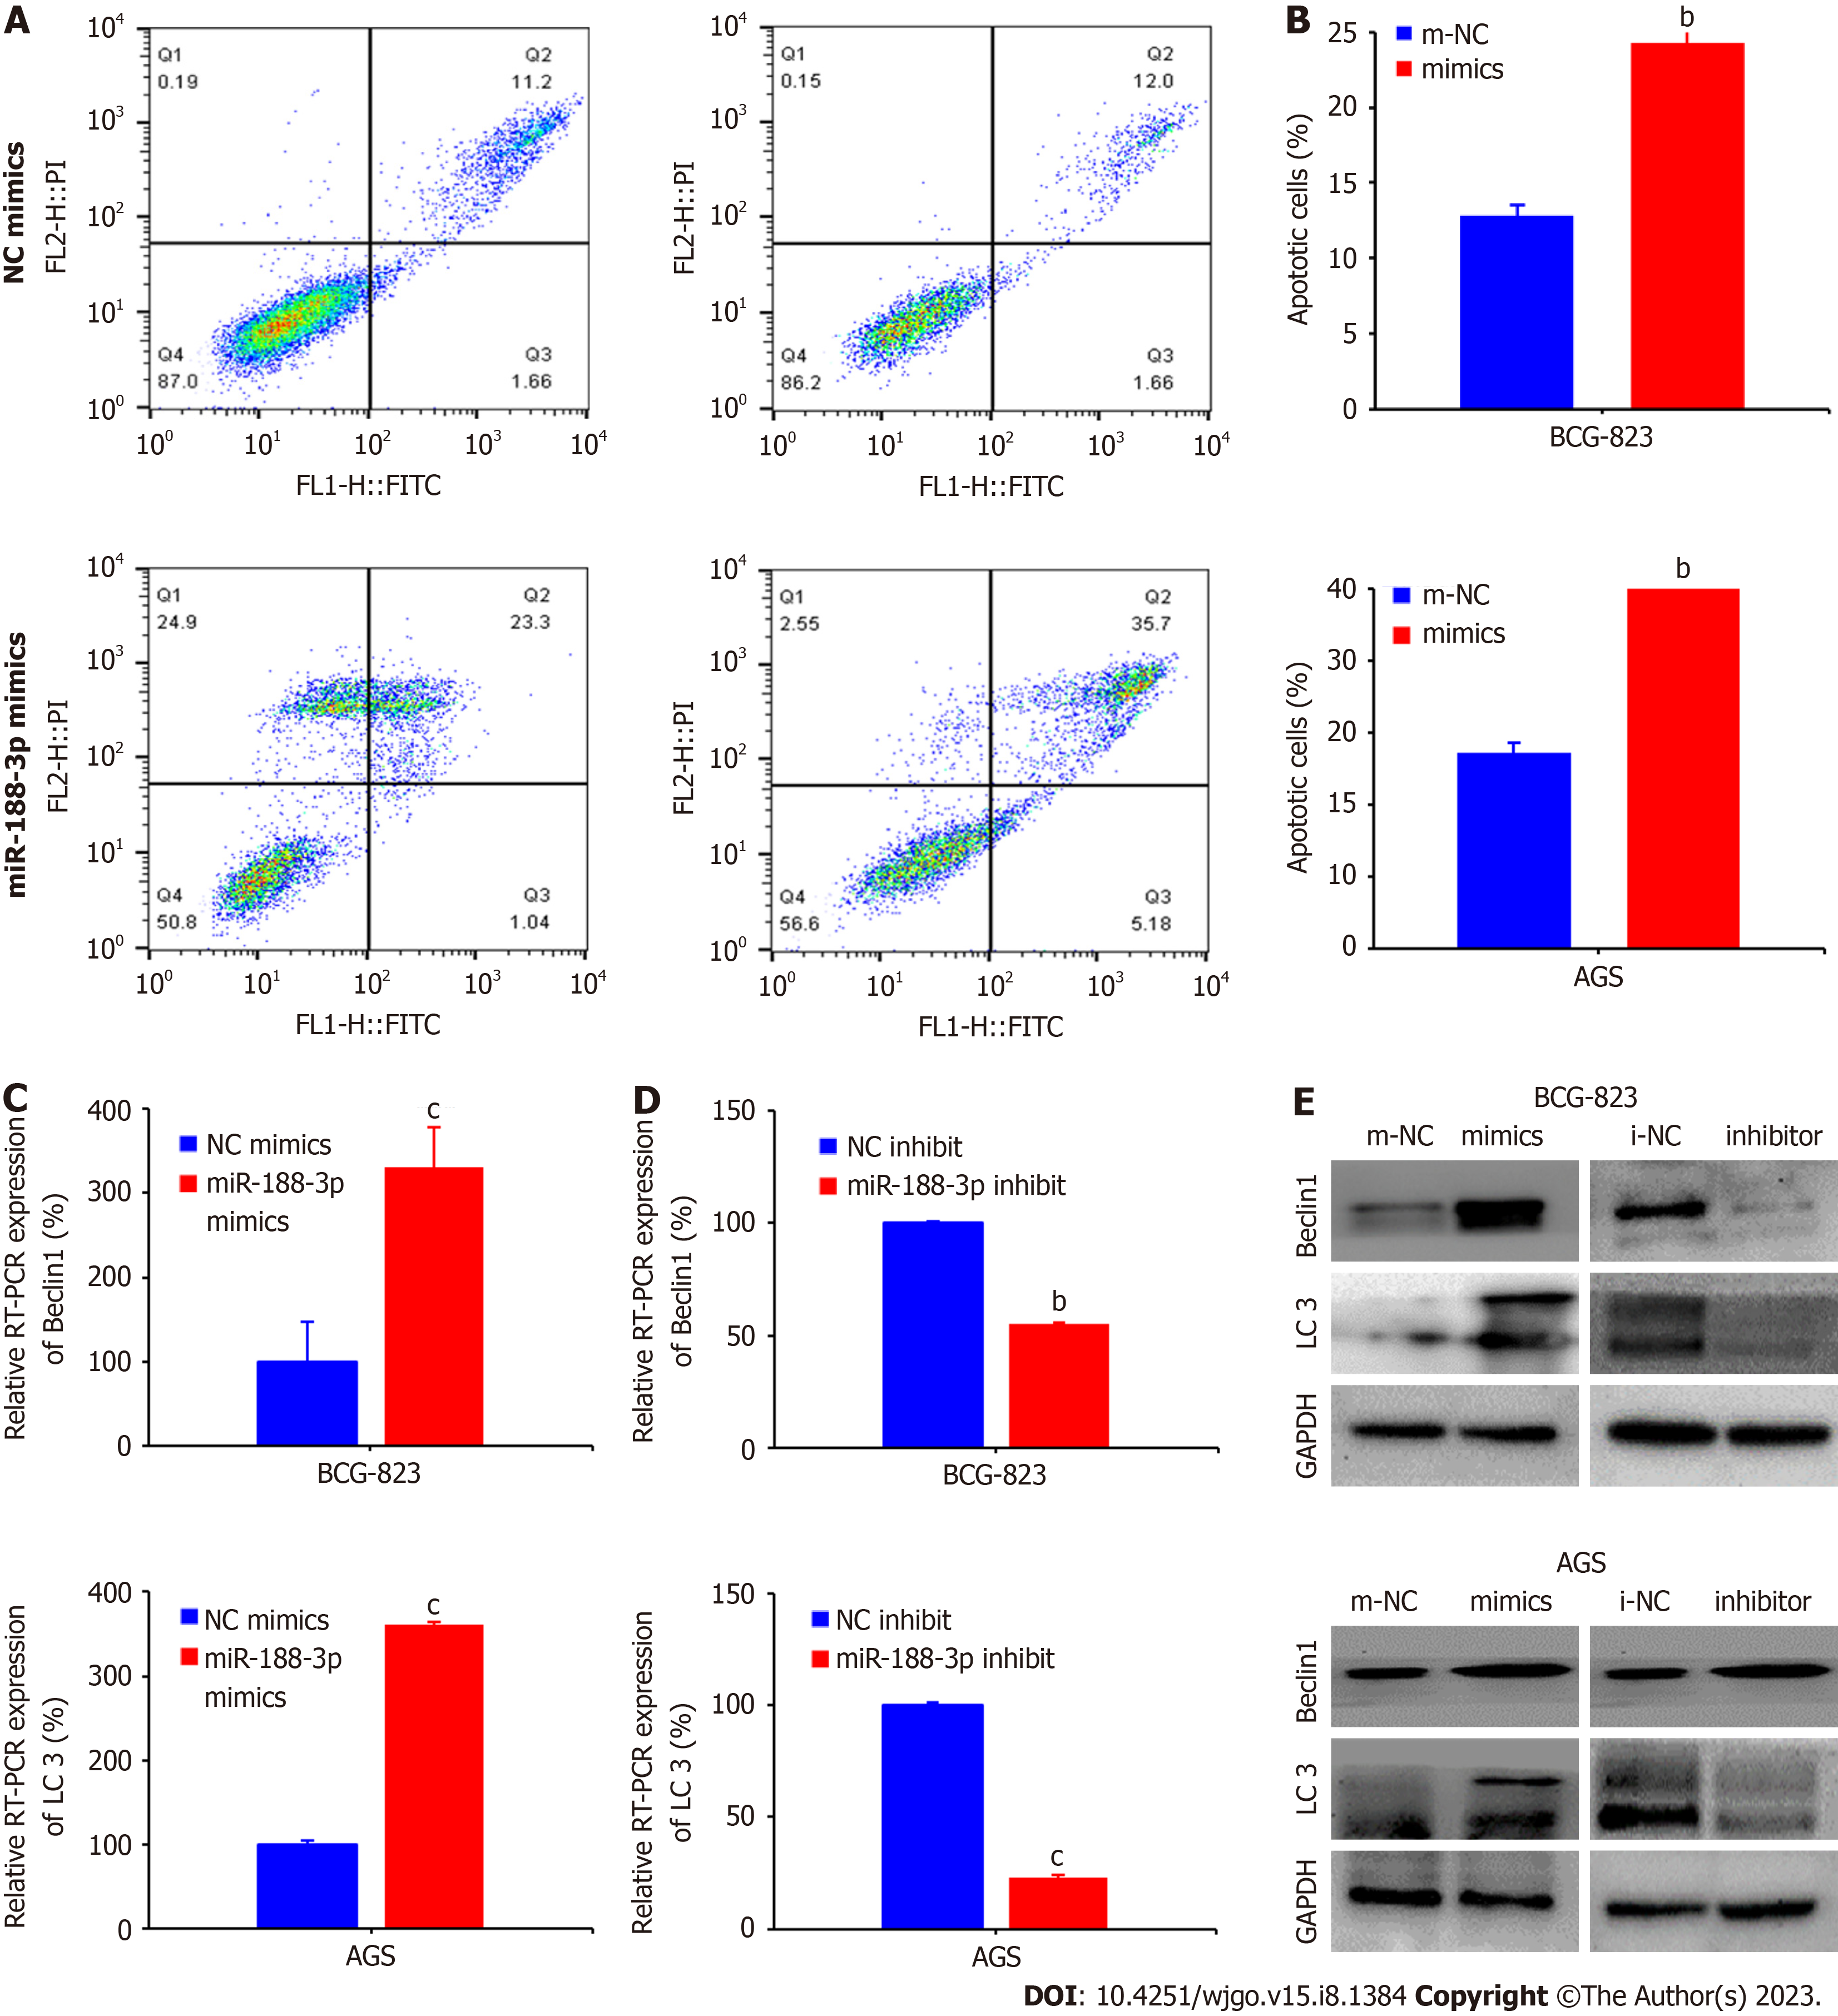
Figure 3 miR-188-3p induction of apoptosis and autophagy of gastric cancer cells.
A and B: Flow cytometric/Annexin V-PE/7-AAD assay. AGS and BGC-823 cells were seeded in six-well plates for transfection with miR-188-3p mimics, inhibitor, or their NC and assayed for tumor cell apoptosis. bP < 0.01; C: qRT-PCR. AGS and BGC-823 cells were plated for transfection with miR-188-3p mimics, inhibitor, or their NC and the qRT-PCR assay was performed. bP < 0.01 and cP < 0.001; D and E: Western blot. AGS and BGC-823 cells were plated in 10 cm dishes for transfection with miR-188-3p mimics, inhibitor, or their NC and Western blot was conducted for the detection of Beclin-1 and LC3-II/LC3-I proteins.
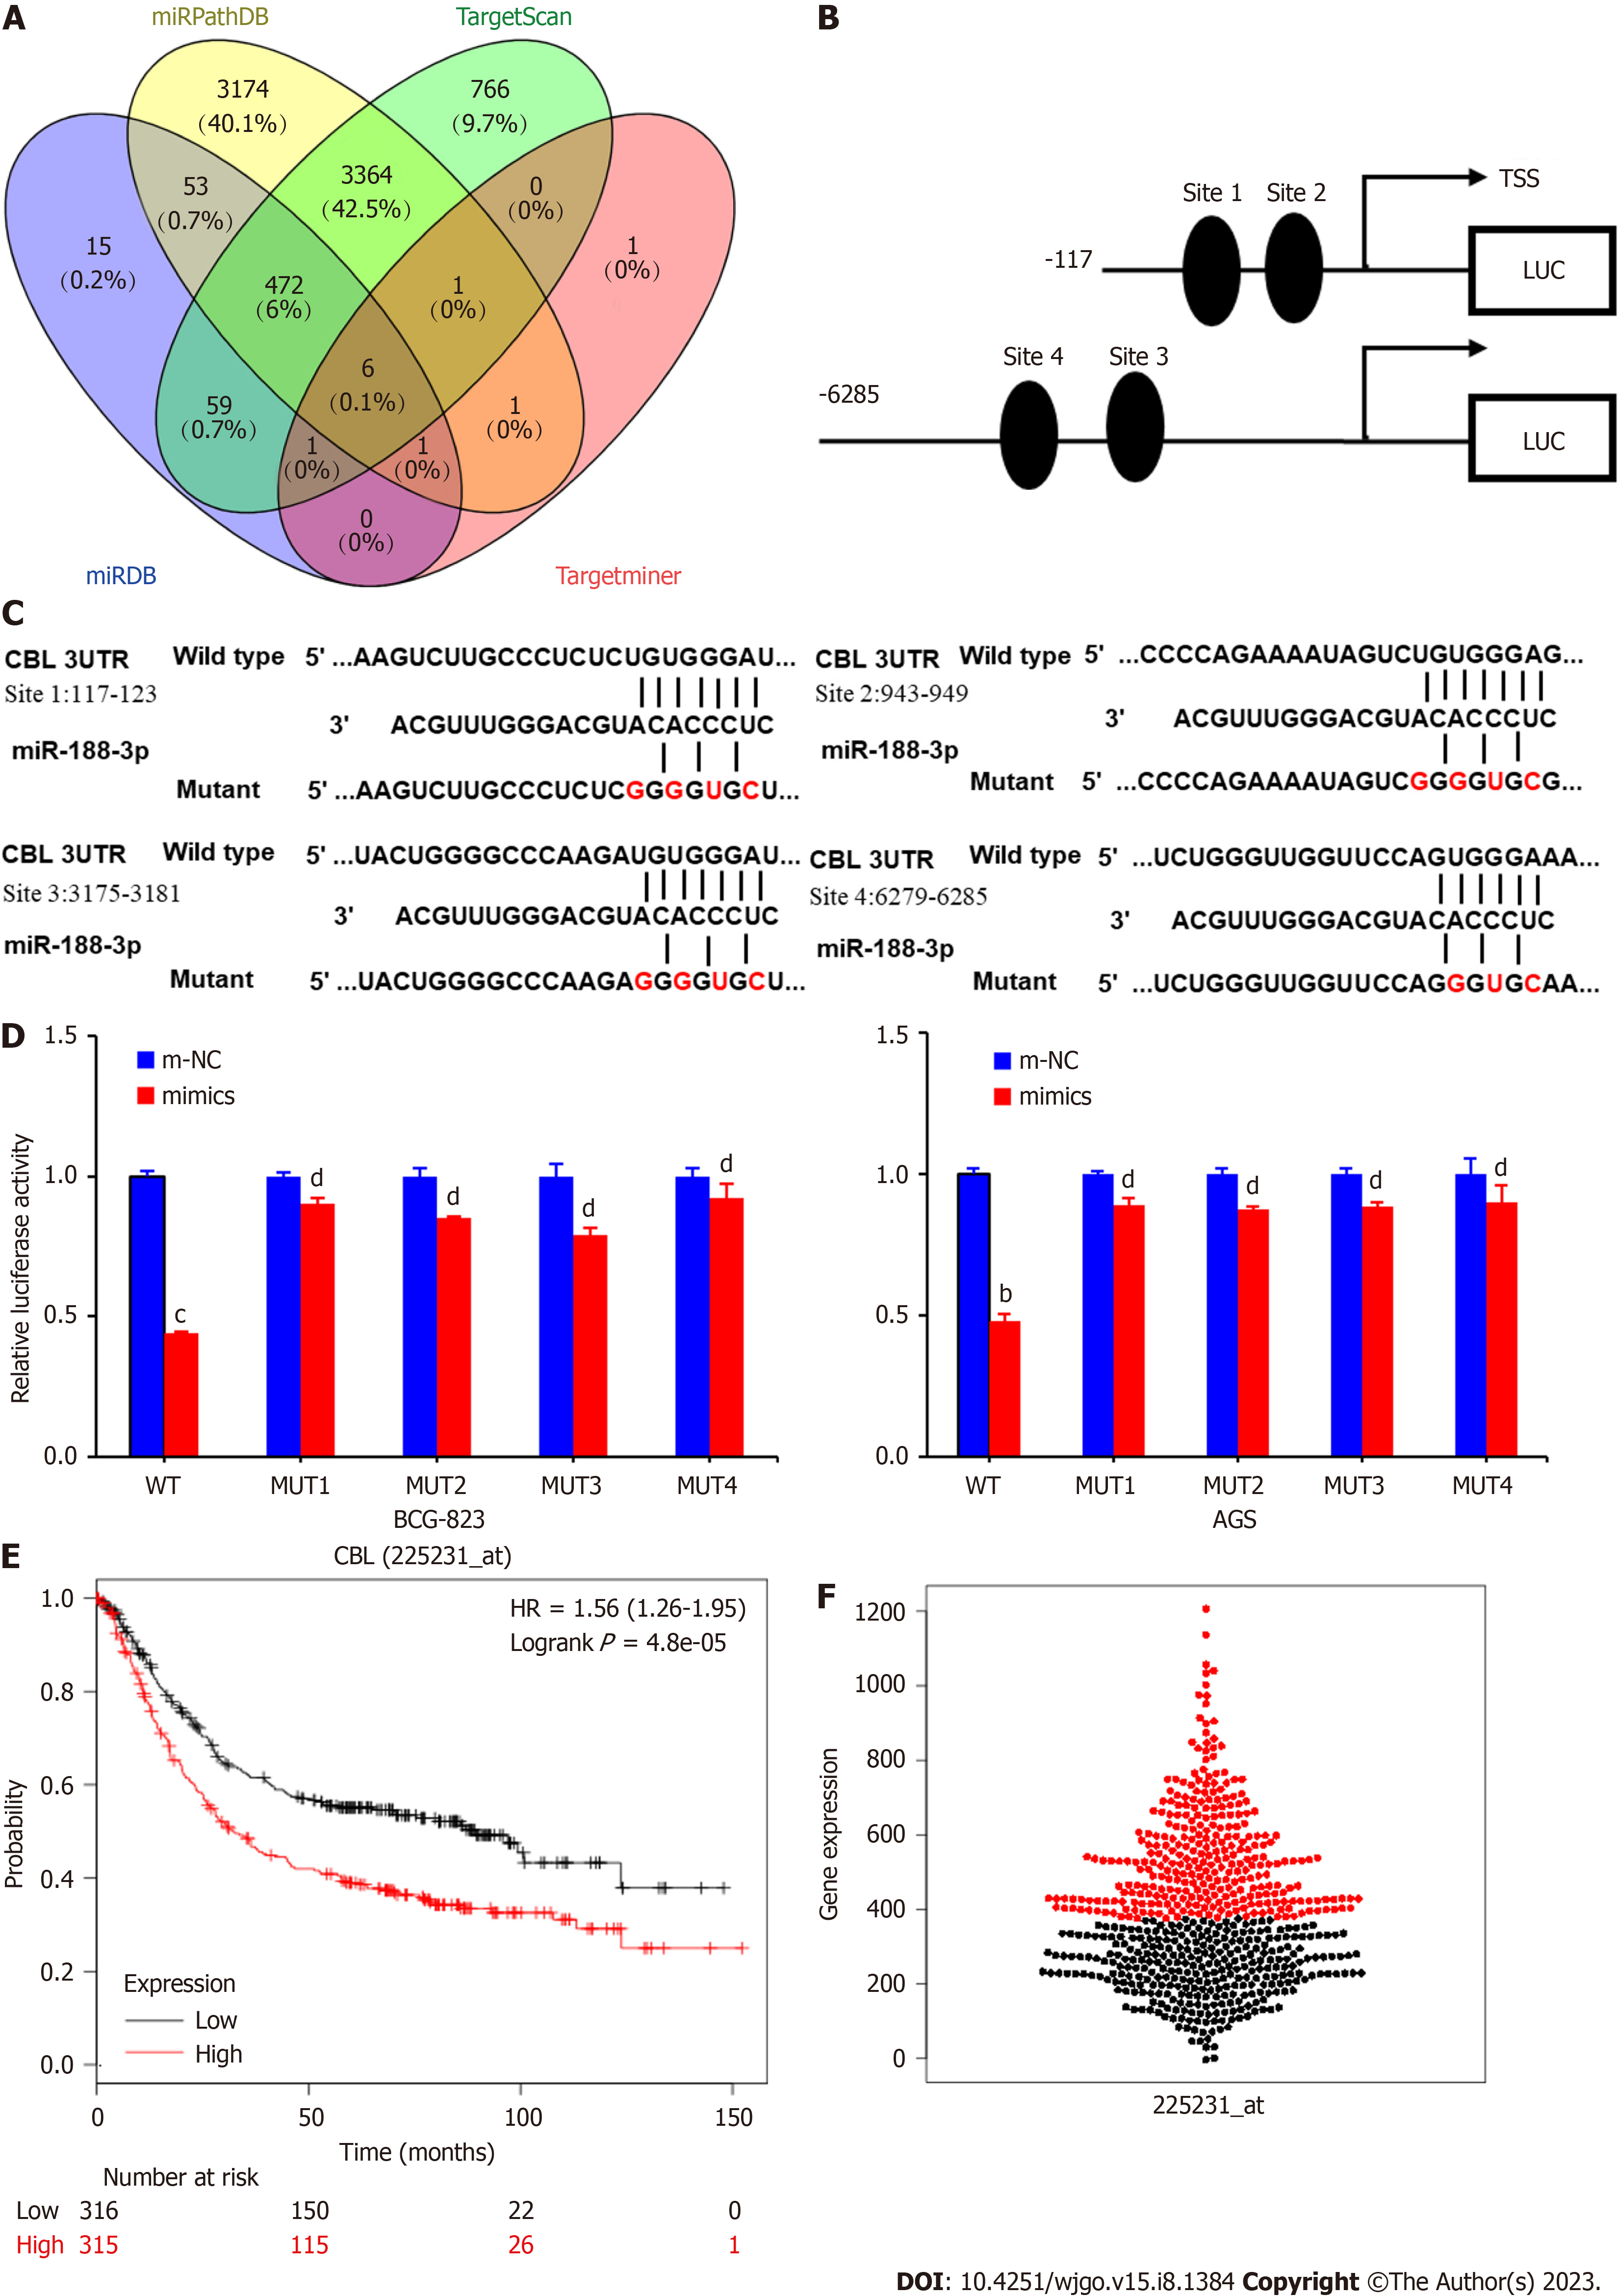
Figure 4 CBL as a direct target of miR-188-3p.
A: Bioinformatic prediction of miR-188-3p gene targets. We searched the TargetScan, miRPathDB, miRDB and TargetMiner databases for possible target genes of miR-188-3p. We selected six genes and CBL (an oncogene in gastric cancer) for a confirmation study; B and C: The putative miR-188-3p-binding sites of the CBL 3′-UTR. nt, nucleotides; D: Luciferase gene reporter assay. AGS cells were seeded in six-well plates for transient transfection with miR-188-3p mimics and with the reporter plasmid containing a luciferase gene fused to the target sequence of the wild-type (WT) 3'-UTR or mutant 3’-UTR of CBL using Lipofectamine 3000 for 36 h. Tumor cells were then lysed and an equal amount of protein samples was analyzed using the Luciferase Reporter Assay System. wt, wild type; mut, mutant; site 1, the miR-188-3p motif spanning nt:117-123 nt; site 2, the motif spanning nt 943-949 nt in the CBL 3′-UTR; site 3, the motif spanning nt 3175-3181nt in the CBL 3′-UTR; site 4, the motif spanning nt 6279-6285 nt in the CBL 3′-UTR. cP < 0.001, bP < 0.01, and dP > 0.05; E and F: Kaplan-Meier survival analysis. We utilized data from the KM-Plotter database (http://kmplot.com) and TCGA dataset (http://xena.ucsc.edu/public), and performed overall survival analysis.
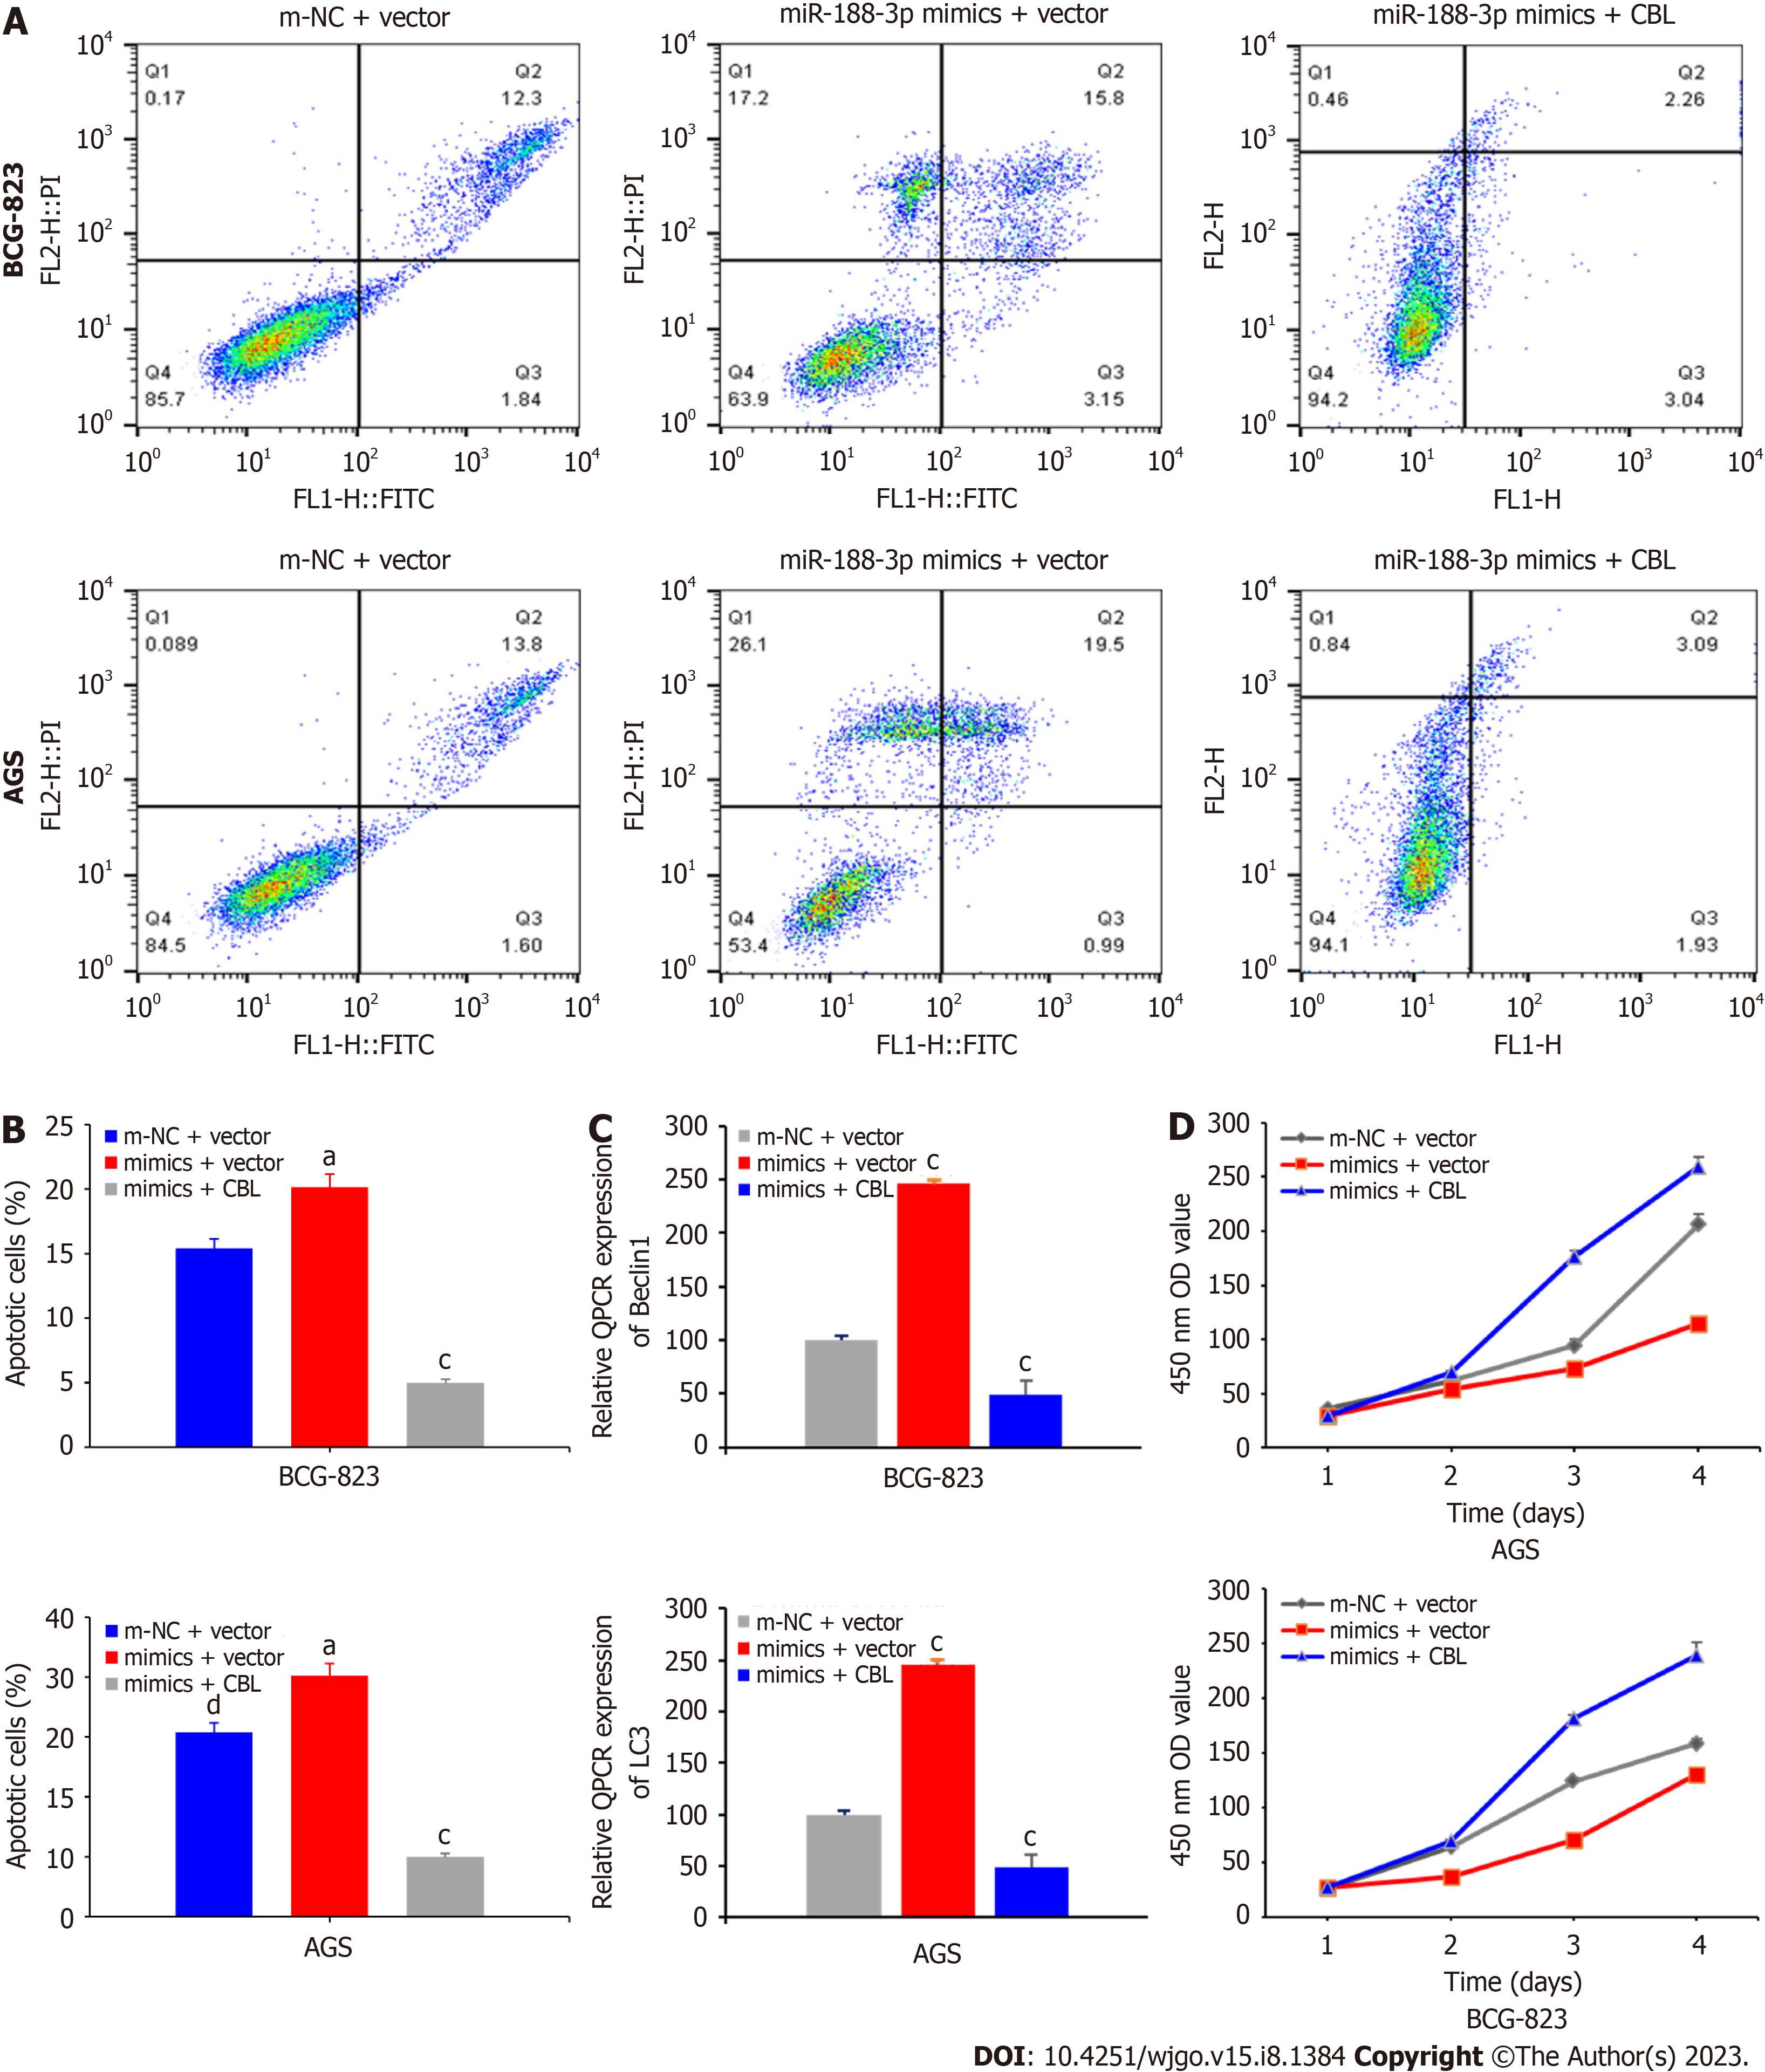
Figure 5 CBL antagonization of miR-188-3p reduced gastric cancer cell proliferation and induced gastric cancer cell apoptosis and autophagy in vitro.
A and B: Flow cytometry. AGS and BGC-823 cells were transfected with miR-188-3p mimics, miR-188-3p/CBL cDNA, or m-NC, miR-188-3p mimics + vector-only, after which the flow cytometric apoptosis assay was performed. cP < 0.001; C: qRT-PCR. AGS and BGC-823 cells were transfected with miR-188-3p mimics, miR-188-3p/CBL cDNA, or m-NC, miR-188-3p mimics + vector-only, after which qRT-PCR analysis was conducted. cP < 0.001; D: CCK-8 assay. AGS and BGC-823 cells were seeded for transfection with miR-188-3p mimics, miR-188-3p/CBL cDNA, or m-NC, miR-188-3p mimics + vector-only, after which the CCK-8 assay was performed.
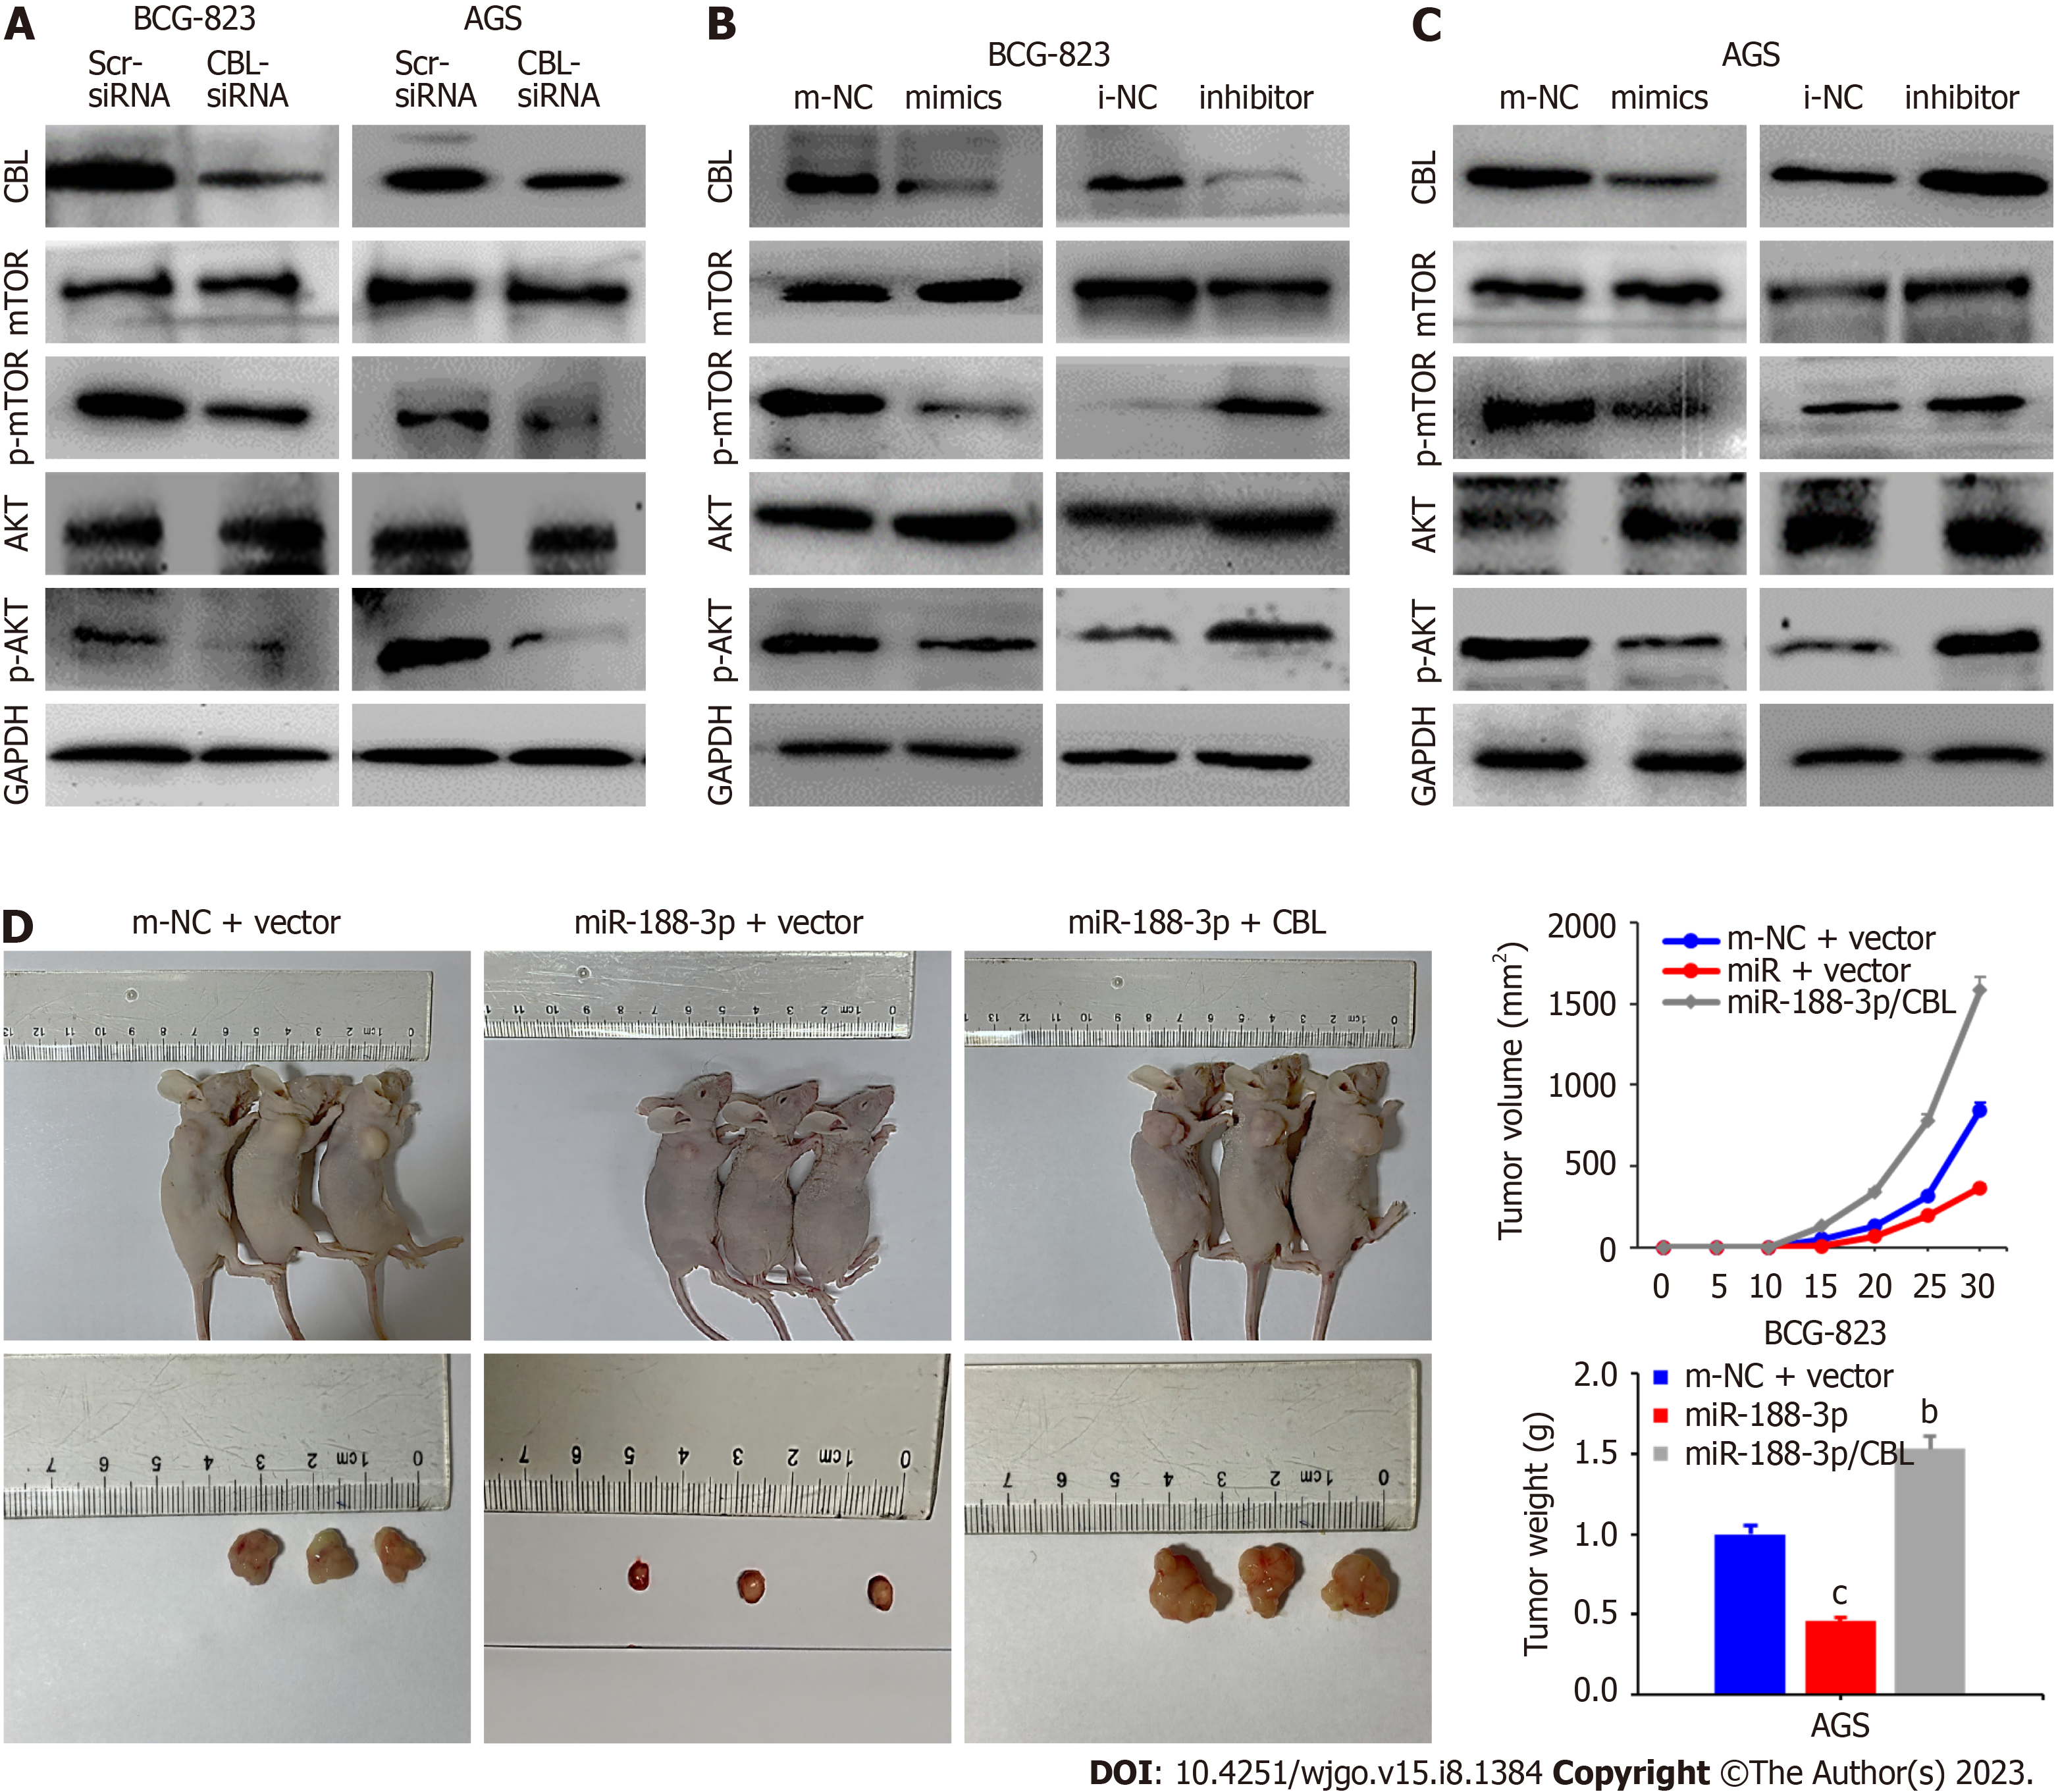
Figure 6 Effects of miR-188-3p expression on the regulation of gastric cancer cell proliferation viaCBL downregulation.
A: Western blot. BGC-823 cells were transfected with m-NC and vector, miR-188-3p/CBL cDNA, miR-188-3p mimics + vector-only and were then subjected to Western blotting. The expression of becline1 and phosphorylation of the Akt and mTOR proteins was decreased in gastric cancer cells after knockdown of CBL using CBL siRNA; B: Western blot. CBL, BGC-823 and AGS cells were seeded in 10 cm cell culture dishes for transfection with miR-188-3p mimic, inhibitor, or control (NC) plasmid, after which Western blot was performed; C: Nude mouse model of gastric cancer cell xenograft assay. The images of nude mouse tumor cell xenografts after injection with BGC-823/m-NC, BGC-823/miR-188-3p/CBL, or BGC-823/miR-188-3p cells; D: Tumor cell xenograft size. After tumor cell inoculation, tumor size was measured every 7 d in each group, m-NC vs miR-188-3p/CBL, bP < 0.001; miR-188-3p vs miR-188-3p/CBL cDNA, cP < 0.01.
- Citation: Lin JJ, Luo BH, Su T, Yang Q, Zhang QF, Dai WY, Liu Y, Xiang L. Antitumor activity of miR-188-3p in gastric cancer is achieved by targeting CBL expression and inactivating the AKT/mTOR signaling. World J Gastrointest Oncol 2023; 15(8): 1384-1399
- URL: https://www.wjgnet.com/1948-5204/full/v15/i8/1384.htm
- DOI: https://dx.doi.org/10.4251/wjgo.v15.i8.1384


