Copyright
©The Author(s) 2022.
World J Gastrointest Oncol. Dec 15, 2022; 14(12): 2353-2366
Published online Dec 15, 2022. doi: 10.4251/wjgo.v14.i12.2353
Published online Dec 15, 2022. doi: 10.4251/wjgo.v14.i12.2353
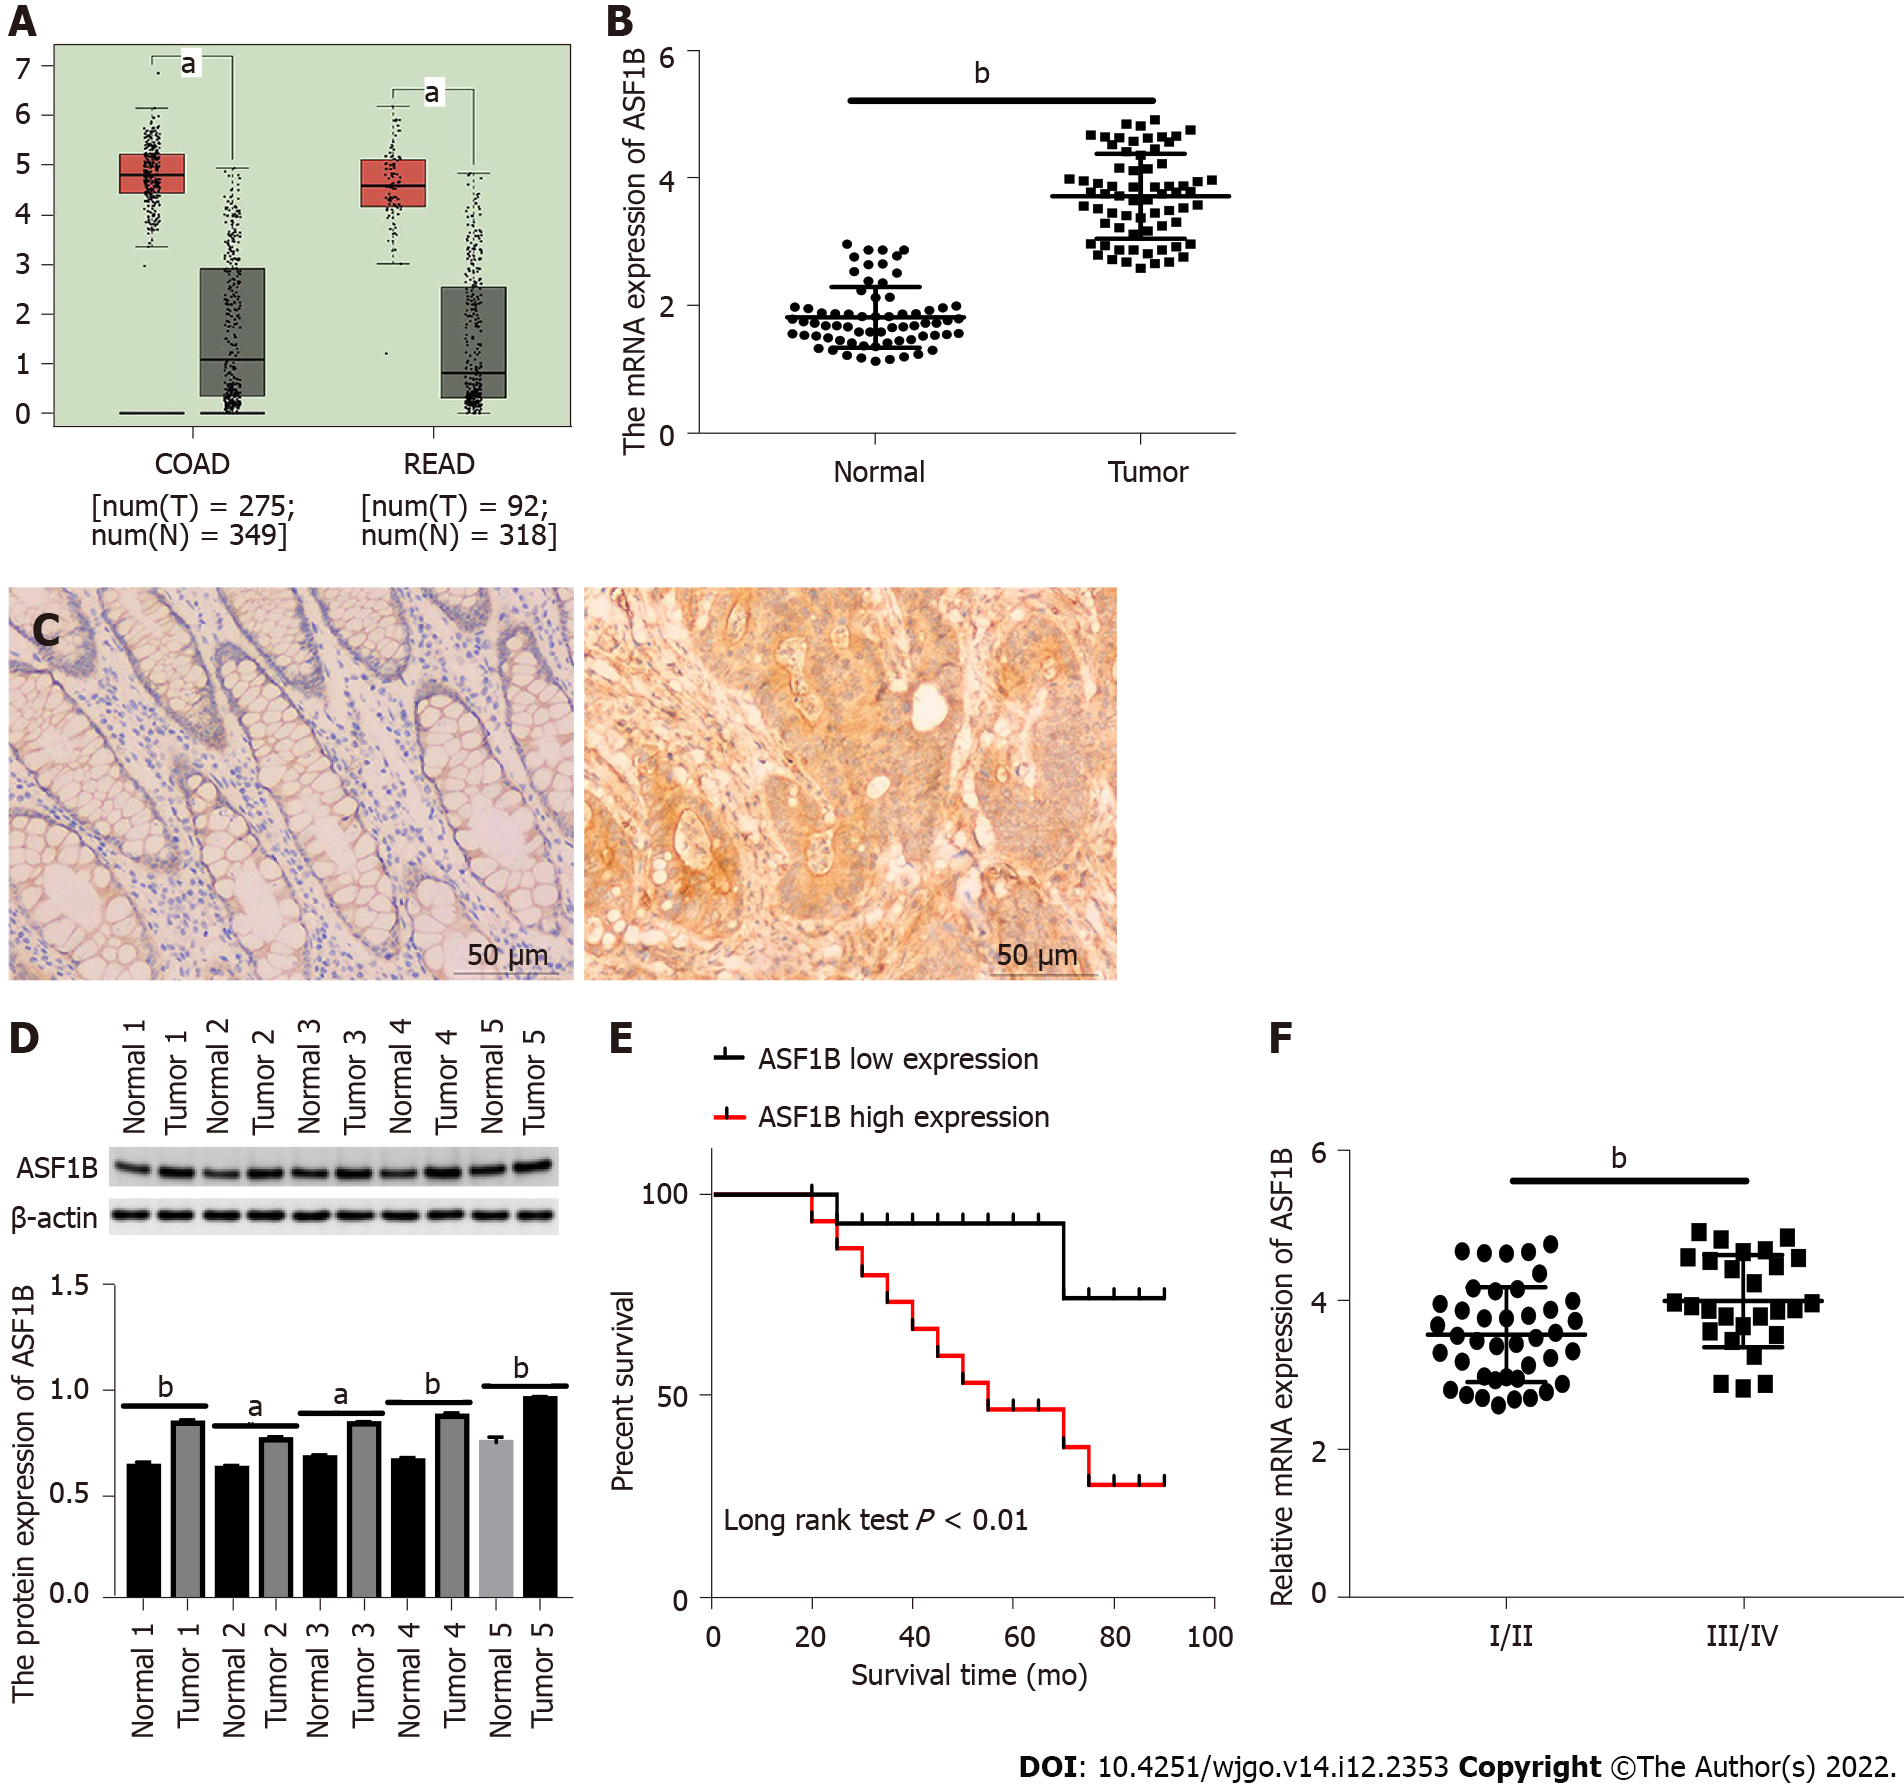
Figure 1 High expression of anti-silencing function 1B is observed in colorectal cancer tissues.
A: The expression of anti-silencing function 1B (ASF1B) in tumor tissues and adjacent normal tissues was predicted based on The Cancer Genome Atlas database; B: Relative mRNA expression of ASF1B was detected by quantitative real-time polymerase chain reaction (qRT-PCR) in adjacent normal tissues and tumor tissues of colorectal cancer (CRC) patients; C: The protein expression of ASF1B in normal tissues and tumor tissues was detected by immunohistochemical staining; D: The protein expression of ASF1B in normal tissues and tumor tissues was detected by western blot; E: Relative expression of ASF1B at tumor node metastasis (TNM) stage I/II and TNM stage III/IV was determined by qRT-PCR in tumors; F: Kaplan-Meier analysis of the correlation between ASF1B expression and overall survival of CRC patients. aP < 0.05, bP < 0.01. Each experiment was repeated three times. ASF1B: Anti-silencing function 1B.
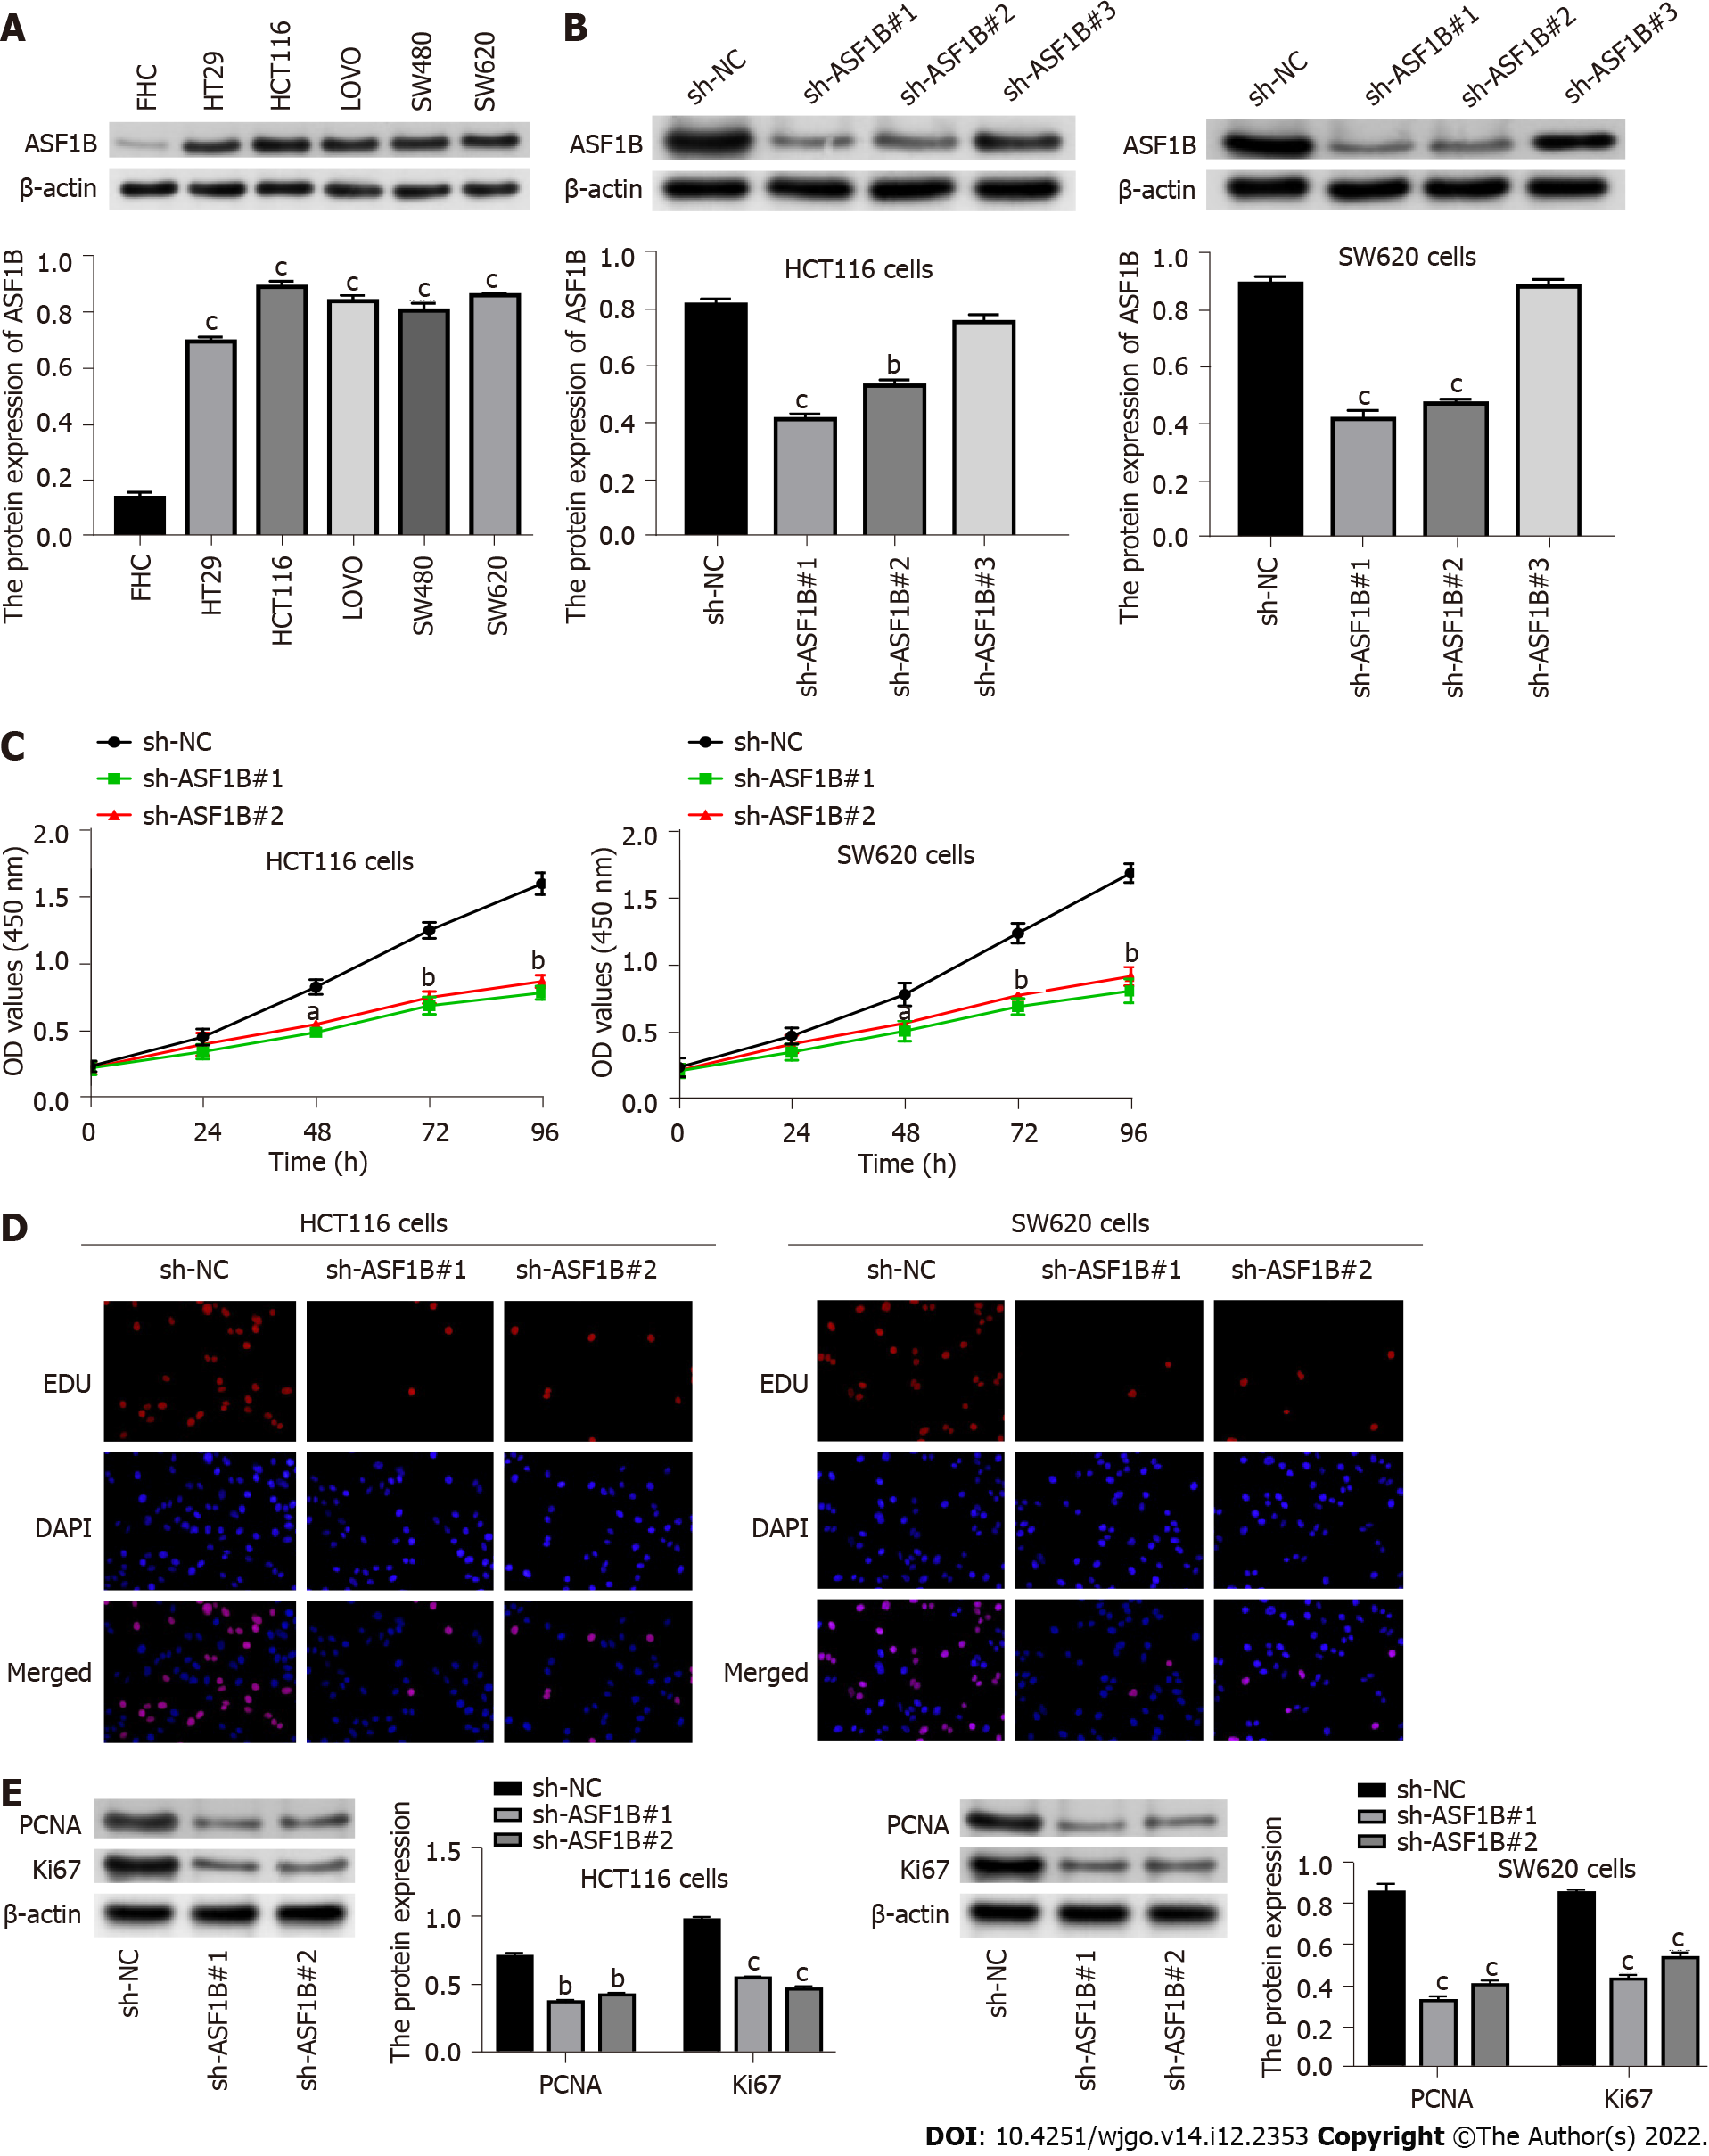
Figure 2 Silencing of anti-silencing function 1B impairs proliferation of colorectal cancer cells.
A: The protein expression of anti-silencing function 1B (ASF1B) was detected by western blot in FHC, HT29, HCT116, LOVO, SW480 and SW620 cells; B: The protein expression of ASF1B was detected by western blot in HCT116 and SW620 cells after transfection of sh-ASF1B#1, sh-ASF1B#2 or sh-ASF1B#3; C and D: The proliferation of HCT116 and SW620 cells was evaluated by Cell Counting Kit-8 and 5-Ethynyl-2’-Deoxyuridine assays after transfection of sh-ASF1B#1 or sh-ASF1B#2; E: Protein levels of PCNA and Ki67 were examined by western blot in HCT116 and SW620 cells after transfection of sh-ASF1B#1 or sh-ASF1B#2. aP < 0.05, bP < 0.01, cP < 0.001. Each experiment was repeated three times. ASF1B: Anti-silencing function 1B; NC: Negative control.
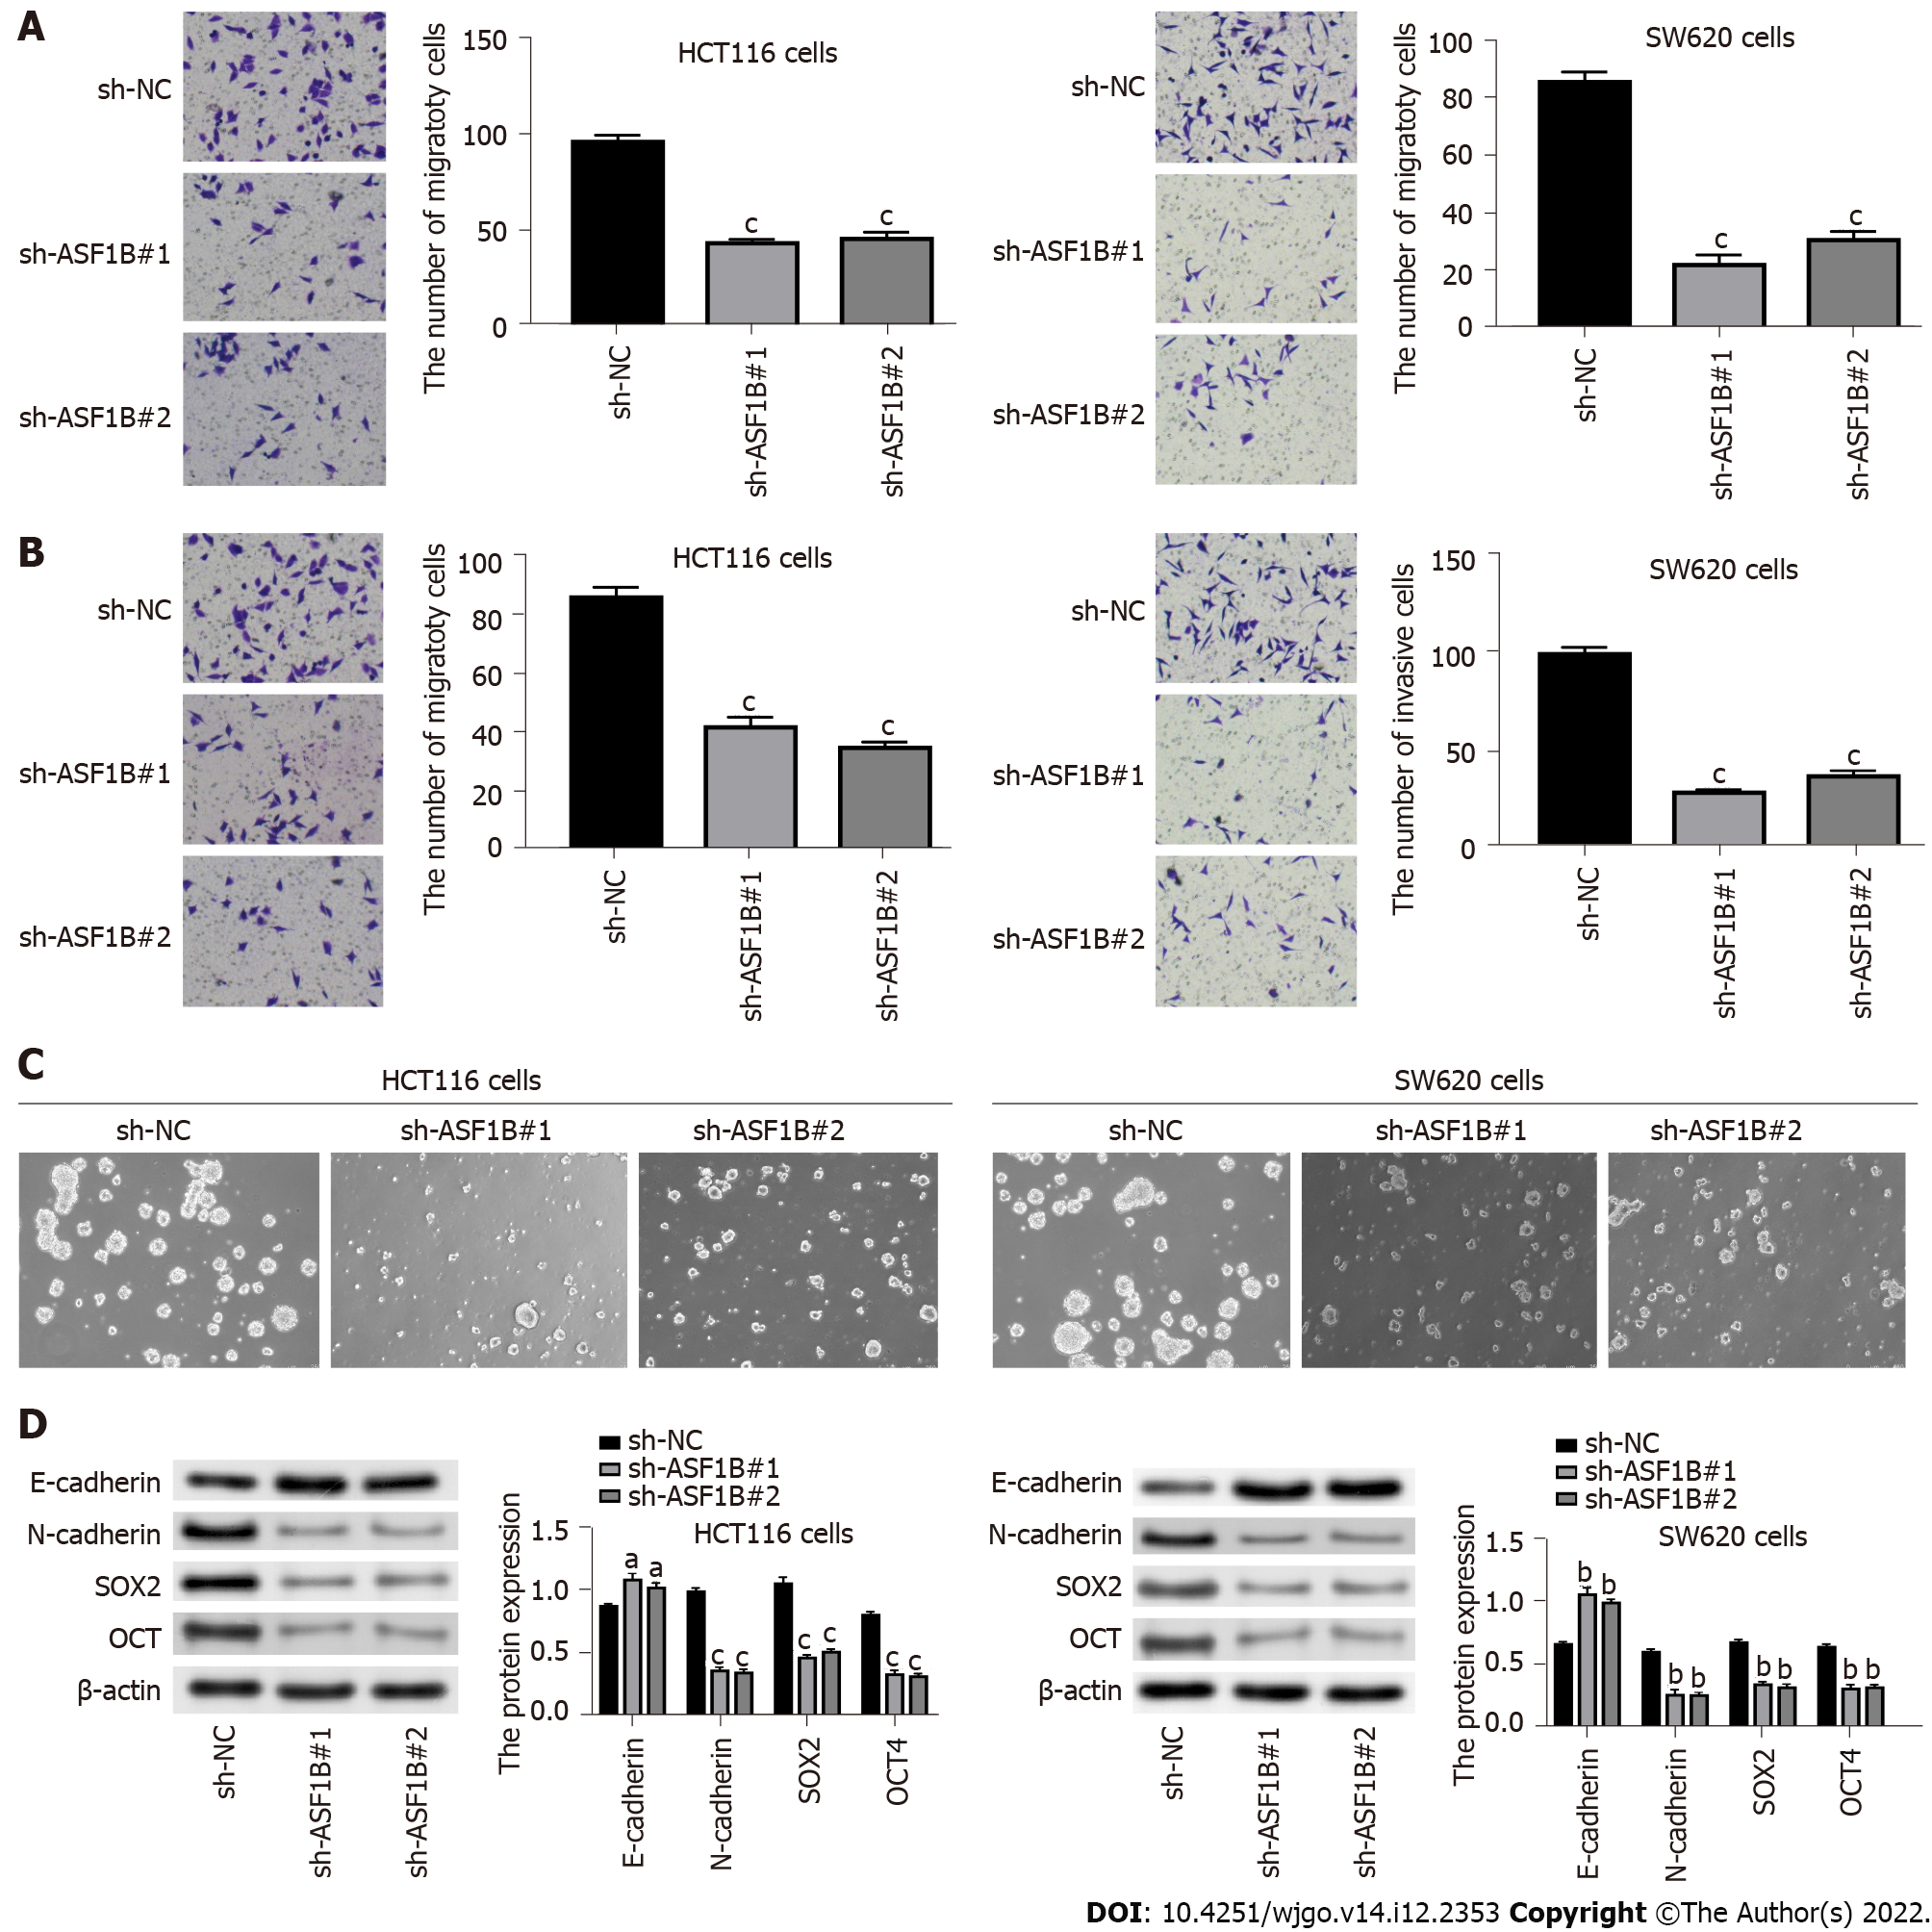
Figure 3 Anti-silencing function 1B down-regulation represses migration, invasion, stemness and epithelial mesenchymal transition of colorectal cancer cells.
A and B: Migration and invasion of HCT116 and SW620 cells were detected by transwell assay after transfection of sh-anti-silencing function 1B (ASF1B)#1 or sh-ASF1B#2; C: The stemness of HCT116 and SW620 cells was measured using the sphere formation assay after transfection of sh-ASF1B#1 or sh-ASF1B#2; D: Protein levels of E-cadherin, N-cadherin, SOX2 and OCT4 were detected by western blot in HCT116 and SW620 cells after transfection of sh-ASF1B#1 or sh-ASF1B#2. aP < 0.05, bP < 0.01, cP < 0.001. Each experiment was repeated three times. ASF1B: Anti-silencing function 1B; NC: Negative control.
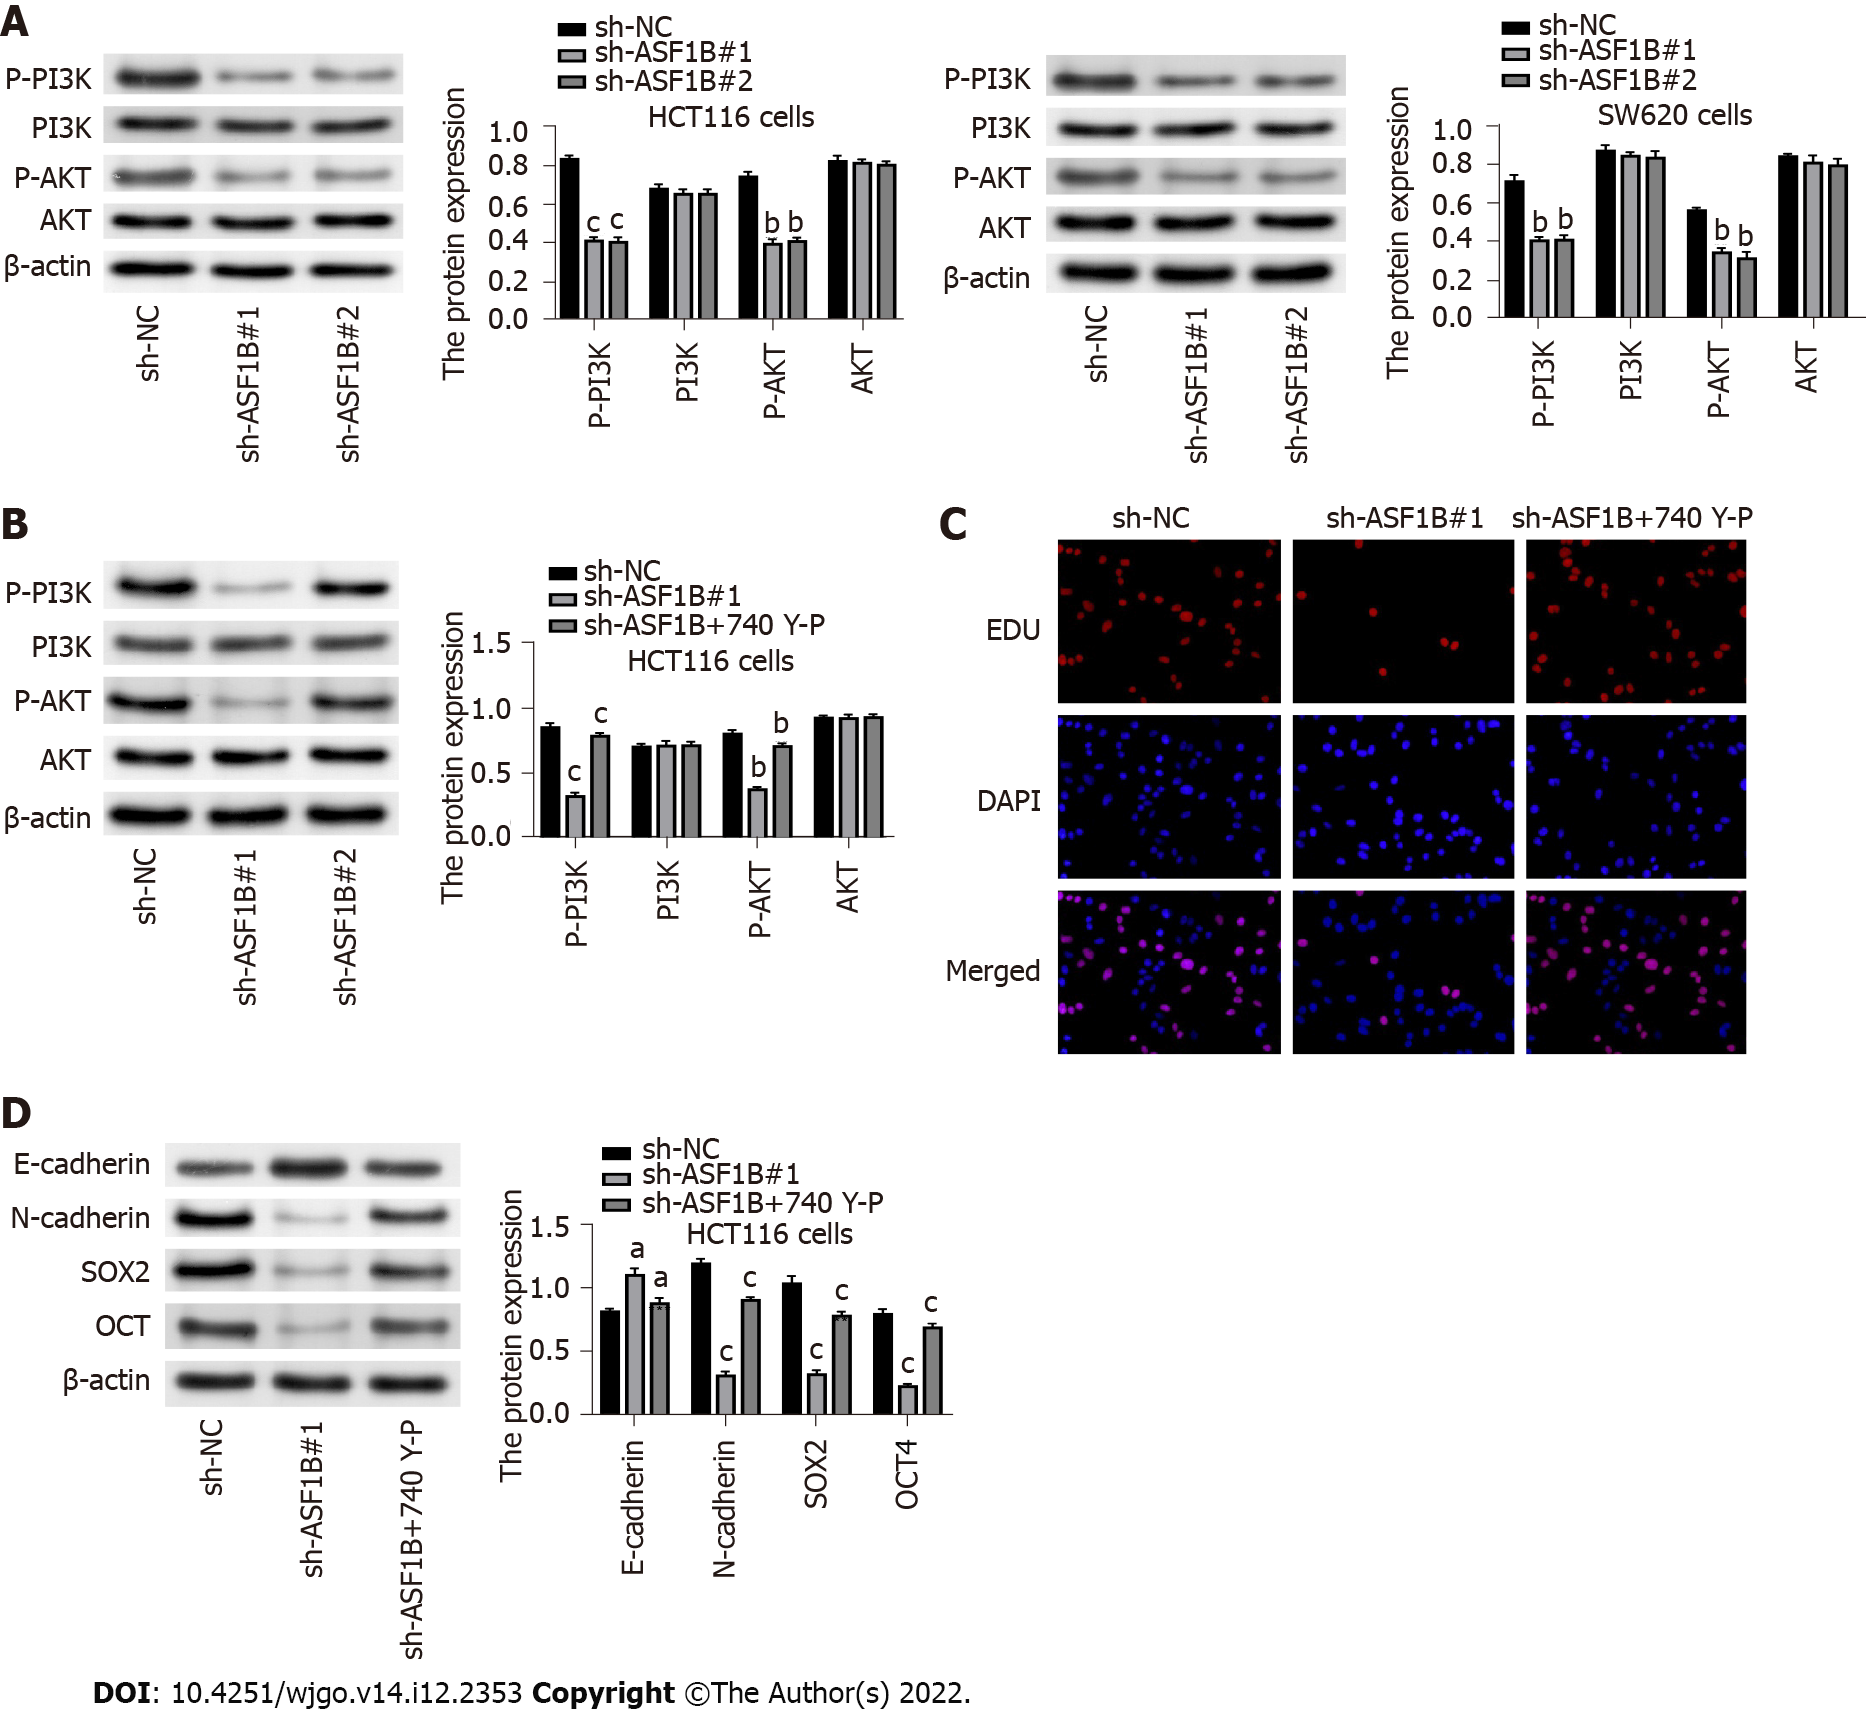
Figure 4 Phosphatidylinositol 3-kinase activator reverses the inhibitory impact of anti-silencing function 1B down-regulation on proliferation, stemness and epithelial mesenchymal transition of colorectal cancer cells.
A: Protein levels of p-phosphatidylinositol 3-kinase (PI3K), PI3K, p-AKT and AKT were detected by western blot in HCT116 and SW620 cells after transfection of sh-anti-silencing function 1B (ASF1B)#1 or sh-ASF1B#2; B: Protein levels of p-PI3K, PI3K, p-AKT and AKT were detected by western blot in HCT116 cells. Short hairpin RNA against ASF1B (sh-ASF1B#1) vs sh-negative control (NC), sh-ASF1B+740 Y-P vs sh-ASF1B#1; C: The proliferation of HCT116 cells was evaluated by the 5-Ethynyl-2’-Deoxyuridine assay; D: Protein levels of E-cadherin, N-cadherin, SOX2 and OCT4 were detected by western blot in HCT116 cells. sh-ASF1B#1 vs sh-NC, sh-ASF1B + 740 Y-P vs sh-ASF1B#1. aP < 0.05, bP < 0.01, cP < 0.001. Each experiment was repeated three times. ASF1B: Anti-silencing function 1B; NC: Negative control.
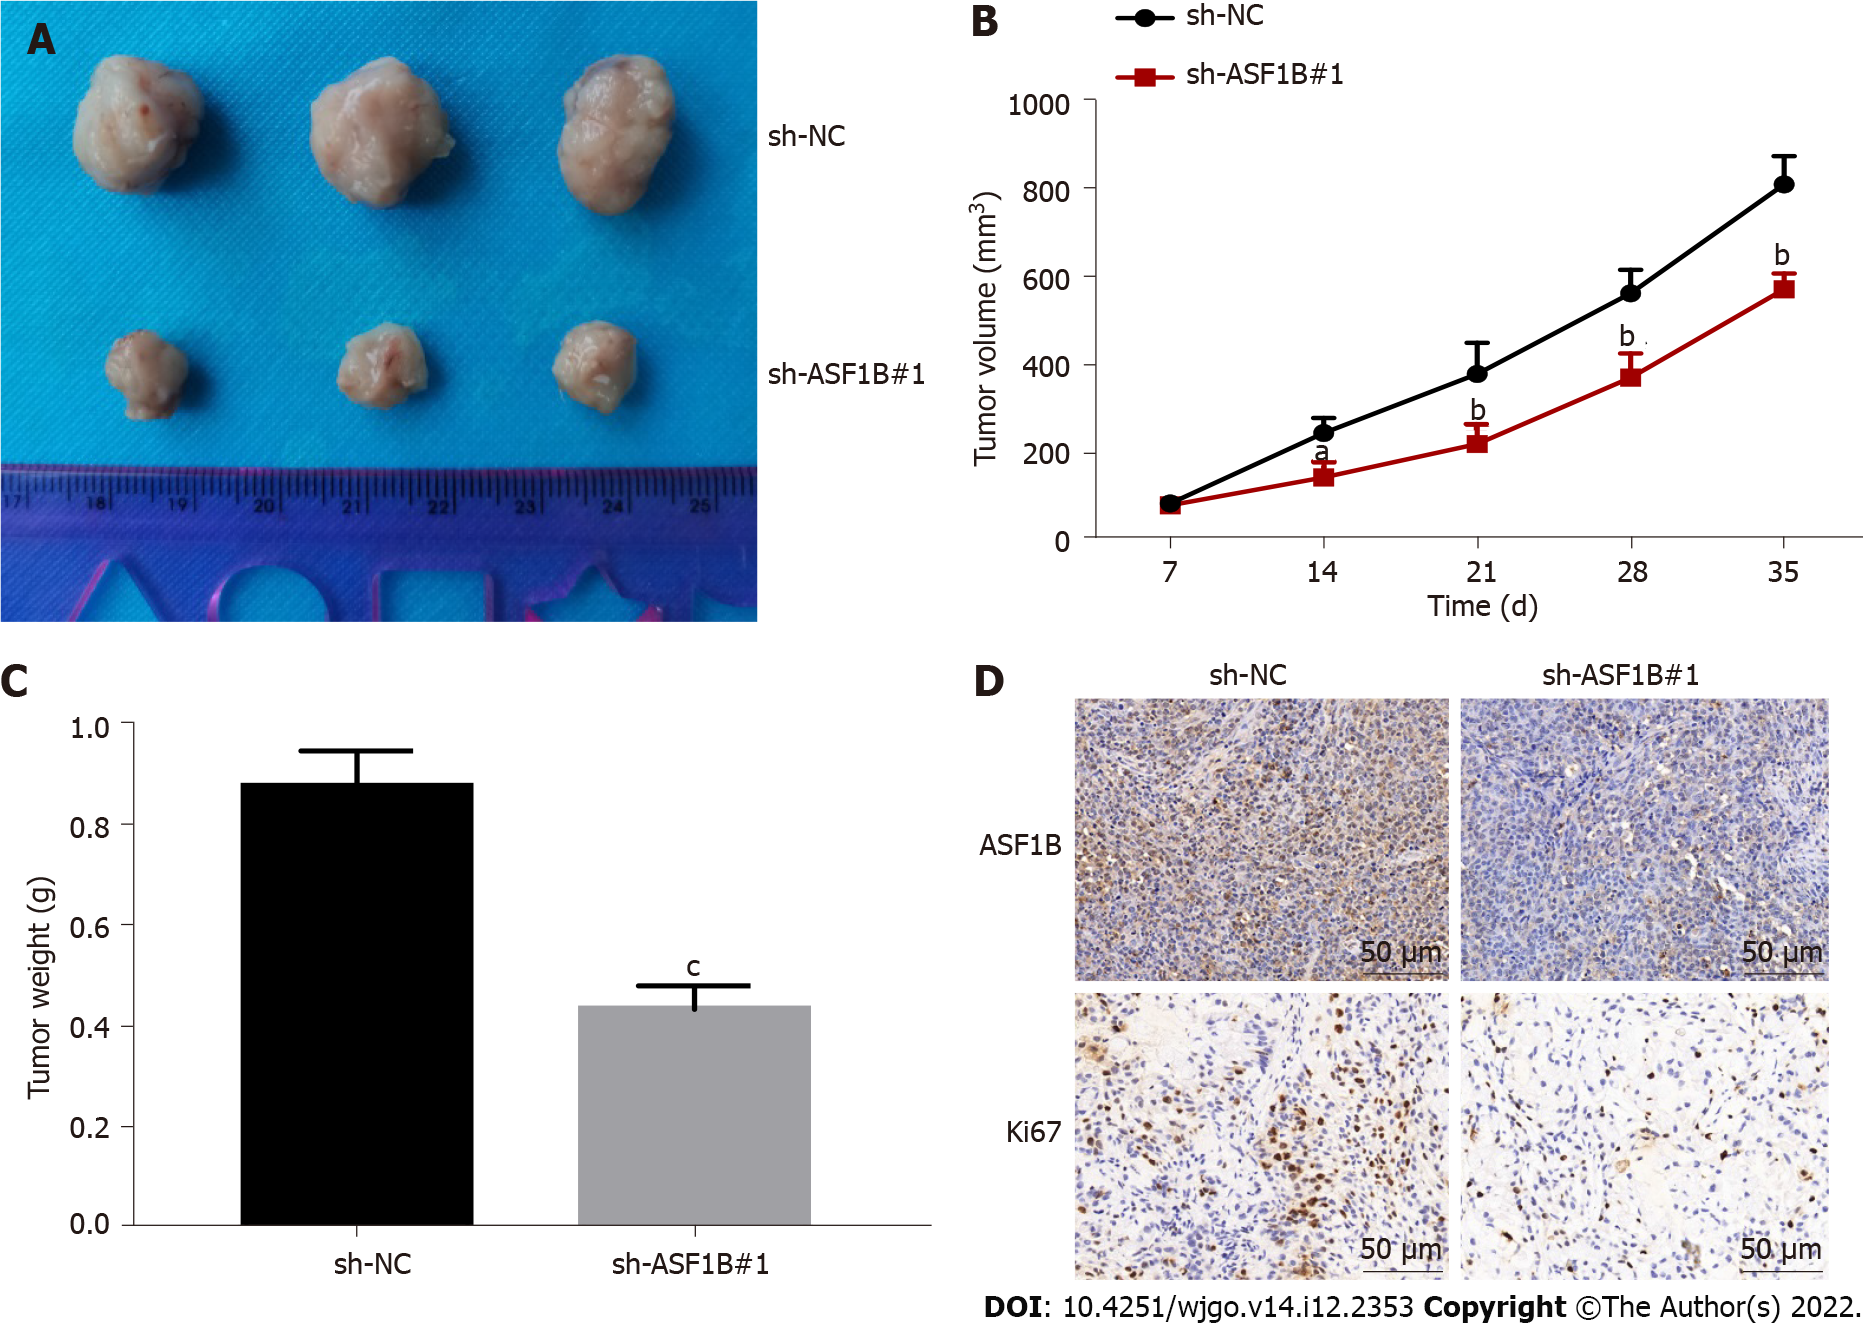
Figure 5 Silencing of anti-silencing function 1B represses colorectal cancer tumorigenesis in mice.
A: Representative images of tumors in xenograft mice; B: The tumor volume in xenograft mice was monitored every 7 d and then the tumor growth curves of mice were constructed; C: Average tumor weight of xenograft mice was gauged; D: Protein levels of Ki67 and anti-silencing function 1B in tumor tissues of xenograft mice were determined by immunohistochemical staining. aP < 0.05, bP < 0.01, cP < 0.001. n = 5. ASF1B: Anti-silencing function 1B; NC: Negative control.
- Citation: Yu GH, Gong XF, Peng YY, Qian J. Anti-silencing function 1B knockdown suppresses the malignant phenotype of colorectal cancer by inactivating the phosphatidylinositol 3-kinase/AKT pathway. World J Gastrointest Oncol 2022; 14(12): 2353-2366
- URL: https://www.wjgnet.com/1948-5204/full/v14/i12/2353.htm
- DOI: https://dx.doi.org/10.4251/wjgo.v14.i12.2353


